Download presentation
Presentation is loading. Please wait.

1
VERIFYING SPECIAL ED DATA TAMMY SOLTIS IU 5 DATA SUPERVISOR

2
YOU CAN’T VERIFY THE DATA IF YOU DON’T HAVE THE DATA!

3
GETTING THE DATA You will need the Student Template, along with the Special Ed 12-1 Snapshot EI Data will come from OCDEL Ask for support from your Special Ed Director and/or your Executive Director to get the files Must be the last submission to PIMS – to include anything done during the correction window You may have to put files together for some if they only submitted corrections and not full files

4
TOOLS WE USE VLOOKUP Looks at a field and compares it to a range of other fields – then returns a value if found. PIVOT TABLES Powerful Excel tool that can be switched up quickly to look at different data points within one spreadsheet

5
THE EI FILE Know what you need (and what you don’t). PA Secure ID (always – the only unique identifier in the file) DOB School District LEP Educational Environment Primary Disability Gender Race/Ethnicity Save off a copy of your original file and delete everything but these fields
 DOB School District LEP Educational Environment Primary Disability Gender Race/Ethnicity Save off a copy of your original file and delete everything but these fields.")
6
NOTES LEP Status: PELICAN reports Yes or No - School Age reports 01, 03, 99, etc. Verify reports from PSU list LEP or No LEP LEP on verify tables includes those coded as 01 and 98 No LEP on verify tables includes those coded as 03, 04, 05, and 99 AGE: Insert a formula based off of the DOB field. Remember, your formula needs to calculate the child’s age on 12-1-XX. I simply add a column with 12-1 populated down and subtract the DOB from it, then divide by 365.25 (to allow for leap year) and then round down There are many other formulas/ways to do this – use your preference
 and then round down There are many other formulas/ways to do this – use your preference.")
7
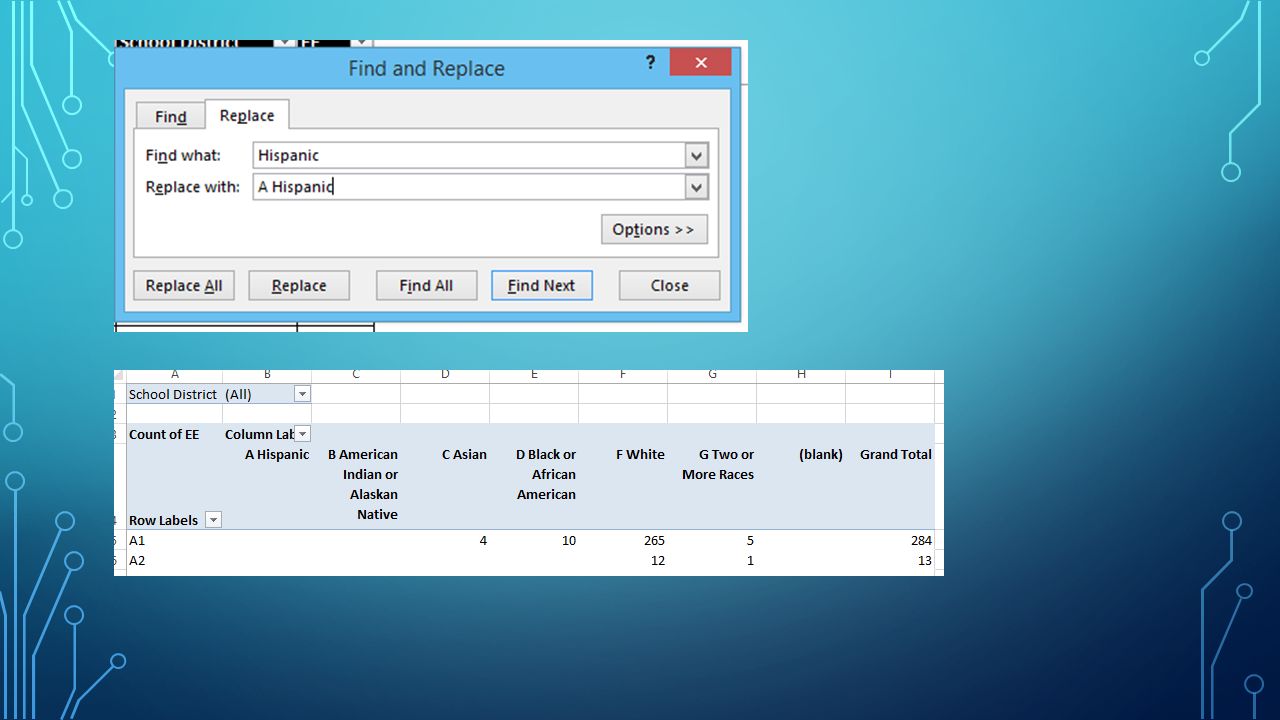
NOTES PELICAN has ethnicity codes of Other and Unknown – these are not school- age reportable codes. Per OCDEL – they default to Two or More Races Do a quick Find and Replace to fix these

8
MAKING IT EASY Excel will default to alphabetical order for Rows and Columns Data from PSU does not come in that order (?) It’s faster when verifying to have your columns/rows in the same order as the PSU files. Label your columns with letters of the alphabet first (A Hispanic/Latino, B American Indian, etc.). Do a quick find and replace (or VLOOKUP) to change the names of your columns to start with these letters so that they’re in the same order
. Do a quick find and replace (or VLOOKUP) to change the names of your columns to start with these letters so that they’re in the same order.")
10
I recommend doing the same for the Primary Disability column. It just really makes it so much easier to verify the numbers. You’ll want to end up with a spreadsheet that looks like this: No - this isn’t real data.

11
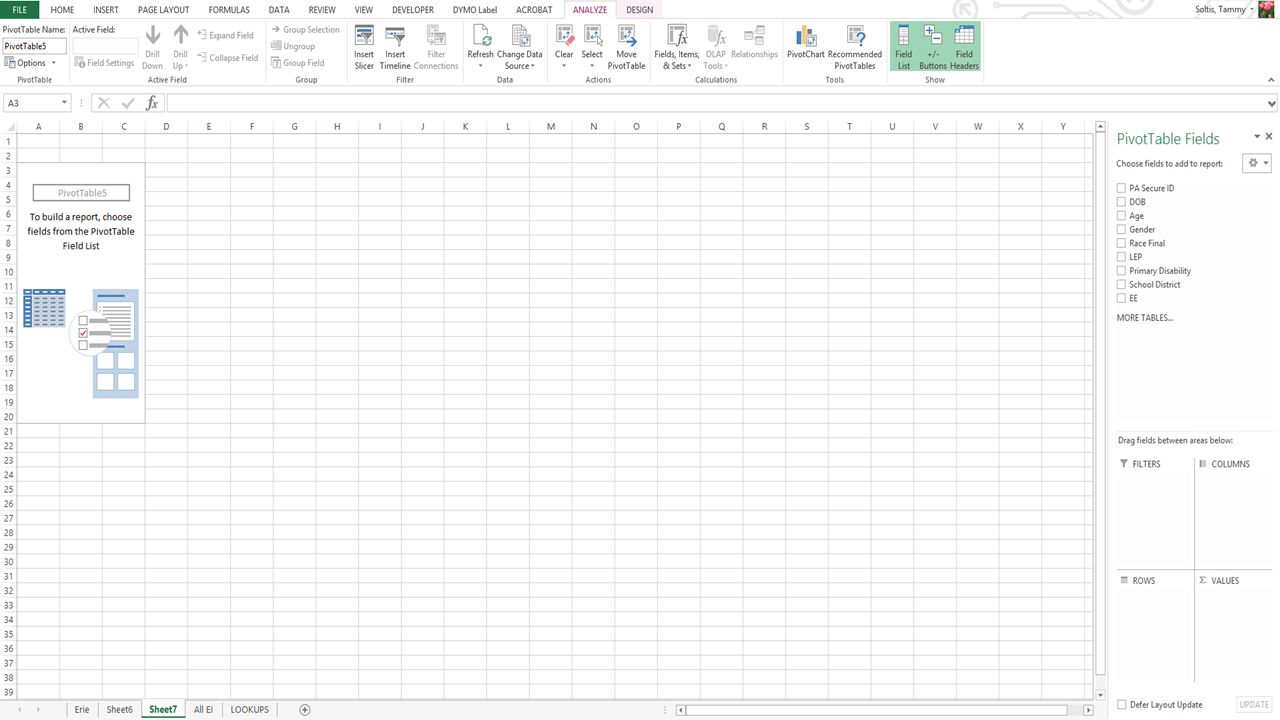
PIVOT TABLES Excel makes these easy Highlight all data and click the INSERT tab Click Pivot Table

12
Accept the defaults in the dialogue box. Excel will create the Pivot Table in a new Worksheet

14
Look at the data you want to verify. Drag the fields into the appropriate boxes. For example, this table is looking at Educational Environment and Disability. EE are down the left and Disability is across the top. EE will be the rows and Disability will be the columns

15
We want counts of EE, so drag that field into the “Values” box. It should default to count of… If not, click the drop-down box and select Value Field settings. From here, you can change to Sum, Count, Average, Max, Product, etc. Filters: We want to verify all of the data for the IU, but then each individual School District, so we’ll add School District as a filter. It should look like this.

16
I format the Row Labels so that I can look at it in one nice, neat & tidy table.

18
Now apply the filter to verify all of the tables by School District by clicking on the drop-down arrow.

19
Work through your EI tables by changing up what makes up the rows and columns. NOTE – At our IU, we are a MAWA as is Erie’s Public Schools – a school district within our IU. If this is the case for you, you’ll need their 12-1 file in order to verify the data as the verify reports are IU-wide. EI is done! If at any point you make a change to the source data (the table that the pivot table is built on) right click anywhere in the Pivot Table and select Refresh. This will bring in all current data to the Pivot Table. Now on to School Age
 right click anywhere in the Pivot Table and select Refresh. This will bring in all current data to the Pivot Table. Now on to School Age.")
20
SCHOOL AGE DATA EI data is easier – all points are pulled from the same file. Not the case for School Age. Some of the points are pulled from the Special Ed Snapshot and some from the Student Template. I pull the information I need into one spreadsheet using the VLOOKUP formula. Since the PASecure ID is the unique key and common between both the SpEd Snap and Student Template, Excel can look from one to the other for details and return answers. I keep a “Look Ups” file in a convenient place because I use it often. It contains the PIMS codes and their text equivalents (for example, a race code of 5 = white, EE code of 19 = Inside the regular ed class 80% or more)
.")
21
CLEAN UP YOUR SPREADSHEETS FIRST School Age verify reports look at: PASecureID AUN (District Code) Primary Disability LEP Educational Environment Race Gender School Age and Preschool together looks at PASecureID AUN (District Code) Primary Disability LEP Educational Environment Race Gender Age
 Primary Disability LEP Educational Environment Race Gender School Age and Preschool together looks at PASecureID AUN (District Code) Primary Disability LEP Educational Environment Race Gender Age")
22
CLEANING UP YOUR SPREADSHEETS FIRST SAVES TIME Special Ed Snapshot PASecure ID AUN # Primary Disability Educational Environment Student Template PASecure ID AUN DOB Gender Race LEP/ELL Status

23
COMBINING FILES I purchased a tool that combines all of the data from multiple spreadsheets into one. (Well worth the $10 I spent on it.) You can email Calvin Weight jobs@excelVBAmaster.com to inquire about purchasing the tool.)jobs@excelVBAmaster.com You can do the same manually by copying all columns and rows from each of your district Special Ed Snap Files into one file and then doing the same with the Student Template so that you are working with two big files. Delete all columns in each worksheet except those listed in slide 21
 You can Calvin Weight to inquire about purchasing the You can do the same manually by copying all columns and rows from each of your district Special Ed Snap Files into one file and then doing the same with the Student Template so that you are working with two big files. Delete all columns in each worksheet except those listed in slide 21.")
24
USING VLOOKUP Faster than Find/Replace Looks at a field in one table, tries to find a match in another set of data and returns with a value in the same row that you designate For example, look at the PA Secure ID in the Student Template, find it in the Special Ed Snapshot and enter the value in column 2 Ultimately, we want to end up with one spreadsheet that has all of the fields that we need to verify. I also use this to change coding to words

25
Student TemplateSpecial Ed Snapshot

26
Run VLOOKUP formulas to pull the information from the Special Ed Snap into the Student Template: Name the range of your Special Ed Data I want Excel to look for the PA Secure ID from the Student Template, find it in the Sp Ed Snap, and return the value in column 3 (Primary Disability) =VLOOKUP(A2,SpEd,2,FALSE) Do the Same for EE
 =VLOOKUP(A2,SpEd,2,FALSE) Do the Same for EE")
27
I also use the VLOOKUP formula to replace codes with words since this is the way they come on the verify reports -

28
After you’ve run all of the VLOOKUPs and your data looks ready to verify, insert a Pivot table and see how it looks. Your spreadsheet should look something like this:

29
Insert a pivot table as you did for EI, choose your rows and columns and verify.

30
School Age : Home District by Eligible Exceptionality

31
3-21 Open your EI file that you used to verify your EI data Copy the data to a blank spreadsheet in your Special Ed/Student Template file Don’t worry that the Educational Environment of EI doesn’t match up to school age – they’re not part of the 3-21 verification tables. Rearrange your columns in your EI table to match exactly to your school age table. Copy the EI data to the bottom of the school age data

32
Go through the same steps to insert a pivot table based on this combined SA/EI data. Age 3-21 by Age and Primary Disability:

33
Verify IU data, then select the filter and verify each school district

34
Easily move from table to table just by switching up your columns and rows.

35
It seems like a lot of work, but it really goes very quickly. Once the set-up is complete, you can verify your data very very quickly After you do it the first year, you’ll be able to use your look-up data (EE, Race, Primary Disability, etc.) over again. Knowing how to use these tools can come in handy for a lot of other tasks besides Special Education data. QUESTIONS?
 over again. Knowing how to use these tools can come in handy for a lot of other tasks besides Special Education data. QUESTIONS .")
Similar presentations


 354-7313.>")
 OR Click on Start All Programs Microsoft Office Microsoft Office Excel 2003.>")


![Microsoft ® Office Excel ® 2007 Training Get started with PivotTable ® reports [Your company name] presents:](/16/5093036/big_thumb.jpg "Microsoft ® Office Excel ® 2007 Training Get started with PivotTable ® reports [Your company name] presents:>")


