Download presentation
Presentation is loading. Please wait.

1
The Measurement of Bed Load Sediment Transport in Rivers and Estuaries using Stationary and Moving ADCP Methods (using workhorse, channel master and stream pro) David Williams AIMSDarwin Northern Territory Northern TerritoryAustralia
 David Williams AIMSDarwin Northern Territory Northern TerritoryAustralia")
2
Bed load transport for Habitat change Port projects Navigation Bridge scour /deposition River form studies Sand / gravel extraction Littoral transport Engineering works Environmental management No bed load measurements in NT Rivers

4
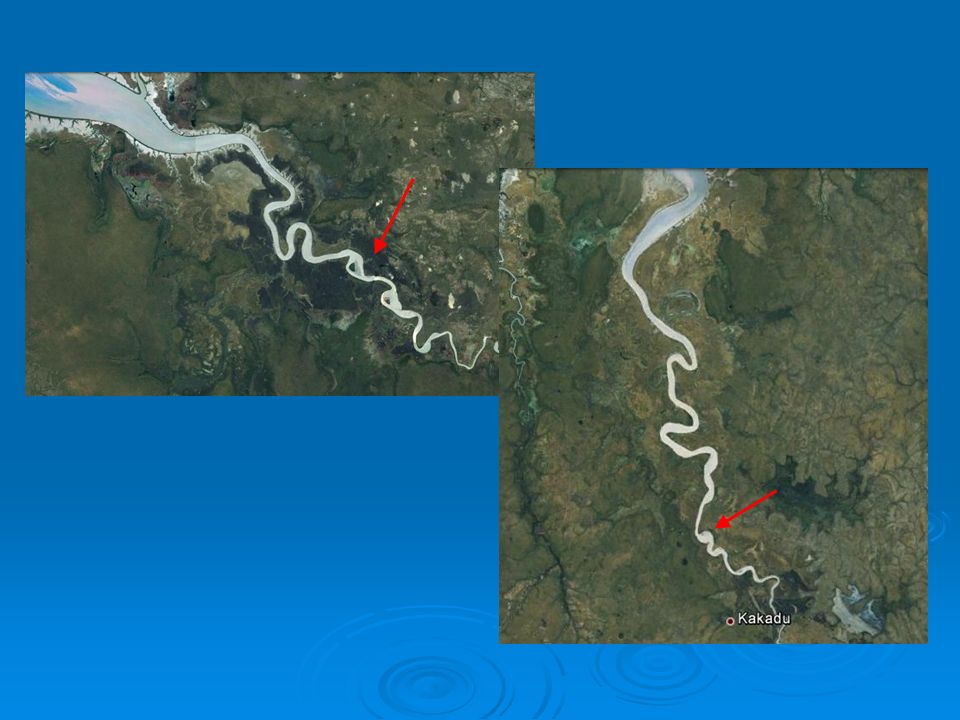
Daly River Anson Bay 300 km

6
Occur in different locations with respect to the mouth Need for boundary conditions for sediment modelling

7
Helley-Smith 8055 US BL84 US TR2

8
Water ping Bottom ping fixed or moving bed

9
Water velocity Bed load velocity * -1 ADCP assumes a reference plane of a fixed bed Bed load movement will result in a perceived movement upstream Multiply by -1 to give correct direction Bed load rate = bottom track distance / time

10
Bed load transport follows moving bed tests with some variations Explained in the manuals Moving beds are not a problem

12
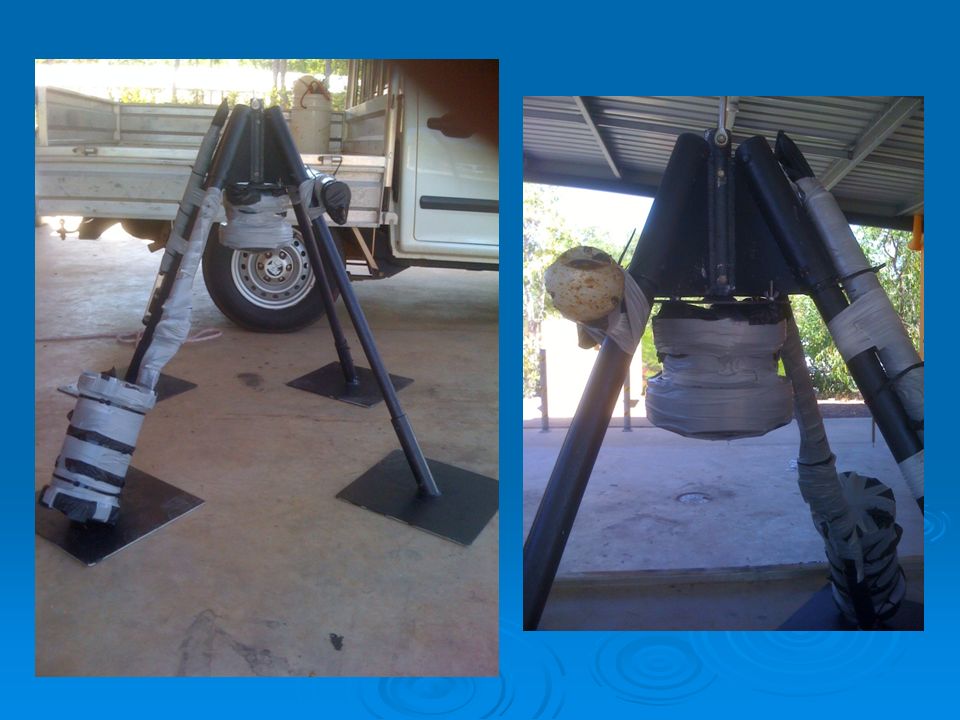
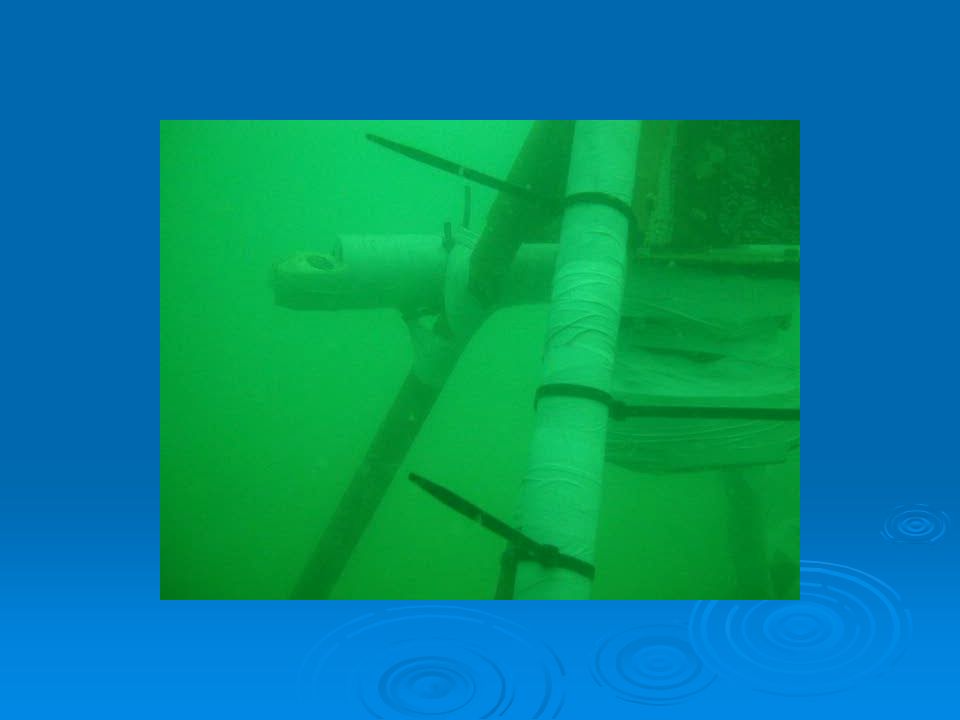
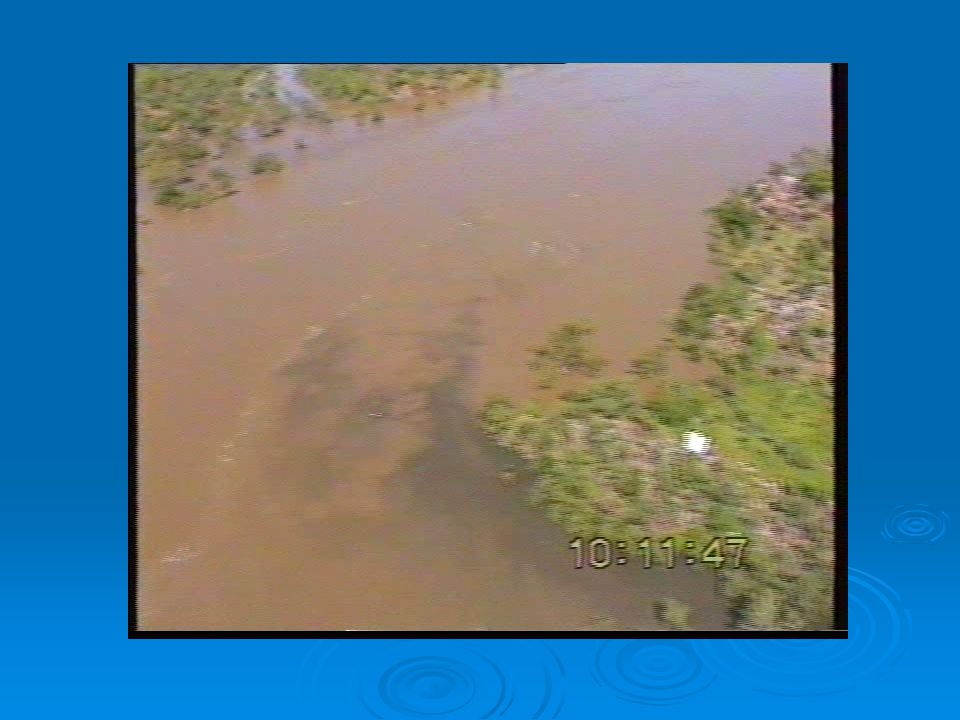
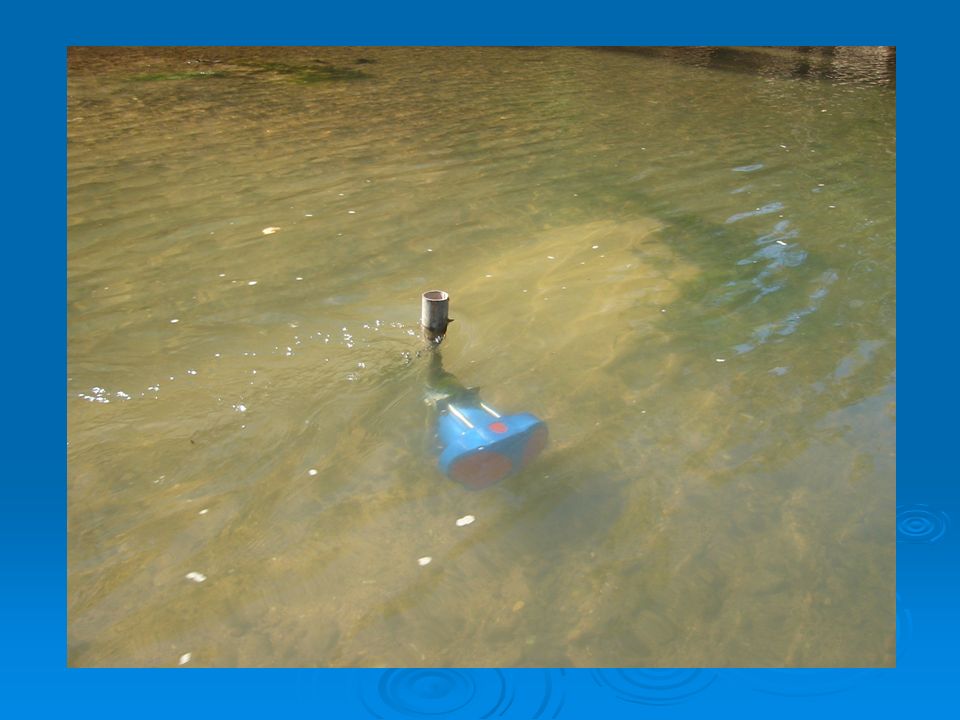
Frame deployed to measure the tides and the movement of the sediments along the sea bed

16
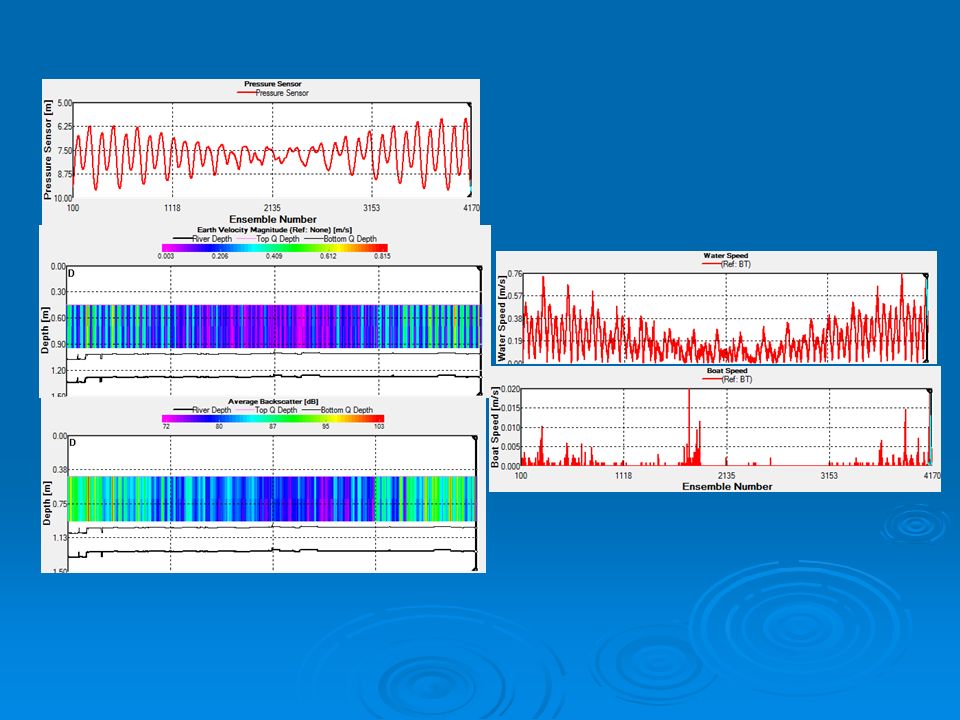
Tides, currents and bed load movement measured modelled

17
Measured versus modelled Based on the non-cohesive sediment model of Camenen and Larson (2006) Adapted by Wolanski and Williams
 Adapted by Wolanski and Williams")
19
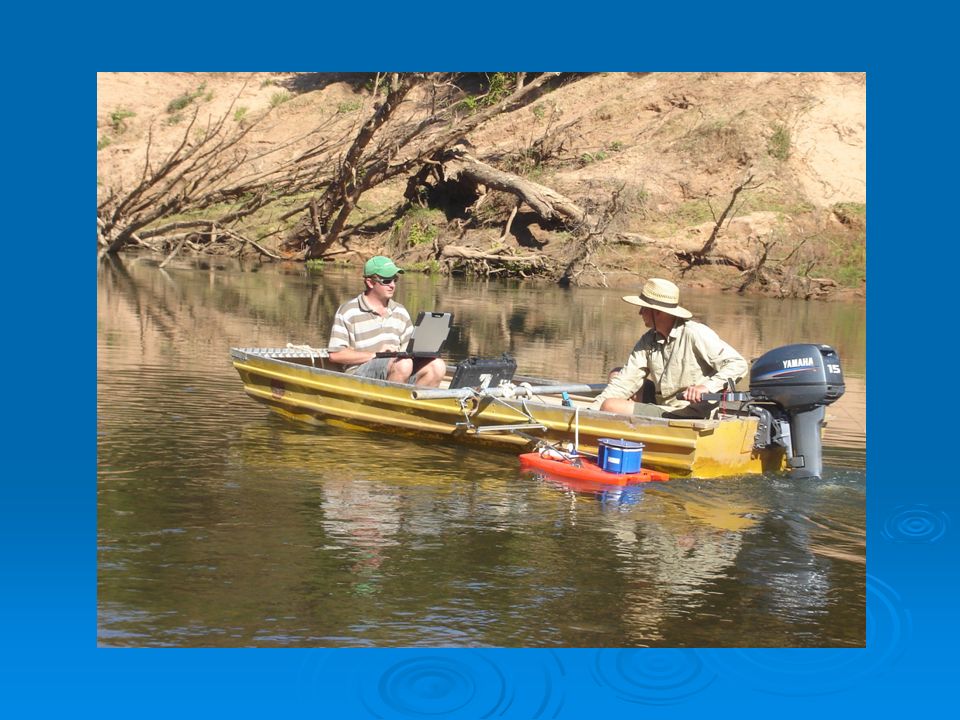
easy deployments from any vessel

20
using the loop technique using the parallel technique Want to keep it all simple No filtering and minimum post processing Results available after measurement

21
No dGPS Use bottom tracking No bedload – no misclose

22
Compass error Calibrate on site e.g. compass error 2 o CE = 100 * sin 2 = 3.5 metres Bed load error = CE / time

23
Bedload movement results in apparent upstream movement Distance made good Bed movement = dmg/time + - error CE / time

24
For ADCP loop gaugings the transects need to be surveyed at a slow a speed as is safely possible. This is because Bed load transport rates are generally of a low velocity (0.020 – 0.200 m/s and are not uniform The longer the sampling time reduces the Compass Error component e.g. as in the previous example if the compass error (CE) over the cross section was 3.5 metres then A 5 minute survey would have 3.5/300 = 0.012m/s A 10 minute syrvey would have 3.5/600 = 0.006m/s A 20 minute survey would have 3.5/1200 = 0.003m/s Compass errors cannot be eliminated altogether but their effect can be reduced to negligible through longer sampling
 over the cross section was 3.5 metres then A 5 minute survey would have 3.5/300 = 0.012m/s A 10 minute syrvey would have 3.5/600 = 0.006m/s A 20 minute survey would have 3.5/1200 = 0.003m/s Compass errors cannot be eliminated altogether but their effect can be reduced to negligible through longer sampling.")
25
Daly River Bedload transport study Pool habitats 10 km

26
Typical flood hydrograph

27
Bed movement Distance MG / Duration 0.018 m/s

28
Bed movement Distance MG / Duration 0.164 m/s

29
140 160 Bed load rate 76.55 / 1110.35 0.069 m/s * ( 0.020 m * 90 m) 0.124 m 3 /s
 m 3 /s")
30
Flow mean velAreawidth mean depth bed movement (m/s)qbqb bed load rate from equations ADCP Meyer PeterEinstein 42 Einstein 50 Ackers White 13971.2691043.886.912.00.0690.00100.00310.00540.00300.0020 17680.9471832.8204.19.00.0180.00030.00190.00050.00210.0012 15541.2241192.696.312.40.0790.00120.00320.00060.00310.0021 15871.3971074.379.713.50.0790.00120.00370.00060.00340.0023 18660.9881847.8204.39.00.0220.00030.00190.00480.00210.0012 24781.1422117.5228.29.30.0280.00040.00210.00050.00220.0013 24121.0872157.2245.58.80.0310.00050.00190.00050.00200.0012 25531.1502146.2240.98.90.0400.00060.00190.00050.00210.0012 17561.2591362.3121.511.20.0300.00040.00280.00050.00270.0018 21291.4681355.8106.212.80.1030.00150.00340.00060.00320.0022 27201.2071967.5141.613.90.1640.00260.00390.00060.00350.0025 40981.4522704.5295.89.10.0630.00100.00200.00050.00210.0013 40511.4452663.5289.29.20.0760.00110.00200.00050.00210.0013 r2r2 0.600.020.590.60
qbqb bed load rate from equations ADCP Meyer PeterEinstein 42 Einstein 50 Ackers White r2r")
31
Meyer Peter 0.65 Einstein 0.86 Ackers White 1.04 Slope Unit Bed load transport ? is all the sediment layer moving D 50 = 2 mm

32
GPS required (LengthBT – LengthVTG) / time = bed movement GPS VTG ADCP BT
 / time = bed movement GPS VTG ADCP BT")
33
gpsVTG adcpBT (BT – VTG) / Duration (330.56 – 268.25) / 473.31 0.131 m/s
 / Duration ( – ) / m/s")
35
Bed load versus mean velocity

36
Bed load versus shear velocity

37
Bed load versus kinetic energy (½ * ρ * Q * v 2 ) Wil be exploring turbulent kinetic energy
 Wil be exploring turbulent kinetic energy")
39
HADCP’s used to continuously measure flow via velocity index or numerical techniques

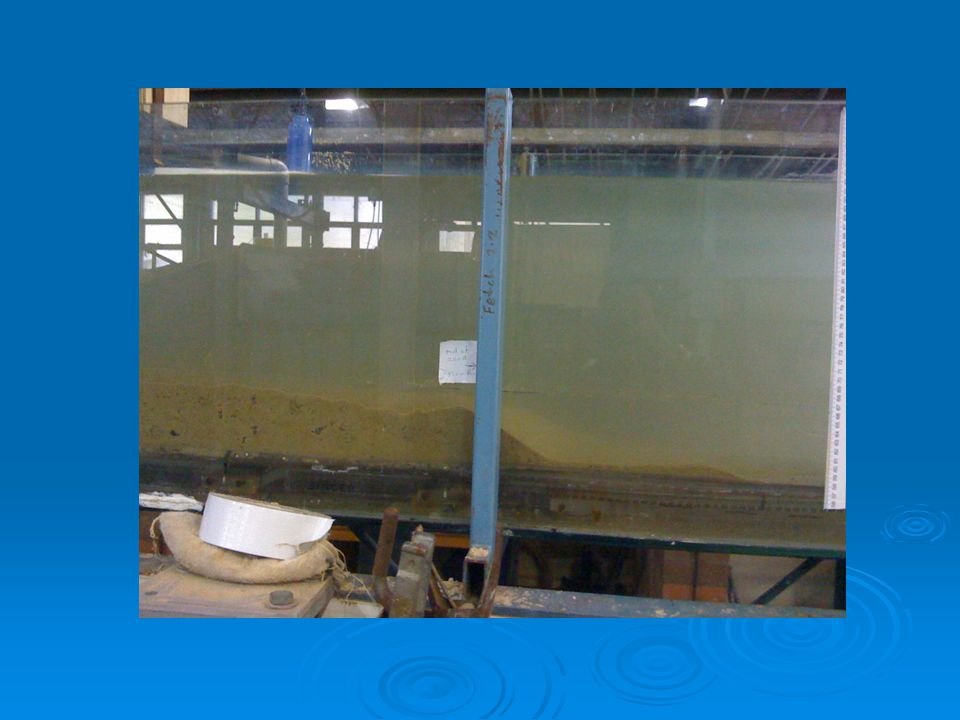
44
At lower flows sand is still rolling

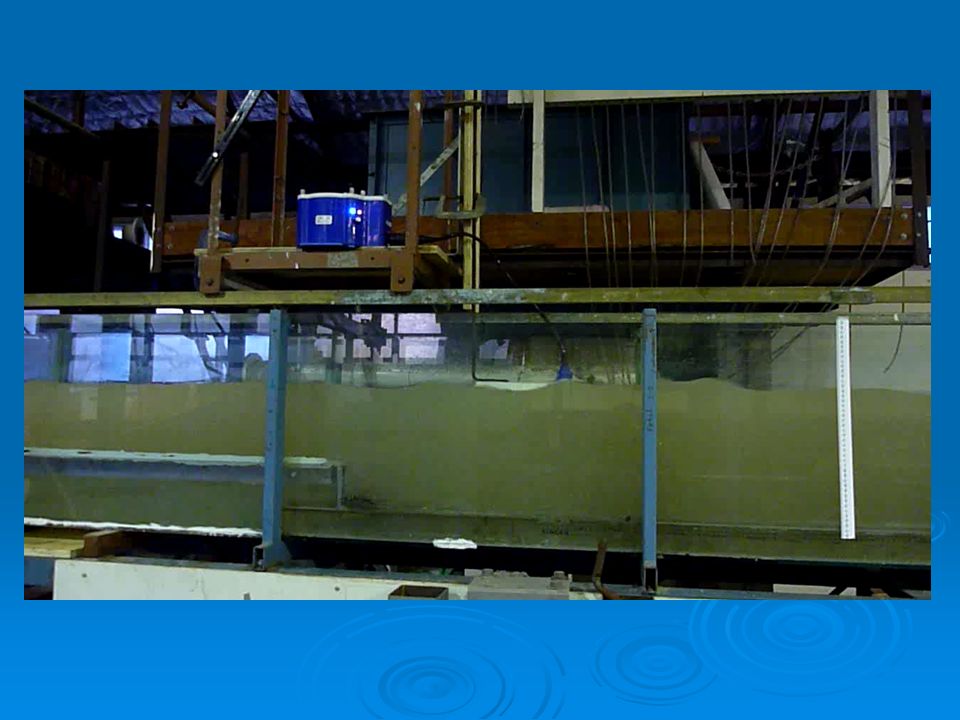
45
At low flow sand still moves and bedforms are made

49
Q = 36.1 m 3 /s A = 61.5 m 2 W = 64.8 m MV = 0.587 m/s d = 0.94

51
HADCP

52
Sand wave movement during recession flows If mean depth changes by +/- 0.1 metres then mean velocity magnitude will change by 0.15 m/s Sand wave movement is ~ 4 m/25 days = 0.16 m/day Over 8 month dry season Sand waves move ~ 40 metres

53
Bed load versus mean velocity

59
Next moving on to cohesive sediment interactions with non cohesive

60
Conclusions Bottom mounted frame good for some estuarine and offshore sites Able to gather long time series Could be combined with underwater logger and transducer to get sediment thickness Moving boat techniques non intrusive and can gather a lot of information over a reach economically (Q, V, backscatter, bed load rate). Can compute bed shear, Turbulent Kinetic Energy, Reynolds numbers, Froude numbers, Manning’s ‘n’. HADCP measure bed movement and migration of waves downstream StreamPro used for bathymetry in shallow stream to measure bed forms StreamPro used in flume to better understand sand movement

Similar presentations


, during 2004 was used as an example. Click to continue A demonstration.>")


 Hans Jacob Simonsen.>")


 Chapter 10: OPEN CHANNEL FLOWS>")


