Download presentation
Presentation is loading. Please wait.

1
Probing the Retina 1. The Retina Project - understand the language used by the eye to send information about the visual world to the brain 2. First Results 3. Future Activities and Directions 4. Summary Alan Litke UC Santa Cruz 28 July 2004

2
Collaborators UC Santa Cruz: A. Grillo, M. Grivich, S. Kachiguine, D. Petrusca, A. Sher AGH U. of Science and Technology, Krakow (I C design): W. Dabrowski, P. Grybos, P. Hottowy U. Glasgow (high density electrode array fabrication): W. Cunningham, D. Gunning, K. Mathieson, M. Rahman The Salk Institute (neurobiology): E. J. Chichilnisky, R. Kalmar
: W. Dabrowski, P. Grybos, P. Hottowy U. Glasgow (high density electrode array fabrication): W. Cunningham, D. Gunning, K. Mathieson, M. Rahman The Salk Institute (neurobiology): E. J. Chichilnisky, R. Kalmar.")
3
?

4
Goal: understand how the retina processes and encodes dynamic visual images Method: record the patterns of electrical activity generated by hundreds of retinal output neurons in response to a movie focused on the input neurons Technology: based on silicon microstrip detector techniques and expertise developed for high energy physics experiments – an example of the application of expertise in HEP instrumentation to neurobiology The Retina Project

5
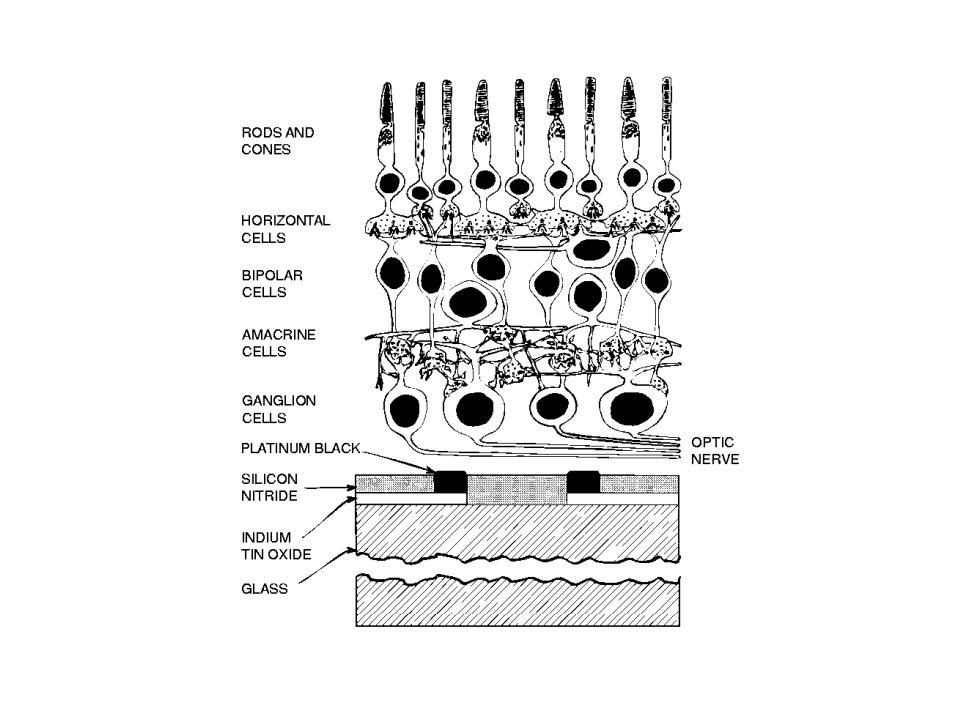
Experimental Technique (based on work by Meister, Pine and Baylor)
")
7
Species? Monkey: closest to human visual system (medical applications) large body of experimental work on monkey vision (neurophysiology, behavior) But rare and precious tissue (guinea pig retina is also being studied) Scale? Record from a population of neurons approaching a scale of interest for neural computation order-of-magnitude improvement in state-of-the-art Record simultaneously from hundreds to thousands of retinal ganglion cells in a single preparation
 large body of experimental work on monkey vision (neurophysiology, behavior) But rare and precious tissue (guinea pig retina is also being studied) Scale. Record from a population of neurons approaching a scale of interest for neural computation order-of-magnitude improvement in state-of-the-art Record simultaneously from hundreds to thousands of retinal ganglion cells in a single preparation.")
8
Electrode Array Geometries 1 electrode: “traditional” 61 electrodes: previous state-of-the-art 1 mm 512 electrodes (32x16): current system 519 electrodes: fabrication underway at U. Glasgow 519 electrodes: fabrication underway at U. Glasgow (see next talk by D. Gunning) 2053 electrodes: futuristic 0.17 mm 2 60 µm 1.7 mm 2 60 µm 7.1 mm 2 60 µm 1.7 mm 2 60 µm 0.43 mm 2 30 µm Input region for monkey MT neuron (Electrode diameters = 5 µm; area and electrode spacing given below.)
 2053 electrodes: futuristic 0.17 mm 2 60 µm 1.7 mm 2 60 µm 7.1 mm 2 60 µm 1.7 mm 2 60 µm 0.43 mm 2 30 µm Input region for monkey MT neuron (Electrode diameters = 5 µm; area and electrode spacing given below.).")
9
Previous state-of-the-art M. Meister, J. Pine, D. A. Baylor, J. Neuroscience Meth. 51 (1994) 95. 61 electrodes, 60 µm electrode spacing, conventional electronics, “zebra” interconnect, tens of retinal ganglion cells simultaneously detected
 electrodes, 60 µm electrode spacing, conventional electronics, zebra interconnect, tens of retinal ganglion cells simultaneously detected.")
10
Parallel efforts in ALEPH, DELPHI, OPAL at LEP and CDF at the Tevatron Collider Silicon Strip Vertex Detector: MARK II experiment at SLAC Linear Collider (512 channels/module; 18K channels total) Microplex readout chip 128 channels, 47.5 µm pitch (Walker, Parker, Hyams) 9 cm
 Microplex readout chip 128 channels, 47.5 µm pitch (Walker, Parker, Hyams) 9 cm")
11
“Neuroboard” Block Diagram 12 bit resolution; Sampling rate = 20 kHz/channel;

12
Platchip 64 channels; 120 μm pitch; die size = 3.3 x 7.8 mm 2 AC coupling: 150 pF Platinization current: 0-1.2 μA (controlled by 5 bit DAC) Stimulation current: 0-150 μA (controlled by external analog signal with gain set by 5 bit DAC) Connection to electrode 64 channels stimulate Output (to Neurochip) platinize -2.5 VCommon external stimulation signal Design by W. Dabrowski et al., Krakow

13
64 channels; 120 μm pitch; die size = 4.8 x 7.8 mm 2 bandpass filter: 80 - 2000 Hz (typical); equivalent rms input noise ~5 μV (~7 μV for complete system with saline; signal amplitude range = 50 – 800 μV) sampling rate/channel = 20 kHz (typical); multiplexer freq. = 1.3 MHz (typical) Neurochip input S&H Analog multiplexer output 64 channels preamp bandpass filter bandpass filter output amp reference Design by W. Dabrowski et al., Krakow
 Neurochip input S&H Analog multiplexer output 64 channels preamp bandpass filter bandpass filter output amp reference Design by W. Dabrowski et al., Krakow.")
14
60 microns Section of 512-electrode Array (32x16) Electrode diameter = 5 m
 Electrode diameter = 5 m")
15
Section of 512-electrode “Neuroboard” chamber 64-channel Neurochip 64-channel Platchip Fan-in 512-electrode array to reference electrode

16
512-electrode array 64-channel Neurochip chamber 512-electrode “Neuroboard” 64-channel Platchip Fan-in line driver

19
Salamander retina on 512-electrode array Slice of hippocampal tissue on 512-electrode array

20
2 separate cells recorded on same electrode Same cell recorded on 2 electrodes Spikes on electrodes spikes from identified neurons

21
Neuron Identification (signals on electrodes spikes from identified neurons) Single electrode (electrode #1) Spike Amplitude histogram Spike width vs. amplitude Multiple electrodes 1.3 ms Electrode #1234567

22
Principal Components Analysis; multidimensional clustering 4 identified neurons Average signal on each of the 7 electrodes for each of the 4 identified neurons Electrode # Neuron # 1 1 2 3 4 54326 7 Multidimensional clustering Neuron ID/analysis software: D. Petrusca, Santa Cruz

23
measure the response properties of identified neurons white noise analysis: use time sequence of random checkerboard images measure the “spike-triggered average” (sta) response for each neuron
 response for each neuron")
24
Spike-triggered Average

25
-8 ms-17 ms -25 ms -42 ms-50 ms-58 ms -67 ms-75 ms -83 ms-92 ms 0 ms -33 ms ON Cell time wrt spike 900 m Monkey Retinal Ganglion Cell

26
Spike-triggered average image at time of maximum absolute intensity 900 m Time before spike (ms) sta - mean intensity Spike rate (spikes/s) filter image signal
 sta - mean intensity Spike rate (spikes/s) filter image signal")
27
Monkey Retinal Ganglion Cell OFF Cell time wrt spike 900 m 0 ms -33 ms -8 ms-17 ms -25 ms -42 ms-50 ms-58 ms -67 ms-75 ms-83 ms -92 ms

28
Spike-triggered average image at time of maximum absolute intensity 900 m time before spike (ms) sta - mean intensity filter image signal Spike rate (spikes/s)
 sta - mean intensity filter image signal Spike rate (spikes/s)")
29
Some first (preliminary) results with monkey retina Light-sensitive regions (“receptive fields”) for 338 identified neurons 3.2 mm 1.6 mm
 results with monkey retina Light-sensitive regions ( receptive fields ) for 338 identified neurons 3.2 mm 1.6 mm")
30
Spatial/temporal response properties of individual neurons (“spike-triggered average”) 800 m 500 m (8.3 ms/frame) On-large On-small Off-large Off-small Blue-on
 800 m 500 m (8.3 ms/frame) On-large On-small Off-large Off-small Blue-on")
31
3.2 mm 1.6 mm On- large On- small Blue-ON Off- small Off- large

32
Five identified monkey RGC classes (already well- known), but this is just the tip of the iceberg. From anatomical studies, it is estimated that there are at least 22 distinct types of monkey RGCs. Example: 13 cell types that project to the LGN (5 known + 8 new) (Dacey et al., Neuron 37 (2003) 15)
 (Dacey et al., Neuron 37 (2003) 15).")
33
Guinea Pig Retinal Ganglion Cells: OFF cells RF mosaic for 311 OFF cells Direction selectivity for drifting sinusoidal gratings RF mosaics for clusters 1-4 200 m 12 34

34
Neural activity recorded with 512-electrode system as image of vertical moving bar is focused on a section of guinea pig retina Electrode spike-rate Spike-rate for On-off DS neurons Spike-rate for On-off DS neurons 2 mm (Animation repeats after 2 sweeps)
")
35
Guinea Pig Retinal Ganglion Cells: ON cells RF mosaics for clusters 1-3 1 2 3 X Y Direction selectivity for drifting sinusoidal gratings RF mosaic for 169 ON cells 200 m 12 3

36
Mosaics Timecourses Receptive Fields Transient Sustained ON OFF Non-DS Guinea Pig Retinal Ganglion Cells: Medium Sized 400 m 100 ms

37
Non-DS Guinea Pig Retinal Ganglion Cells: OFF-Transient Mosaics Timecourses Receptive Fields MediumSmallLarge 400 m 100 ms

38
2 ms 1000 V 44 44 44 44 Electrophysiological Imaging 1.6 m/s Superimposed images of 4 monkey RGCs

39
Future Activities and Directions Functional architecture/mosaic properties of monkey and guinea pig retina (with E. J. Chichilnisky, Salk Institute) Studies for Retinal Prosthesis (with E. J. Chichilnisky, Salk Institute) Retinal Development (with Marla Feller, UC San Diego) Cortical network dynamics in slices of brain tissue (with John Beggs, U. Indiana)
 Studies for Retinal Prosthesis (with E. J. Chichilnisky, Salk Institute) Retinal Development (with Marla Feller, UC San Diego) Cortical network dynamics in slices of brain tissue (with John Beggs, U. Indiana).")
40
Retinal Prosthesis in Blind Subject Implanted 4 x 4 electrode array; electrode diameter = 520 µm, electrode spacing = 720 µm Humayan et al., Vision Research 43 (2003) 2573.
 2573.")
41
Summary We have developed a multielectrode system for the large scale recording of retinal ganglion cell activity Experimental data has been obtained with live guinea pig and monkey retinas For the first time, it has become possible to study image processing and encoding by the retina in terms of the correlated activity of hundreds of neurons There are numerous classes of retinal ganglion cells, each of which appears to tile the visual field, and each of which appears to send a separate image to the brain Potential additional applications include retinal prosthesis, retinal development, slices of brain tissue, and networks of cultured neurons

Similar presentations