Download presentation
Presentation is loading. Please wait.

1
How to make money analyzing Banks January 6, 2004 NAIC Forum On Compuserve Presented by Joe Smith Associate Director, NIA Board Vice President, New Jersey Chapter NAIC

2
Quick Review of NAIC Principles Invest a small amount of money regularly Reinvest all dividends, interest and capital gains Purchase growth stocks Diversify portfolio by size and industry Hold for the long term

3
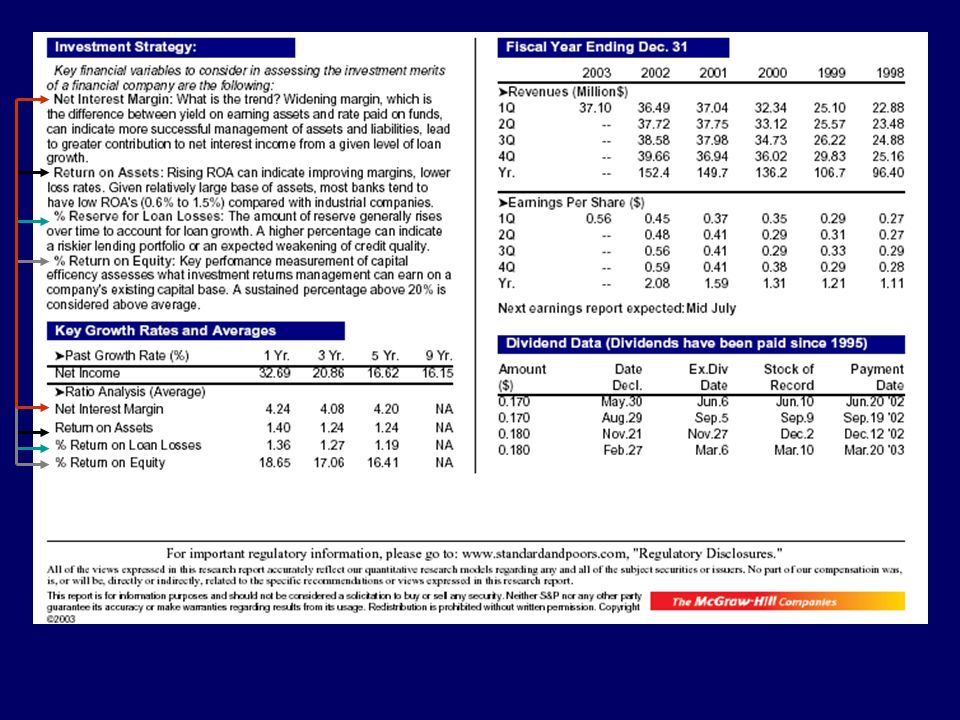
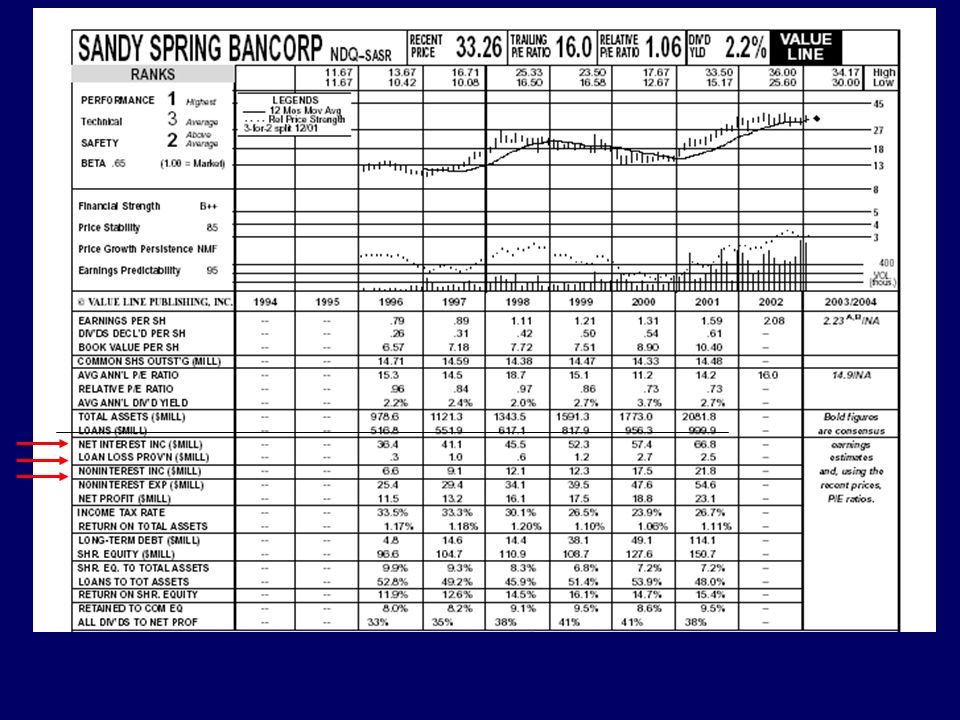
Let’s look at Banks Some Reporting Services provide financial information in different formats Relatively simple to analyze - just need to be aware of a few ratios to provide a better analysis “the other 20%” Revenue figures should be calculated using recommended NAIC formula

4
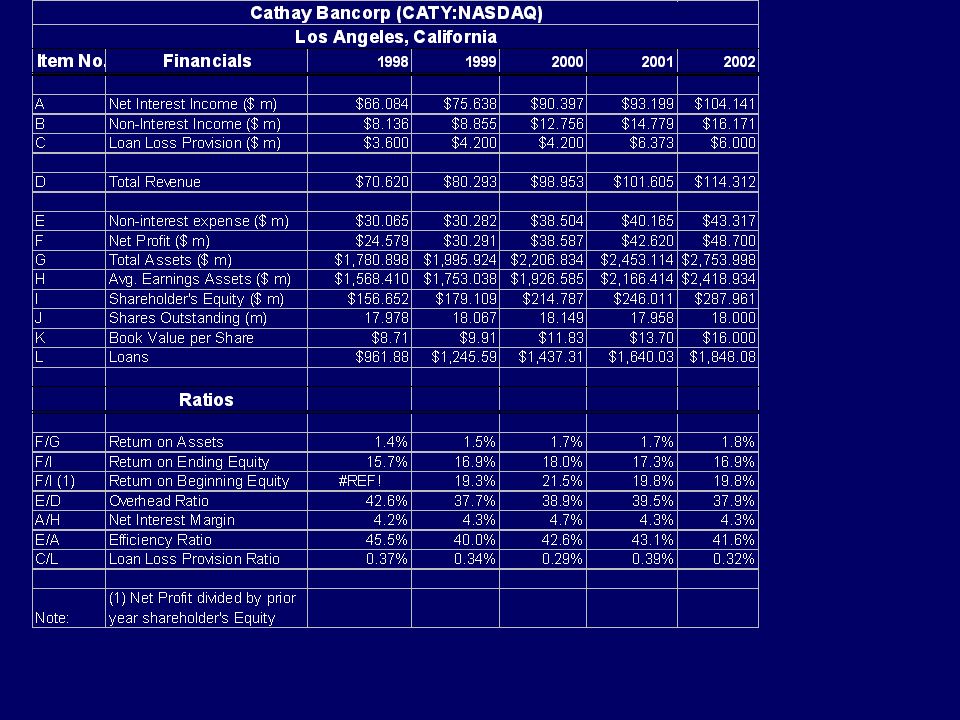
NAIC’s Revenue formula Net Interest Income plus Non-interest Income plus Tax Equivalent Adjustment (TEA) minus Loan Loss provision = Bank’s Revenue for SSG
 minus Loan Loss provision = Bank’s Revenue for SSG")
5
What is TEA? TEA adjusts tax free interest received by the bank to a pre-tax level

6
Differences in Reporting Some sources may report Gross Interest Income and Interest Expense ….. without mentioning Net Interest Income WHY???

7
Earnings per Share Same as manufacturing or other industries Only question is whether to use Basic or Diluted

8
Other items Most commonly used numbers are the same as usual EPS Book value Pre-tax profit Dividends Tax rates, etc.

17
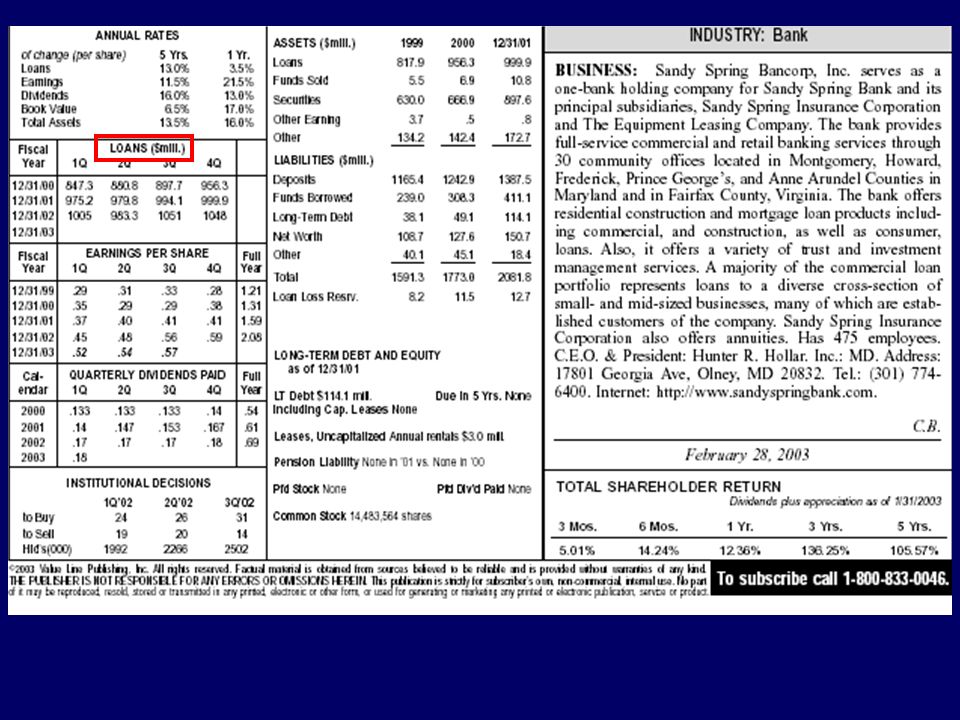
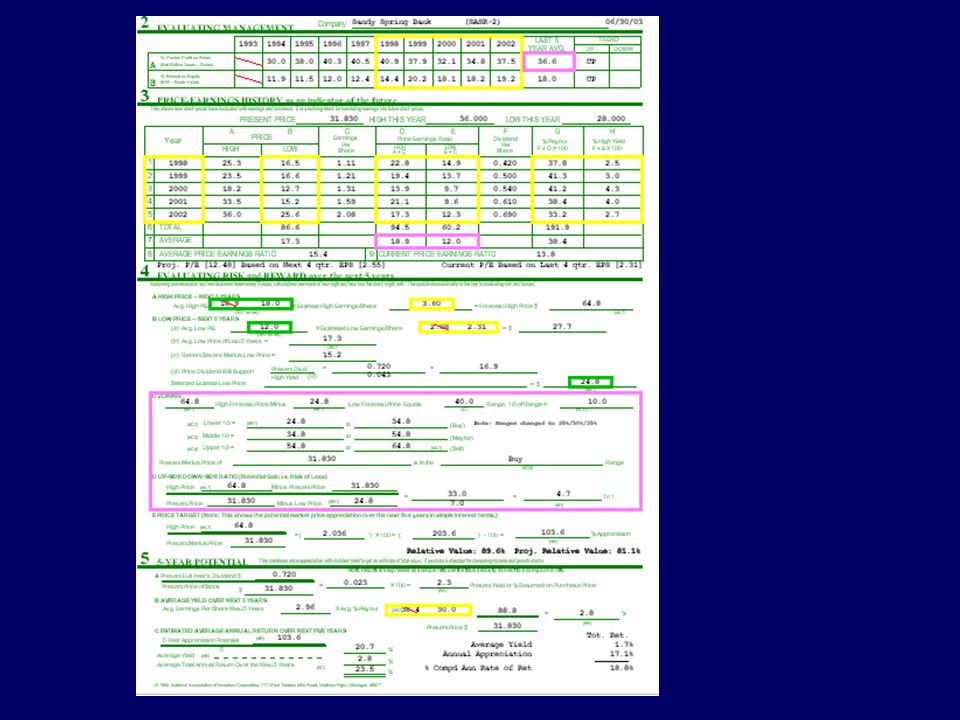
Worksheet to Calculate Quarterly or Annual Revenue Figures for Banks Name of Bank:------------------ As of Date:------------------ 1. Net Interest Income: ----------------------- 2. Tax Equivalent Adjustment------------------------ 3. Non-Interest Income:------------------------ 3a. Sub total (1 + 2 + 3):------------------------ 4. Loan Loss Provision:------------------------ 5. Total (= 3a minus 4): --------------------------- Sandy Spring Bancorp 3-31-2003 3-31-2002 %change $19.125 $18.575 2.96% 2.046 1.469 39.28% 7.775 6.798 14.37% $28.946 $26.657 7.84% 0 -1.185 -100.00% $28.946 $25.657 12.82%
: Loan Loss Provision: Total (= 3a minus 4): Sandy Spring Bancorp %change $ $ % % % $ $ % % $ $ %.")
20
I BV NI

22
Return on Average Assets (ROAA) = Net Income / Average Assets Return on Average Equity (ROAE) = Net Income / Average Equity Net Interest Income, on a fully taxable equivalent basis - if available, as a % of average earnings assets Efficiency Ratio = Non Interest Income / (Net Interest Income + Other Income) Loans / Deposits = Loans held for investment (before reserves) as a % of total Insured Deposits Performance
 = Net Income / Average Assets Return on Average Equity (ROAE) = Net Income / Average Equity Net Interest Income, on a fully taxable equivalent basis - if available, as a % of average earnings assets Efficiency Ratio = Non Interest Income / (Net Interest Income + Other Income) Loans / Deposits = Loans held for investment (before reserves) as a % of total Insured Deposits Performance")
23
Asset Quality Ratios NPA / Assets = Non-Performing Assets (Non-Performing Loans and Leases, Renegotiated Loans and Leases and Real Estate Owned) / Assets NCOs / Loans = Loans + Leases Charged Off, Net of Recoveries / Average Loans and Leases Reserves / Loans = Reserves for Loan Losses / Loans Before Reserves Reserves / NPAs = Loan Loss Reserves / Non-Performing Assets
 / Assets NCOs / Loans = Loans + Leases Charged Off, Net of Recoveries / Average Loans and Leases Reserves / Loans = Reserves for Loan Losses / Loans Before Reserves Reserves / NPAs = Loan Loss Reserves / Non-Performing Assets")
24
Capital Ratios Core Capitol / Risk-Adjusted Assets (Tier 1) = Tier 1 Capitol / Total Risk Adjusted Assets Tangible Equity / Tangible Assets = Tangible Equity/ Tangible Assets Total Equity / Total Assets = GAAP Equity / GAAP Assets
 = Tier 1 Capitol / Total Risk Adjusted Assets Tangible Equity / Tangible Assets = Tangible Equity/ Tangible Assets Total Equity / Total Assets = GAAP Equity / GAAP Assets")
25
Market Ratios Price Earnings Ratio = Current Market Price / TTM Diluted Earnings per Share Price to Book Ratio = Current Market Price / Book Value Dividend Yield = Most Recent Annualized Dividend / Current Market Price

Similar presentations


 Goldman Sachs Financial Square Money Market Fund Administration Shares—Data as of 7.31.04 Portfolio Composition (%) Fund FactsCurrent.>")

>")


