Download presentation
Presentation is loading. Please wait.

1
Diagnostic Likelihood Ratio Presented by Juan Wang

2
Diagnostic tests 4: likelihood ratios Deeks JJDeeks JJ, Altman DG.Altman DG BMJ.BMJ. 2004 Jul 17;329(7458):168-9
:")
3
Likelihood ratio,similar to others diagnostic indexes, such sensitivity, specificity, predictive values and ROC curve, could be utilized to diagnose disease from normalities according to the results of clinical test or marker test. Compared to sensitivity and specificity, it predicts the risk of disease for a particular test result, whereas sensitivity and specificity assess how good the test is at diagnosis of disease. Compared to predictive values, both of them could be predict risk of disease, however, positive predictive value (PPV) and negative predictive value (NPV) are calculated dependenting on prevalence of the disease, and LR will not. Diagnostic Likelihood Ratio (DLR)
 and negative predictive value (NPV) are calculated dependenting on prevalence of the disease, and LR will not. Diagnostic Likelihood Ratio (DLR).")
4
DLR could quantify information in the marker or clinical test that pertinent to prediction of disease risk. Formally, it is the ratio of the probability of the specific test result in people who do have the disease to the probability in people who do not. Likelihood ratio valuethe association between the result and disease >10Strong evidence for presence of the disease 1-10The result is associated with the presence of the disease 1Equal 0.1-1The result is associated with absence of the disease <0.1Strong evidence for absence of the disease

5
The table shows the results of a study of the value of a history of smoking in diagnosing obstructive airway disease Positive likelihood ratio=TPR/FPR=28.4/1.4=20.3 Negative likelihood ratio=FNR/TNR=71.6/98.6=0.73 Smoking habitYes(n(%))No (n(%)) ≥4042(28.4)2 (1.4) <40106(71.6)142 (98.6)
)No (n(%)) ≥4042(28.4)2 (1.4) <40106(71.6)142 (98.6)")
6
Bayesian theorem: post-test odds =likelihood ratio x pre-test odds

7
Estimating the diagnostic likelihood ratio of a continuous marker WEN GU Biostatistics. 2011 Jan;12(1):87-101
:")
8
Develop new methods to estimate the DLR function based on a data set with dichotomous outcomes of a continuous marker test. Compare the DLR estimate of new methods and traditional methods by using simulation studies Purposes

9
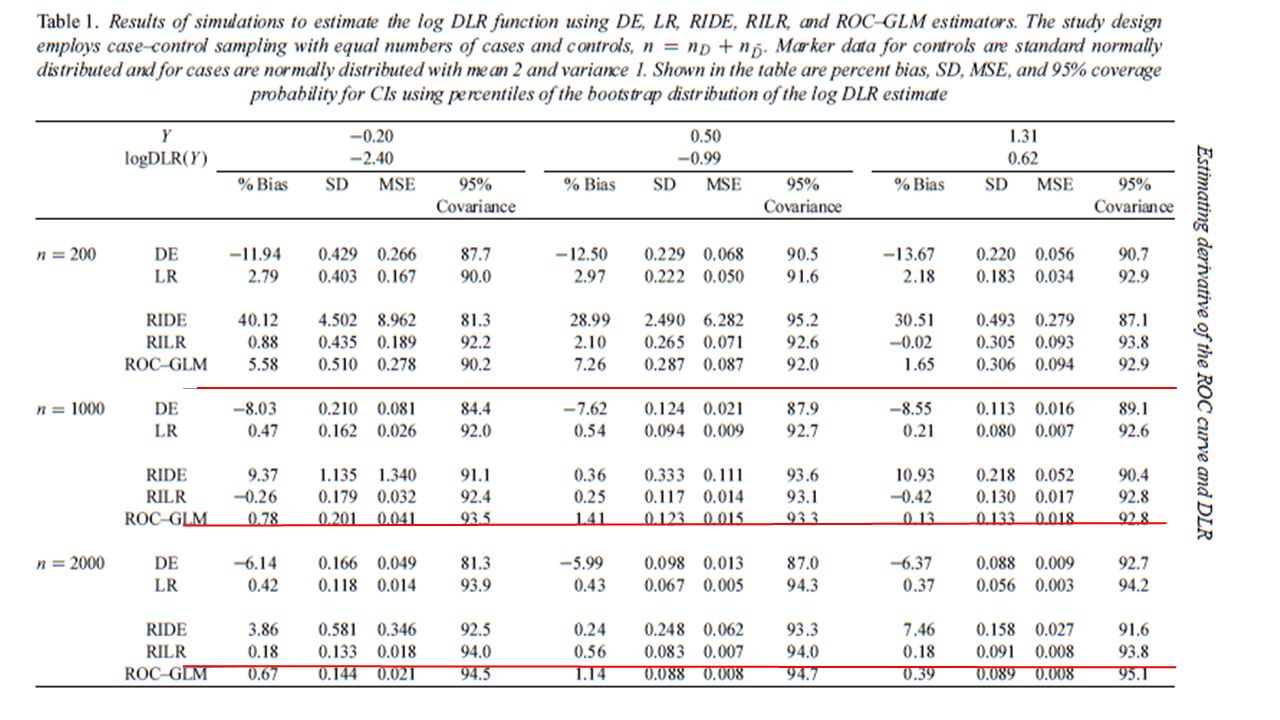
Five methods to estimate DLR were proposed in this paper 1. Density ratio (DE) 2. logistic regression (LR) 3. Rank-invariant DE (RIDE) 4. Rank-invariant LR (RILR) 5. ROC-GLM estimation (Receiver operating characteristic-generalized linear modeling) Above the five approaches, the rank invariant estimation was a new method developed in this paper, and furthermore combined it with other already used in previous publications, like DE, LR and ROC-GLM.
 2. logistic regression (LR) 3. Rank-invariant DE (RIDE) 4. Rank-invariant LR (RILR) 5. ROC-GLM estimation (Receiver operating characteristic-generalized linear modeling) Above the five approaches, the rank invariant estimation was a new method developed in this paper, and furthermore combined it with other already used in previous publications, like DE, LR and ROC-GLM..")
10
Diagnostic likelihood ratio DLR function quantifies the information Y pertinent to prediction in the sense. Y is a marker or a test. y is a measurement value of Y.

11
Density ratio Where, D is a binary outcome variable (diseased patients and healthy population), indicates the density function of diseased patients and indicates the density function of healthy population. (Here, nonparametric Gaussian kernel estimators were applied into and )
.")
12
Logistic regression

13
Rank-invariant estimation

14
Rank-invariant DE

15
Rank-invariant LR

16
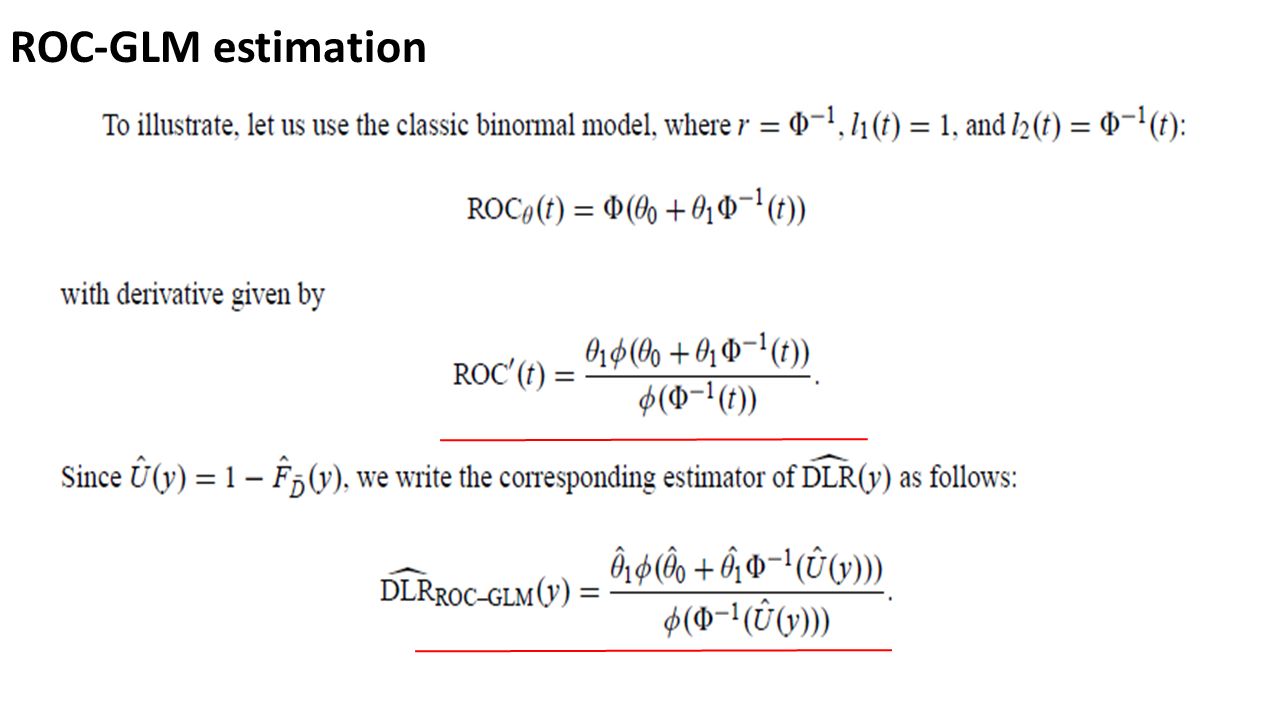
ROC-GLM estimation

Similar presentations


 When will you no longer accept this assumption?>")