Download presentation
Presentation is loading. Please wait.

1
CULTURE AND EQUITY WAKULLA COUNTY HIGH SCHOOL EDA 5503 Priscilla Tucker March 4, 2016

2
WAKULLA HIGH SCHOOL Our Mission: The mission of Wakulla High School is to provide an educational program in a safe environment that contributes to the development of each student emotionally, academically, and physically in order for him or her to successfully function in our continually changing, diverse society. Established in 1967 Principal Mike Barwick Rural school district Only 4 year public high school in the district Located south of Tallahssee Fed by 2 middle schools

3
WAKULLA HIGH SCHOOL DEMOGRAPHICS TotalWhiteBlackHispanicMaleFemale Administrators (5)80%20%060 %40 % Teachers (73)92 %4 % 32%68% Non-Instructional Support Staff (12) 83 %17 %08%92% Total Number of Students WhiteBlackHispanicOther 139687%14%3%< 1 % other nationality ~ 4 % multi-racial Free/Reduced Lunch 38 %
80%20%060 %40 % Teachers (73)92 %4 % 32%68% Non-Instructional Support Staff (12) 83 %17 %08%92% Total Number of Students WhiteBlackHispanicOther %14%3%< 1 % other nationality ~ 4 % multi-racial Free/Reduced Lunch 38 %")
4
POPULATIONS/ MARGINALIZED GROUPS Exceptional Students Minority Socio-economically disadvantaged English Language Learners < 1 %

5
ACHIEVEMENT AND PERFORMANCE DATA FLORIDA STANDARDS ASSESSMENT 2015 Year Number of Students Tested Achievement Levels (Percent of Students) Percent Passing Level 3 and Above 12345 2015 38218 2527191056 Year Students Tested Achievement Levels (Percent of Students) Percent Passing Level 3 and Above 12345 2015 33212 293022860 Grade 9 FSA Grade 10 FSA
 Percent Passing Level 3 and Above Year Students Tested Achievement Levels (Percent of Students) Percent Passing Level 3 and Above Grade 9 FSA Grade 10 FSA")
6
ACHIEVEMENT AND PERFORMANCE DATA READING FCAT 2.0 BY SUB-GROUP All StudentsBlack/African American HispanicWhiteStudents with Disabilities Economically Disadvantaged Percent of Students within Subgroup Tested in 2014 98 10099 98 Percent of Subgroup Scoring Satisfactory 2014 624457643049 Percent of Subgroup Scoring Satisfactory 2013 604145622949 Percent of Subgroup Scoring Satisfactory 2012 594056603849 Percent of Subgroup Scoring Satisfactory 2011 603573633944

7
STUDY RESULTS RESPONDENTS PROFILE The Data: Culture and Equity Questionnaire

8
SCHOOL ORGANIZATIONAL RESULTS

10
Highlights from Teachers and Staff: Student Services/ Guidance Team Faculty Team Building Community Outreach Activities; Parent and Community Nights Plays, Award Ceremonies, Sports Wide Variety of Student Programs including GSA and Lamplighters Exceptional Services Program Adherence to the MTSS/RTI Program IMPACT Career and Technical Education Programs Support and Recognition of Cultural Variation

11
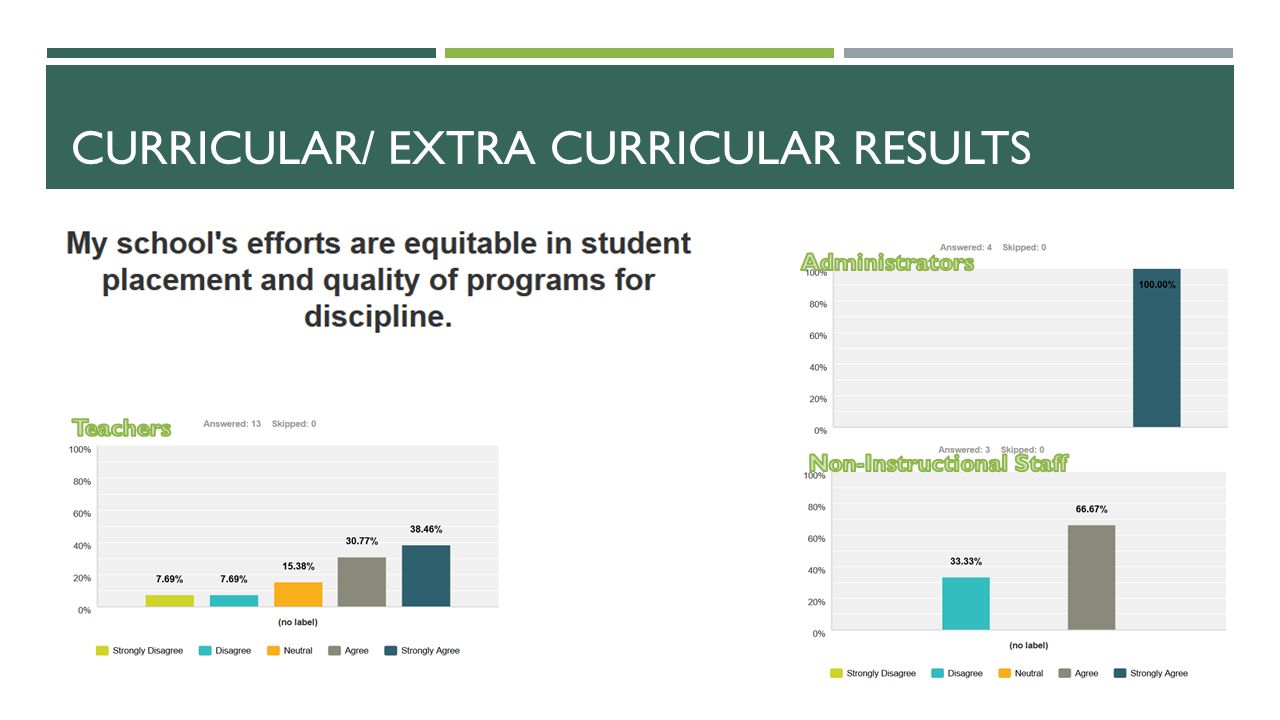
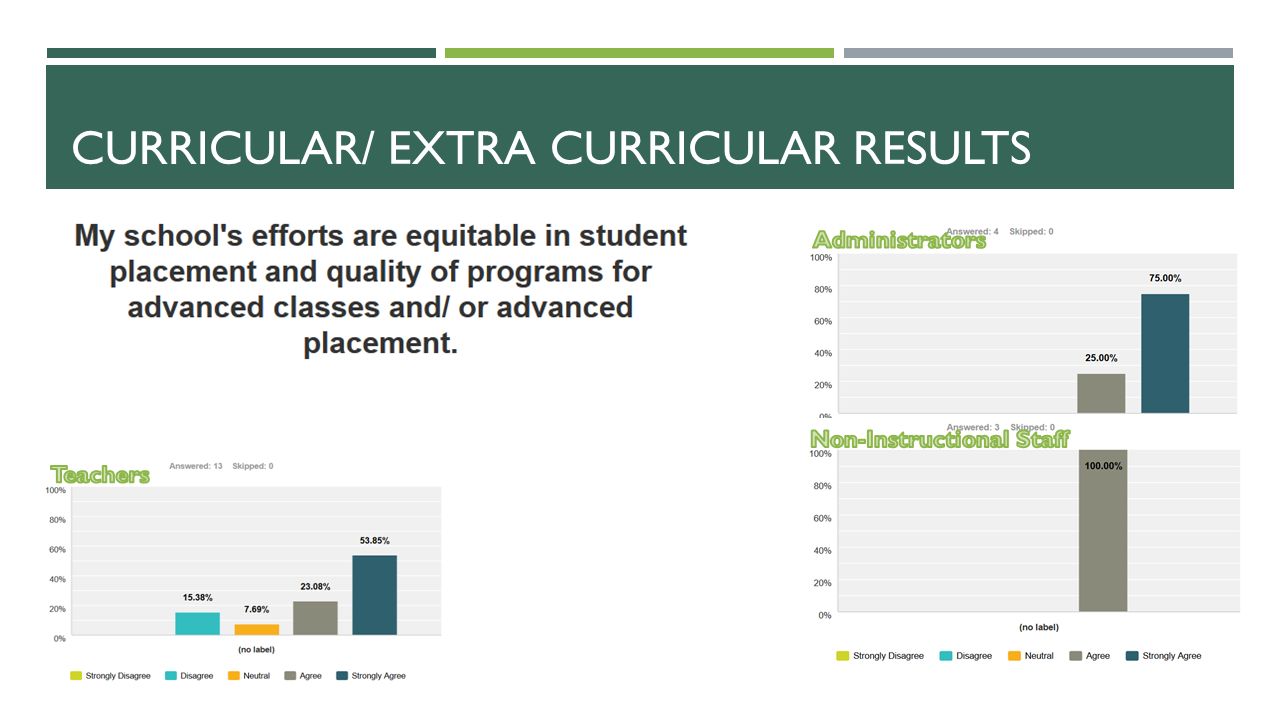
CURRICULAR/ EXTRA CURRICULAR RESULTS

15
CURRICULAR/ EXTRA CURRICULAR EQUITY: COMBINED RESULTS Highlights from Teachers and Staff: Robotics Program Medical and Engineering Academies Dual Enrollment and AP Course Offerings Two Dedicated Safety/Discipline AP’s Dedicated Behavioral Counselor Partnering with Second Chance School (Discipline) Wakulla Virtual Program Code of Conduct and Daily Practice Places Value on Student’s Right to Expression in Appropriate Manner
 Wakulla Virtual Program Code of Conduct and Daily Practice Places Value on Student’s Right to Expression in Appropriate Manner")
16
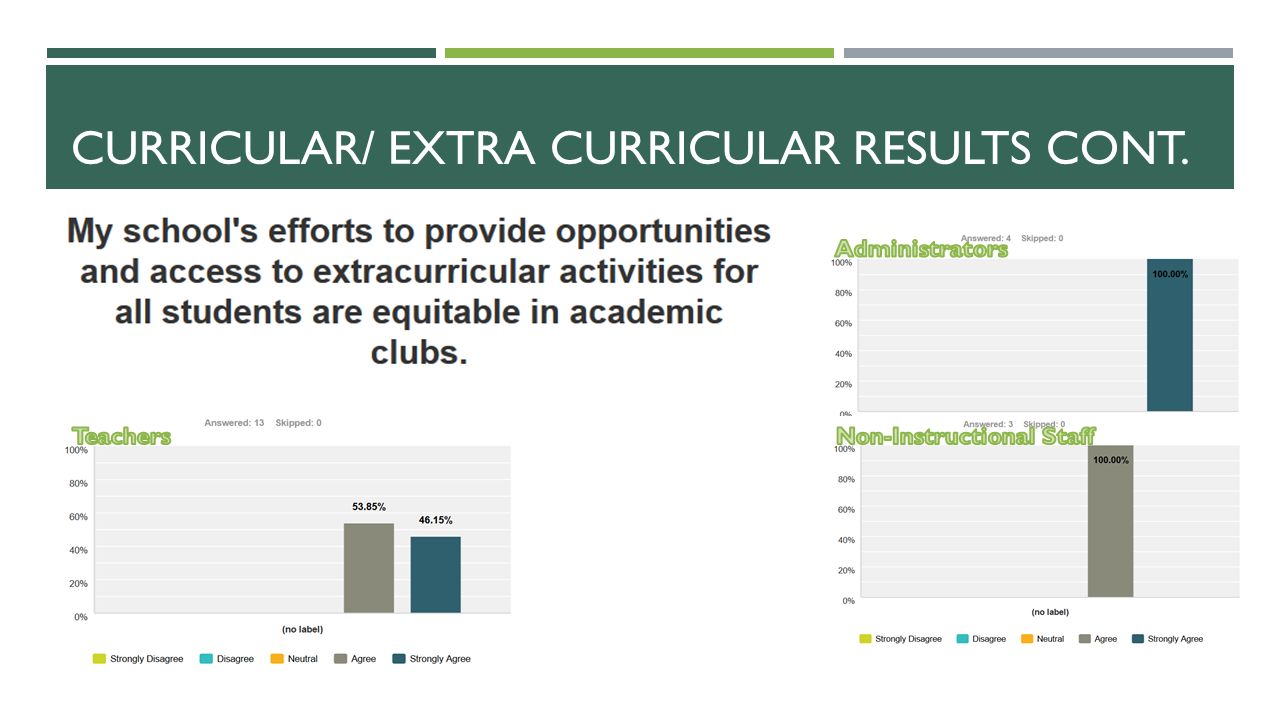
CURRICULAR/ EXTRA CURRICULAR RESULTS CONT.

19
CURRICULAR/ EXTRA CURRICULAR ACCESS: COMBINED RESULTS Highlights from Teachers and Staff: Equitable Availability to Girls and Boys Sports AVID- Focuses Attention on Academic Middle Academic Competition Drama Special Olympics; Student Volunteer Program Omega Lamplighters

20
PROFESSIONAL LEARNING RESULTS

21
PROFESSIONAL LEARNING COMBINED RESULTS Highlights from Teachers and Staff: Kaegan Training AVID Close and Careful Reading Strategies Holocaust Studies Embracing Wakulla’s Colorful Past Honoring of Black History Month Data Day: Disaggregation along Demographic Factors

22
PRINCIPAL FEEDBACK Develop clear expectations and enforce policies and procedures for staff and student conduct. Provide frequent and effective communication with stakeholders. Be a proactive force against bullying and discriminatory behavior. Provide teachers, especially young or new teachers, behavior awareness training; be the exemplar leader. Place knowledgeable and capable people in positions to assist in monitoring the learning environment. Show support for students and teachers across all programs by being present both during the school day and at showcase opportunities. Being firm in addressing bullying issues, demonstrating concern and support for students and faculty, and participating in a meaningful way in community involvement activities.

23
BEST PRACTICES: CURRENT STRATEGIES FOR ACCESS AND INCLUSION Physical Inclusion of our Exceptional Student Population occurred this year through the relocation of ESE classrooms to the center of the school rather than being located in the rear annex; Junior and Senior students are serving as Executive Interns through an inclusion program that seeks to bring regular education students into the classrooms of the more significantly disabled students to provide a more diverse interaction; Dual Enrollment students serve as classroom tutors on Tuesday and Thursday to assist struggling learners better access to regular classroom instruction; Grade Level Counselors meet with each student at least twice yearly to discuss plans and options in high school, post secondary school, and the workforce; Equal Access to vocational and academy courses; individualized scheduling and planning; Celebrating the talents and abilities of all students; Providing leadership opportunities.

24
BEST PRACTICES: RECOMMENDED STRATEGIES FOR INCREASING ACCESS AND INCLUSION Increased professional development and training of the faculty/staff for exceptional student education, inclusion, and classroom accommodations; Addition of true co-teaching classrooms to improve exceptional student inclusion and access to regular education curriculum; Increased access to career and technical programs resulting in workforce training linked to vocational programs of study and local workforce opportunities; ESOL training across all subject areas; Additional training opportunities for Kaegan, AVID, STEM, and differentiated instruction; Cultural diversity training opportunities.

25
RESOURCES Parrett, W. and Budge, K. (2012). Turning High Poverty Schools in High Performance Schools Wakulla County Board of Commissioners [website]. (2013). Population and Demographics. Retrieved from http://www.mywakulla.com/visitors/about_wakulla/population_and_demographics.php http://www.mywakulla.com/visitors/about_wakulla/population_and_demographics.php Suburban Stats. (2016). Current Wakulla County, Florida Population, Demographics and stats in 2016, 2015. Retrieved from https://suburbanstats.org/population/florida/how-many-people-live-in-wakulla-countyhttps://suburbanstats.org/population/florida/how-many-people-live-in-wakulla-county
. Population and Demographics. Retrieved from Suburban Stats. (2016). Current Wakulla County, Florida Population, Demographics and stats in 2016, Retrieved from")
Similar presentations