Download presentation
Presentation is loading. Please wait.

1
Health analysis at ONS Jamie Jenkins @statsjamie

2
Demographic context Sustained and continuing population growth The ageing population – “baby boomers” leaving working age population combined with increasing life expectancy Life expectancy v healthy life expectancy Inequality in life expectancy – geographical, socioeconomic class, deprivation, gender Impact of migration on OADR

3
The UK population in 2014 Mid-year population estimate was 64.6 million Population aged 15 and under = 18.8% Population aged 16 to 64 = 63.5% Population aged 65+ = 17.6% Population aged 66+ = 16.5% Population aged 67+ = 15.4% Old-age dependency ratio = 310 per 1000 3

4
Note: These figures take into account the change in State Pension Age under existing legislation. -20 0 40 60 80 100 120 140 160 All3&45 to 1112 to 1516 to 1718 to 21Working ageSPA85+ 20202039 UK Population to grow: short term falls in some age groups 4 -9% 4% -1% 9% -6% -3% 16% 15% 1% 9% 18% 10% 7% 11% 33% 137% Percentage difference from 2014

5
UK Population, 2014 and 2039

6
Age distribution, 2014 and 2039

7
The ageing population 20142039 Population (millions) Proportion (%) Population (millions) Proportion (%) Population aged 65+11.417.618.124.3 Population aged 85+1.52.33.64.8
 Proportion (%) Population (millions) Proportion (%) Population aged Population aged")
8
Old age dependency ratio

9
OADR across EU, 2014

10
Life expectancy at birth, principal projection, 1981-2039

11
Age-standardised mortality rates by major cause, 1911-2011

12
Cohort expectation of life at birth, historic and projected mortality rates, 1850-2050, E+W

13
Cohort expectation of life at age 65, historic and projected mortality rates, 1850-2050, E+W

14
Life Expectancy at birth by socioeconomic class, 2007-11 * Statistically significantly higher than E&W † Statistically significantly lower than E&W

15
Life Expectancy at birth by socioeconomic class

16
Life expectancy at age 65 by socioeconomic class, 2007-11 * Statistically significantly higher than E&W † Statistically significantly lower than E&W

17
Local area life expectancy at birth (2012-14) England MEN Ken. & Chelsea 83.3 Blackpool 74.7 WOMEN Chiltern 86.7 Middlesbrough79.8 Wales MEN Monmouthshire 80.7 Blaenau Gwent 76.2 WOMEN Ceredigion84.1 Blaenau Gwent80.3

18
Local area life expectancy at age 65 (2012-14) England MEN Ken. & Chelsea 21.6 Manchester 15.9 WOMEN Camden 24.6 Manchester 18.8 Wales MEN Ceredigion 19.8 Blaenau Gwent 16.7 WOMEN Ceredigion 22.6 Blaenau Gwent 18.9

19
Life Expectancy by area deprivation

20
Healthy Life Expectancy by area deprivation

21
Life expectancy and healthy life expectancy (at birth), 2009-11
,")
22
Life expectancy and healthy life expectancy (at age 65), 2009-11
,")
23
Trend in Healthy Life Expectancy in UK, 2000-2011

24
Gap between authorities Males17.8 years Females15.8 years HLE > state pension age (65) Males in a quarter of authorities females in a third of authorities Authorities with SS higher HLE Males42 Females42 Authorities with SS lower HLE Males57 Females54
 Males in a quarter of authorities females in a third of authorities Authorities with SS higher HLE Males42 Females42 Authorities with SS lower HLE Males57 Females54")
25
Healthy life expectancy at birth, 2011-13 MALES FEMALES

26
Inequality in HLE, 2009-2013

27
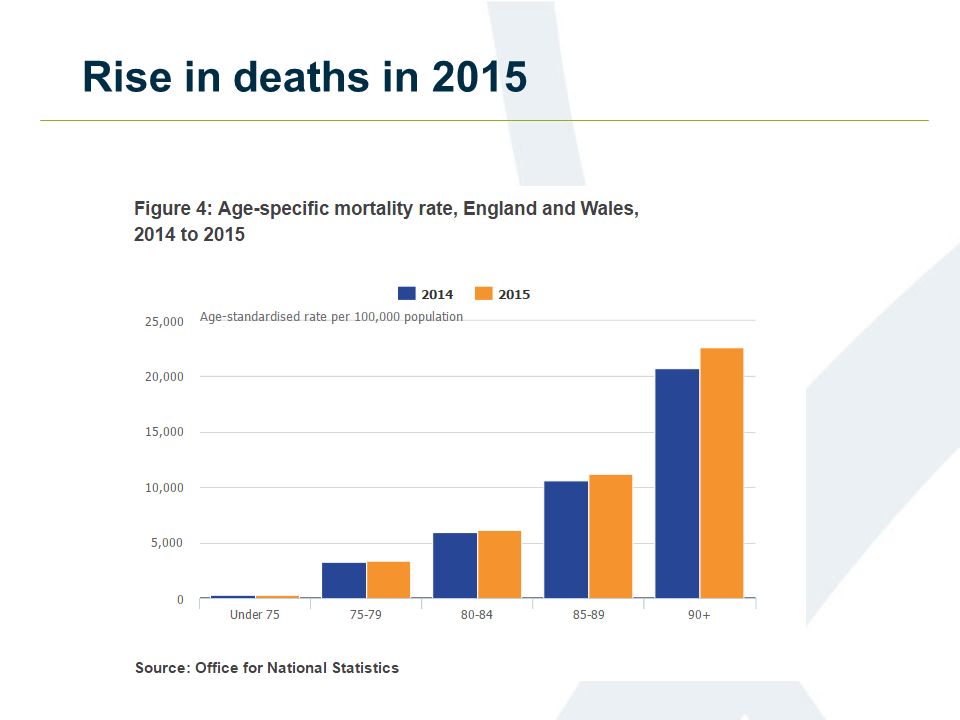
Rise in deaths in 2015

30
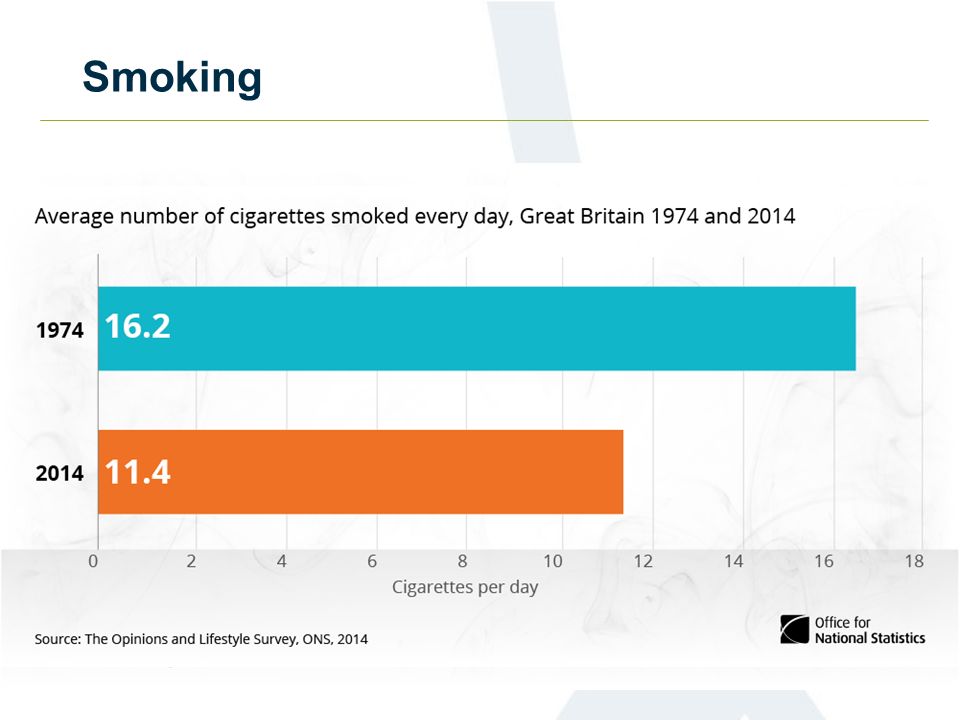
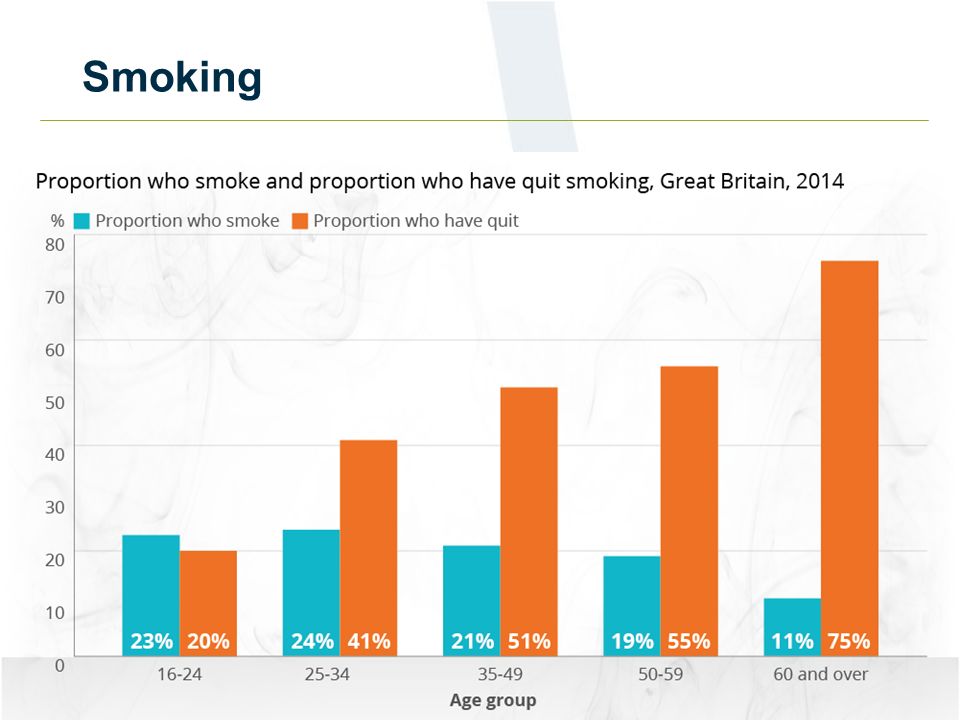
Smoking

34
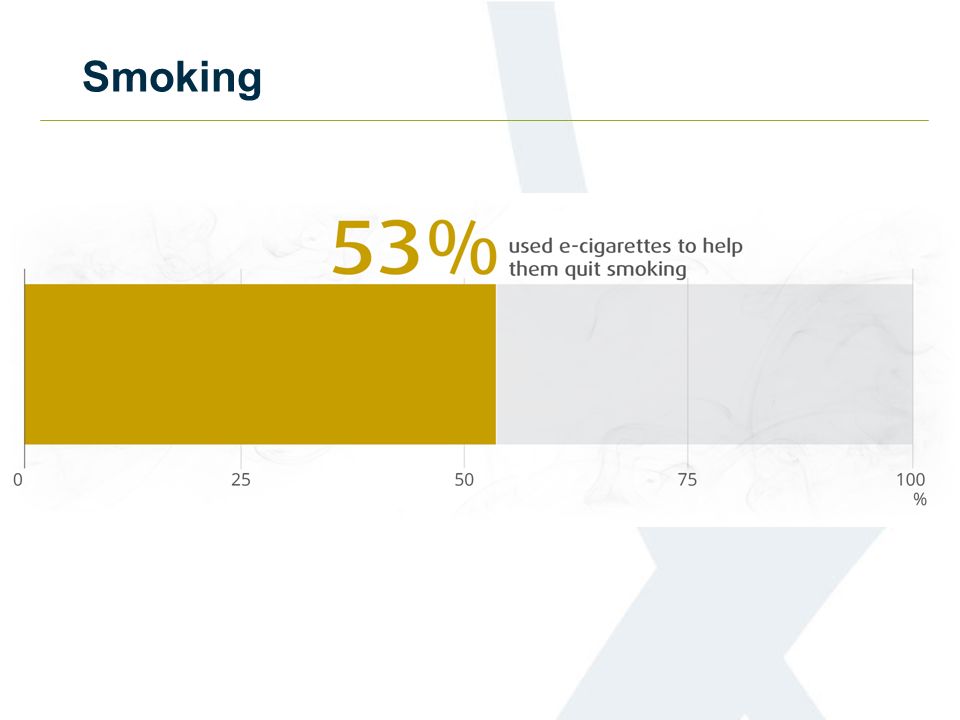
Smoking & e-cigs

35
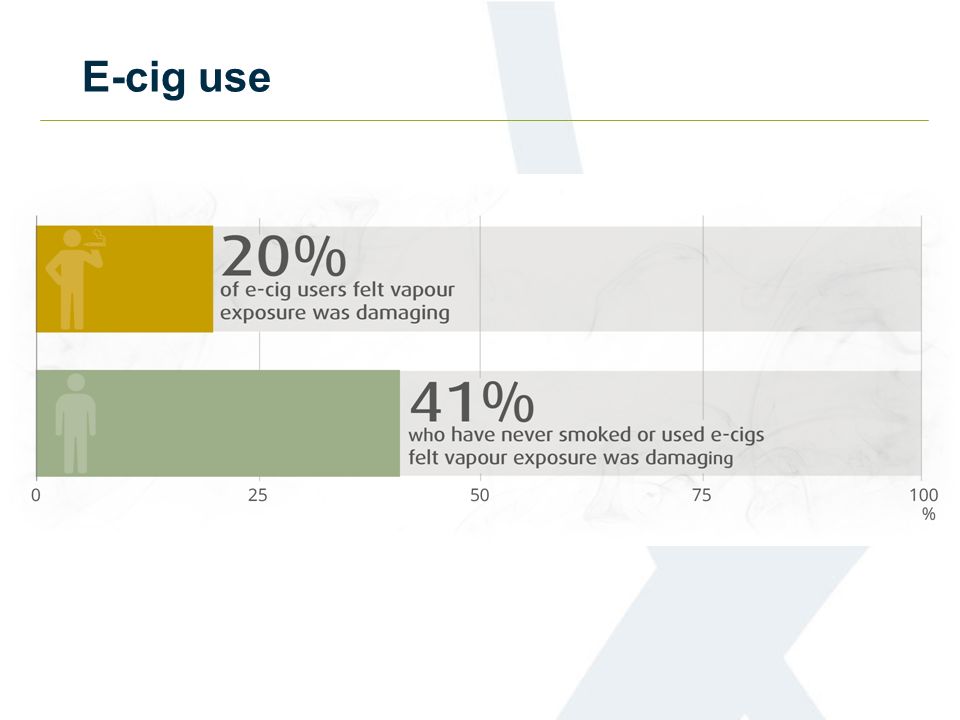
E-cig use

37
Drug related deaths

38
Contact details Jamie.jenkins@ons.gov.uk @statsjamie

Similar presentations


 Mr Elliott SSOT.>")


 and Scotland (SC041666) Cancer Worldwide September 2011.>")


