Download presentation
Presentation is loading. Please wait.

1
The Creative Industries Economic Estimates An Overview Dr Niall Goulding

2
Overview The Government’s official statistics on the economic impact of the Creative Industries. Gross value added Occupations Exports of services

3
First some definitions… Gross value added (GVA) is a measure of production GVA + taxes on products - subsidies on products = GDP Occupations are first and second jobs, either full or part time, including self employed
 is a measure of production GVA + taxes on products - subsidies on products = GDP Occupations are first and second jobs, either full or part time, including self employed")
4
First some definitions… Exported services include time, expertise, the use of equipment, or some other non physical thing.

5
First some definitions… Creative Industries: Advertising and marketing Architecture Crafts Design: product, graphic and fashion design Film, TV, video, radio and photography IT, software and computer services Publishing Museums, galleries and libraries Music, performing and visual arts

6
First some definitions… Creative Industries: Advertising and marketing Architecture Crafts Design: product, graphic and fashion design Film, TV, video, radio and photography IT, software and computer services Publishing Museums, galleries and libraries Music, performing and visual arts

7
First some definitions… Creative Occupations: Advertising and marketing Architecture Crafts Design: product, graphic and fashion design Film, TV, video, radio and photography IT, software and computer services Publishing Museums, galleries and libraries Music, performing and visual arts

8
First some definitions… Creative Occupations: Advertising and marketing

9
And finally… The Creative Industries is everyone employed in the Creative Industries regardless of the occupation The Creative Economy is the Creative Industries, plus everyone outside them in Creative Occupations

10
Background Earliest attempts by DCMS to define and measure the Creative Industries were in 1998 and 2001 with the “Mapping Documents” Further work done with ONS and Nesta to improve the definitions

11
Background Current approach uses the “Creative Intensities” This means an industry composed of a sufficient number of Creative Occupations

12
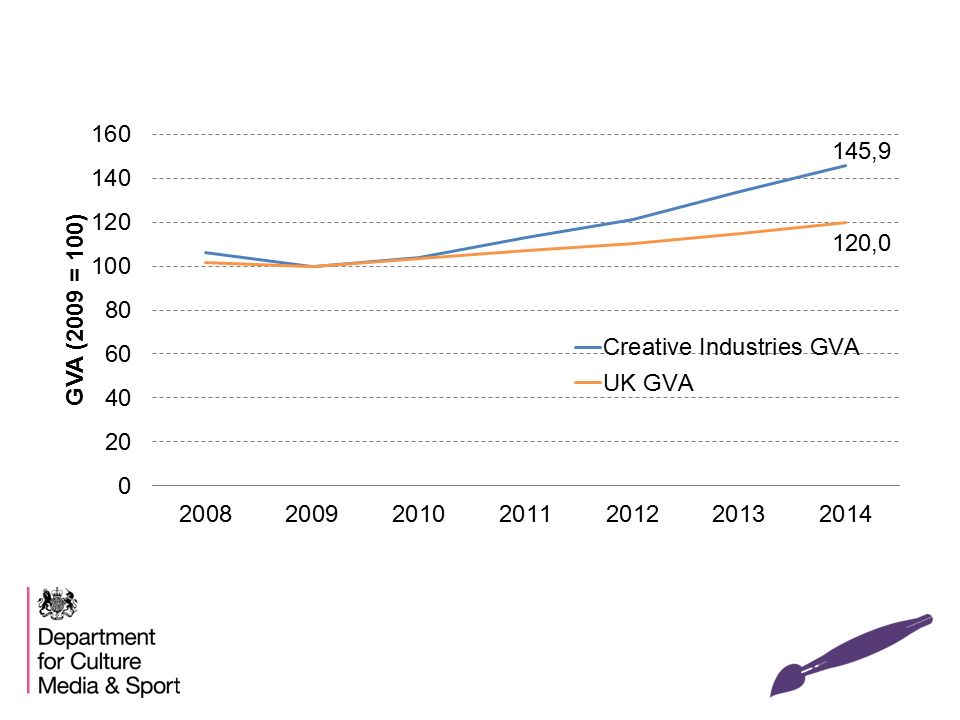
So where are we today? DCMS released the latest stats on the 26 th January 2016 Latest figures are from 2014 The Creative Industries were worth £84.1 billion – 5.2% of the UK economy That’s an 8.9% increase from 2013

15
Sector % change (2013-2014) CAGR (2008-2014) 1. Advertising and marketing 10.9%8.0% 2. Architecture 16.4%3.3% 3. Crafts -- 4. Design: Product, Graphic and Fashion Design 16.6%9.7% 5. Film, TV, video, radio and photography 13.8%4.7% 6. IT, software and computer services 7.4%5.8% 7. Publishing 2.8%1.6% 8. Museums, Galleries and Libraries -- 9. Music, performing and visual arts 5.4%6.5% Total 8.9%5.4% UK Total (Blue book, ABML) 4.6%2.8% % share of UK Total 2.7%2.5%
 4.6%2.8% % share of UK Total 2.7%2.5%.")
17
Blue Book Sector or Creative Industries Percentage Change in GVA between 2013 & 2014 Percentage Change in GVA between 2008 & 2014 Construction10.2%9.7% Creative Industries8.9%37.5% Total professional and support7.3%22.6% Other services7.1%30.6% Financial and Insurance Activities7.0%21.6% Distribution, transport, hotels and restaurants 5.5%16.3% Real Estate Activities3.7%34.7% Agriculture, Forestry and Fishing2.5%11.9% Information and Communication2.2%13.3% Government, health and education2.2%12.7% Production-0.2%11.7% UK Economy Total4.6%18.2%

18
Latest occupation stats Employment in the Creative Economy increased by 5% between 2013 and 2014 to 2.8 million jobs The number of jobs in the Creative Industries increased by 5.5% between 2013 and 2014 to 1.8 million In 2014 there were 1.9 million jobs in Creative Occupations, a 6.4% increase since 2013 Compare to 2.1% increase in the total number of jobs in the wider UK economy between 2013 and 2014

19
Latest exports stats The value of services exported by the UK Creative Industries in 2013 was £17.9bn Exports of Services by the UK Creative Industries increased by 3.5 per cent between 2012 and 2013 Exports of services from the Creative Industries accounted for 8.7 per cent of total exports of services for the UK in 2013

20
So where to next? We’ve proposed a number of developments in the latest publication We’d like your feedback on these For some, we’ve already done the analysis…

21
Proposed developments Estimates of GVA for the Creative Economy. Accounting for under coverage of microbusinesses and self-employed. Estimates of Productivity for the Creative Industries. Inclusion of exports of goods in estimates of exports. Reviewing the industries included using the creative intensity approach. Sub-national GVA estimates Now-casting

22
Creative Economy GVA In 2014, the Creative Economy was worth £133.3bn (8.2%of the UK economy)
")
23
Creative Economy GVA The Creative Economy has grown by a quarter since 2011 (12.1% for the whole UK economy)
")
24
Export of goods We can measure exports of goods using Classification of Product Activity codes These codes classify goods, not industries The categories are reasonably aligned with the SIC codes

25
Export of goods Category CPA (08)20132014 Architectural Plans & DrawingP2YHGroup 71.1 11 91 Jewellery, Bijouterie & Related ArticlesP2XPGroup 32.14 4624 449 Films & VideosP2CHGroup 59.1 442 343 Exposed Photographic FilmP2CNGroup 74.2 7 4 Packaged Computer SoftwareP2CFGroup 58.2 516 395 Printed MatterP2CEGroup 58.11 6401 655 Antiques & CollectionsP2CSGroup 91.0 804 877 Audio Recordings & Printed MusicP2CIGroup 59.2 130 119 Paintings & SculpturesP2CQGroup 90.02 9072 682 Musical InstrumentsP2XQGroup 32.2 62 76 Total Creative Industries10,981 10,691 £million
 Architectural Plans & DrawingP2YHGroup Jewellery, Bijouterie & Related ArticlesP2XPGroup Films & VideosP2CHGroup Exposed Photographic FilmP2CNGroup Packaged Computer SoftwareP2CFGroup Printed MatterP2CEGroup Antiques & CollectionsP2CSGroup Audio Recordings & Printed MusicP2CIGroup Paintings & SculpturesP2CQGroup Musical InstrumentsP2XQGroup Total Creative Industries10,981 10,691 £million")
Similar presentations


 Richard G Maloney, PhD Director ad interim, Arts Administration.>")


