Download presentation
Presentation is loading. Please wait.

1
TEXAS HOMELAND SECURITY &EMERGENCY MANAGEMENT CONFERENCE APRIL 28, 2011 SAN ANTONIO, TEXAS

2
Agenda Introduction and Overview State Requirements Parts of Risk Analysis Review Process

3
Mitigation Planning Process

4
Why Have a Mitigation Plan? Provides Risk Analysis Identify hazards that pose a threat Potential loss risk Serves as the gateway to 5 major mitigation grant programs.

5
Harris County Mitigation Plan Harris County All-Hazard Mitigation Plan FEMA Approved: August 19, 2010 Multi-Jurisdictional Plan (34 Jurisdictions Total) 28 Municipalities 4 Special Jurisdictions Brought over $317 million to Harris County and participating jurisdictions since the year 2000
 28 Municipalities 4 Special Jurisdictions Brought over $317 million to Harris County and participating jurisdictions since the year 2000")
6
Timelines Project Timeline Started:June 4, 2009 Completed:February 21, 2011 Duration:448 Workdays Risk Analysis Timeline Started:September 2, 2009 Completed:November 18, 2009 Duration:56 Workdays

7
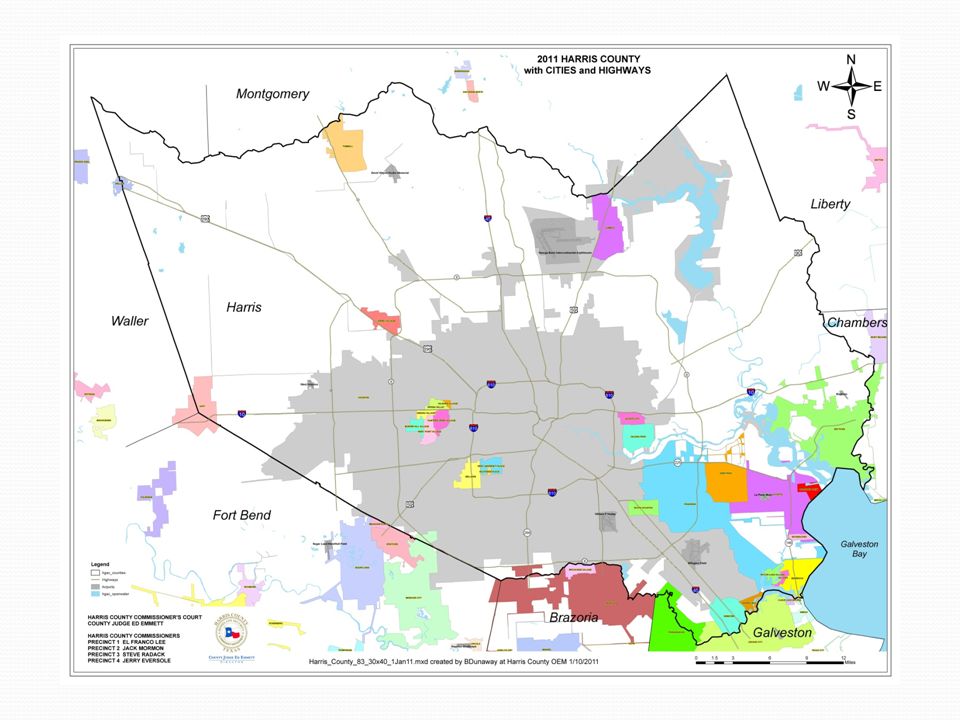
Harris County Community Profile 1777 Square Miles 4+ Million People 1.5+ Million Households 3 rd Largest County by Pop 34 Cities 22 Major Watersheds 8800 Miles of Pipeline Over 1200 MUD/PUDs 35 Presidential Declarations of Disaster

9
Jurisdiction-Based Challenges Diversity in EM Community Special Jurisdiction Overlap

10
Multi-Jurisdictional Planning Team (MJPT)
")
11
Risk Assessment Hazard Profiling Hazard Identification Hazard Analysis Loss Estimation NFIP Requirements Risk Assessment Hazard Profiling Loss Est NFIP Req

12
FEMA Crosswalk Requirements Risk Assessment Hazard Profiling Loss Est NFIP Req Hazard Profile Hazard Identification Identify the hazards with potential Identify how the hazards are measured or quantified. Hazard Analysis Identify the hazard area at risk Extent of risk (magnitude/severity) Provide historical occurrence data and damage summaries Loss/Vulnerability Identify probability of future events Summarize the vulnerability to each hazard Address impact of each hazard NFIP Requirements Identify types and numbers of repetitive loss properties Describe participation in NFIP Identify, analyze, and prioritize NFIP related mitigation action items
 Provide historical occurrence data and damage summaries Loss/Vulnerability Identify probability of future events Summarize the vulnerability to each hazard Address impact of each hazard NFIP Requirements Identify types and numbers of repetitive loss properties Describe participation in NFIP Identify, analyze, and prioritize NFIP related mitigation action items.")
13
Hazard Identification Where can you go to identify hazards? State Mitigation Plan Local Basic Plan (EAP/EOP) Internet National Weather Service Libraries Floodplain Managers Past Events Mitigation plan currently focuses only on natural hazards Risk Assessment Hazard Profiling Loss Est NFIP Req
 Internet National Weather Service Libraries Floodplain Managers Past Events Mitigation plan currently focuses only on natural hazards Risk Assessment Hazard Profiling Loss Est NFIP Req.")
14
Hazard ID – State Plan Risk Assessment Hazard Profiling Loss Est NFIP Req

15
Hazard ID – State Plan Risk Assessment Hazard Profiling Loss Est NFIP Req

16
Hazard ID – Local Basic Plan Risk Assessment Hazard Profiling Loss Est NFIP Req

17
Hazard Identification Flood Hurricanes and Costal Storms Severe Thunderstorms Tornadoes Wildfire Drought Extreme Heat Winter Storms and Freezes Hail Erosion Dam/Levee Failure Earthquakes, Sinkholes, Subsidence, Landslides Tsunami Toxic Release / Haz-Mat Energy Pipeline Failures Risk Assessment Hazard Profiling Loss Est NFIP Req

18
Hazard Identification How are the hazards measured or scaled? Risk Assessment Hazard Profiling Loss Est NFIP Req

19
Hazard Occurrence Risk Assessment Hazard Profiling Loss Est NFIP Req Where can you get occurrence data? Internet NOAA National Climactic Data Center http://www.ncdc.noaa.gov Texas Hazard Mitigation Package (THMP) http://www.thmp.info/ National Weather Service Texas Forest Service Floodplain Managers Local Meteorologists
 National Weather Service Texas Forest Service Floodplain Managers Local Meteorologists.")
20
Hazard Occurrence Risk Assessment Hazard Profiling Loss Est NFIP Req HazardOccurrencesStart DateEnd DateYear TotalOccurrence Ratio (1 Event Every X Years) Source Riverine Flood134190020091090.813NCDC Costal Flood1419502009594.214NCDC, THMP Hurricane Winds1419502009594.214NCDC Tornados23319502008580.249NCDC, THMP Thunderstorms46319552009540.117NCDC Drought319962009134.333NCDC, THMP Hail39019562009530.136NCDC Wildfire019502009590.000NCDC, TFS Winter Storms919502009596.556NCDC, THMP Dam / Levee Failure0 00 00.000Multiple Earthquakes118821985103103.000THMP, NGDC Sinkholes00000.000Multiple Subsidence00000.000Multiple Landslides00000.000Multiple Erosion00000.000Multiple Tsunami2-2000200940092004.500NGDC Toxic Release / Haz-Mat42003200410.250THMP Energy Pipeline Failures00000.000Multiple
 Source Riverine Flood NCDC Costal Flood NCDC, THMP Hurricane Winds NCDC Tornados NCDC, THMP Thunderstorms NCDC Drought NCDC, THMP Hail NCDC Wildfire NCDC, TFS Winter Storms NCDC, THMP Dam / Levee Failure Multiple Earthquakes THMP, NGDC Sinkholes Multiple Subsidence Multiple Landslides Multiple Erosion Multiple Tsunami NGDC Toxic Release / Haz-Mat THMP Energy Pipeline Failures Multiple")
21
Occurrences & Damage Summaries Risk Assessment Hazard Profiling Loss Est NFIP Req

22
Hazard Risk Area Risk Assessment Hazard Profiling Loss Est NFIP Req

23
Hazard Analysis Which hazards pose the greatest risk to your area? How do you know? Factors to Examine Severity of Impact* Likelihood of Occurrence* Warning Time* Cascading Potential* Seasonal Patterns Probable Duration Area Potentially Affected Risk Assessment Hazard Profiling Loss Est NFIP Req

24
Harris County Hazard Analysis Risk Assessment Hazard Profiling Loss Est NFIP Req

25
Harris County Hazard Analysis EM Survey Focused on “Perceived Risk” among area emergency management professionals. Risk Assessment Hazard Profiling Loss Est NFIP Req

26
Harris County Hazard Analysis Risk Assessment Hazard Profiling Loss Est NFIP Req Severity of Impact ScoreCriterion 1Limited Injuries and/or illnesses are treatable with first aid. Minor quality of life lost. Shutdown of critical facilities and services for 24 hours or less. Less than 10 percent of property within the region destroyed or with major damage. 2Minor Injuries and/or illnesses do not result in permanent disability. Complete shutdown of critical facilities for more than 1 week. More than 10 percent of property within the region destroyed or with major damage. 3Major Injuries and/or illnesses result in permanent disability. Complete shutdown of critical facilities for at least 2 weeks. More than 25 percent of property within the region destroyed or with major damage. 4Substantial Multiple deaths Complete shutdown of facilities for 30 days or more. More than 50 percent of property within the region destroyed or with major damage. Area Impacted ScoreCriterion 1Limited Less than 25% of Harris County impacted 2Minor Between 26% and 50% of Harris County impacted 3Major Between 51% and 75% of Harris County impacted 4Substantial Between 76% and 100% of Harris County impacted Warning Time Score 1More than 12 hours warning 26 to 12 hours warning 33 to 6 hours warning 4Minimal (or no) warning
 warning.")
27
Harris County Hazard Analysis Risk Assessment Hazard Profiling Loss Est NFIP Req Overall Hazard Risk for Harris County HazardRisk Riverine FloodHigh Hurricane WindsHigh Coastal FloodHigh Toxic Release / Haz-MatModerate Energy Pipeline FailuresModerate TornadosModerate ThunderstormsModerate HailModerate DroughtModerate Extreme HeatModerate Dam / Levee FailureLow WildfireLow Winter StormsLow SinkholesLow EarthquakesLow TsunamiLow SubsidenceLow ErosionLow LandslidesLow

28
Loss Estimation / Vulnerability Assmt Probability of Future Events Vulnerability to each hazard Potential Loss Dollar Values and Building Count is not required Highly encouraged Very useful information for inter-jurisdictional use Initial DSO Estimation Grant Funding Justification Mitigation Action Item Identification Risk Assessment Hazard Profiling Loss Est NFIP Req

29
National Standard for Loss Estimation GIS Intensive Limited Computer Specifications (SP3, Win7, Etc.) Census Based Data Addresses limited hazards Not designed for “out of box” use A nationally applicable standardized methodology that estimates potential losses from earthquakes, hurricane winds, and floods (FEMA, 2010). Hazards Addressed: Flooding Hurricanes Earthquakes Risk Assessment Hazard Profiling Loss Est NFIP Req

30
Harris County Vulnerability Assmt To address vulnerability we identified: Population Density Population Growth Projections Future probability of occurrence for each hazard Total Loss Estimations Potential Risk Areas for each hazard 1 Potential Associated Losses for each hazard Risk Assessment Hazard Profiling Loss Est NFIP Req 1 Uses historical occurrence data Data in grey is not required by the FEMA crosswalk.

31
Cases of Negligibility For some “low risk” hazards Risk Assessment Hazard Profiling Loss Est NFIP Req Flood Hurricanes and Costal Storms Severe Thunderstorms Tornadoes Wildfire Drought Extreme Heat Winter Storms and Freezes Hail Erosion Dam/Levee Failure Earthquakes, Sinkholes, Subsidence, Landslides Tsunami Toxic Release / Haz-Mat Energy Pipeline Failures

32
Future Event Probability Risk Assessment Hazard Profiling Loss Est NFIP Req HazardOccurrencesStart DateEnd DateYear TotalOccurrence Ratio (1 Event Every X Years) Source Riverine Flood134190020091090.813NCDC Costal Flood1419502009594.214NCDC, THMP Hurricane Winds1419502009594.214NCDC Tornados23319502008580.249NCDC, THMP Thunderstorms46319552009540.117NCDC Drought319962009134.333NCDC, THMP Hail39019562009530.136NCDC Wildfire019502009590.000NCDC, TFS Winter Storms919502009596.556NCDC, THMP Dam / Levee Failure0 00 00.000Multiple Earthquakes118821985103103.000THMP, NGDC Sinkholes00000.000Multiple Subsidence00000.000Multiple Landslides00000.000Multiple Erosion00000.000Multiple Tsunami2-2000200940092004.500NGDC Toxic Release / Haz-Mat42003200410.250THMP Energy Pipeline Failures00000.000Multiple
 Source Riverine Flood NCDC Costal Flood NCDC, THMP Hurricane Winds NCDC Tornados NCDC, THMP Thunderstorms NCDC Drought NCDC, THMP Hail NCDC Wildfire NCDC, TFS Winter Storms NCDC, THMP Dam / Levee Failure Multiple Earthquakes THMP, NGDC Sinkholes Multiple Subsidence Multiple Landslides Multiple Erosion Multiple Tsunami NGDC Toxic Release / Haz-Mat THMP Energy Pipeline Failures Multiple")
33
FEMA Loss Methodology Risk Assessment Hazard Profiling Loss Est NFIP Req

34
Harris County VA/Loss Methodology Risk Assessment Hazard Profiling Loss Est NFIP Req

35
Harris County VA/Loss Methodology Hazard Areas Base Data Structure Values Property Lines Critical Infrastructure Etc Jurisdictional Boundary Risk Assessment Hazard Profiling Loss Est NFIP Req

36
Final Data – Fixed Hazard Area Risk Assessment Hazard Profiling Loss Est NFIP Req

37
Projected Hazard Areas Some hazards pose the same risk across the entire planning area. Worst Case Scenario – Total Loss Not Realistic Examples Hail Thunderstorms Tornados Hurricane Winds Haz-Mat / Pipeline We expanded on these by generating a projected risk area More Realistic Buffer Zones Risk Assessment Hazard Profiling Loss Est NFIP Req

38
Buffer Zones for Projected Areas Risk Assessment Hazard Profiling Loss Est NFIP Req.5 mi @.95 1 mi @.45 2 mi @.15

39
Final Data – Projected Hazard Area Risk Assessment Hazard Profiling Loss Est NFIP Req

40
Repetitive Loss Identify Repetitive Loss Properties Coordinate with State Mitigation Planning Group List in your Plan Over 4560 properties in HCLMP planning area Placed in plan as separate Appendix (Appendix C) 116 pages Risk Assessment Hazard Profiling Loss Est NFIP Req
 116 pages Risk Assessment Hazard Profiling Loss Est NFIP Req")
41
NFIP Participation Describe participation in NFIP http://bsa.nfipstat.com/ Risk Assessment Hazard Profiling Loss Est NFIP Req

42
NFIP Action Items Identify, analyze, and prioritize NFIP related action items. Risk Assessment Hazard Profiling Loss Est NFIP Req

43
Words of Wisdom… Dams / Levee Failure Wildfire National Climactic Data Center Keep TDEM in the loop! Document Everything!!! Risk Assessment Hazard Profiling Loss Est NFIP Req

44
Recommended Sources FEMA Mitigation Planning Guidance TDEM G-710 Mitigation Planning Course TDEM G-720 Mitigation Grants Course

45
Questions Joshua Glover joshua.glover@oem.hctx.net (713) 755-2327 www.hcoem.org
")
Similar presentations


 May.>")


 Planner Michael Caudill (West TN) Area Coordinator.>")


