Download presentation
Presentation is loading. Please wait.

1
Chapter 7 The Human Population

2
Put the following 10 countries in order from most to least populated: Nigeria Japan United States Brazil Bangladesh Pakistan China Russia Indonesia India 1) China 2) India 3) United States 4) Indonesia 5) Brazil 6) Pakistan 7) Nigeria 8) Bangladesh 9) Russia 10) Japan
 China 2) India 3) United States 4) Indonesia 5) Brazil 6) Pakistan 7) Nigeria 8) Bangladesh 9) Russia 10) Japan")
3
Scientists Disagree on Earth’s Carrying Capacity Figure 7.1 Think of three possible reasons why our population began to explode: WHO does this benefit? Hurt?

4
Dot…..

5
Scientists Disagree on Earth’s Carrying Capacity The following graphs show theoretical models of food supply and population size. Exponential growth J-curve

6
Factors that Drive Human Population Growth Demography- the study of human populations and population trends. Changes in Population Size Fertility Life Expectancy Age Structure Migration

7
Changes in Population Size Immigration- the movement of people into a country Emigration- the movement of people out of a country. Net migration rate- the difference between immigration and emigration in a give year per 1,000 people in the country.

8
Changes in Population Size Crude birth rate (CBR)= the number of births per 1,000 individuals per year. A city with 53,340 people has 876 births. What is the birth rate? 876 births = X births 53, 340 people 1,000 people 53, 340 X = 876,000 X = 16.4 births per thousand people

9
Changes in Population Size Crude death rate (CDR)= the number of deaths per 1,000 individuals per year. Another city experiences 12 deaths for each thousand people. What is the death rate? Death rate = 12 deaths 1,000 people 12 deaths per thousand people

10
Changes in Population Size Why are these equations different? ()
")
11
Practice Worldwide in 2009, 20 births and 8 deaths per 1000 people; What is the growth rate? Global Population Growth Rate = (20 – 8) ÷ 10 = 1.2%
 ÷ 10 = 1.2%.")
12
Changes in Population Size Doubling time (in years) = 70 ÷ growth rate Rule of 70 Example:If a population is growing at 2% what is the doubling time? 70 ÷ 2 = 35 years for the population to double!!

13
Fertility Total fertility rate- an estimate of the average number of children that each woman in a population will bear. Replacement level fertility - the total fertility rate required to offset the average number of deaths in a population and for the current population size to remain stable.

14
Fertility Developed countries- countries with relatively high levels of industrialization and income will tend to have a TFR of… 2.1 Developing countries- countries with relatively low levels of industrialization and income of less that $3 per person per day will tend to have a TFR…. Greater than 2.1 WHY???

15
Life Expectancy Life expectancy- the average number of years that an infant born in a particular year in a particular country can be expected to live, given the current average life span and death rate of that country. Reported in 3 ways: Overall Population of the country Males only Females only United States in 2008 Overall 69 Males 67 Females 70 Why is there a gap for males and females?

16
Life Expectancy Infant mortality rate - the number of deaths of children under 1 year of age per 1,000 live births. Child mortality rate - the number of deaths of children under age 5 per 1,000 live births.

17
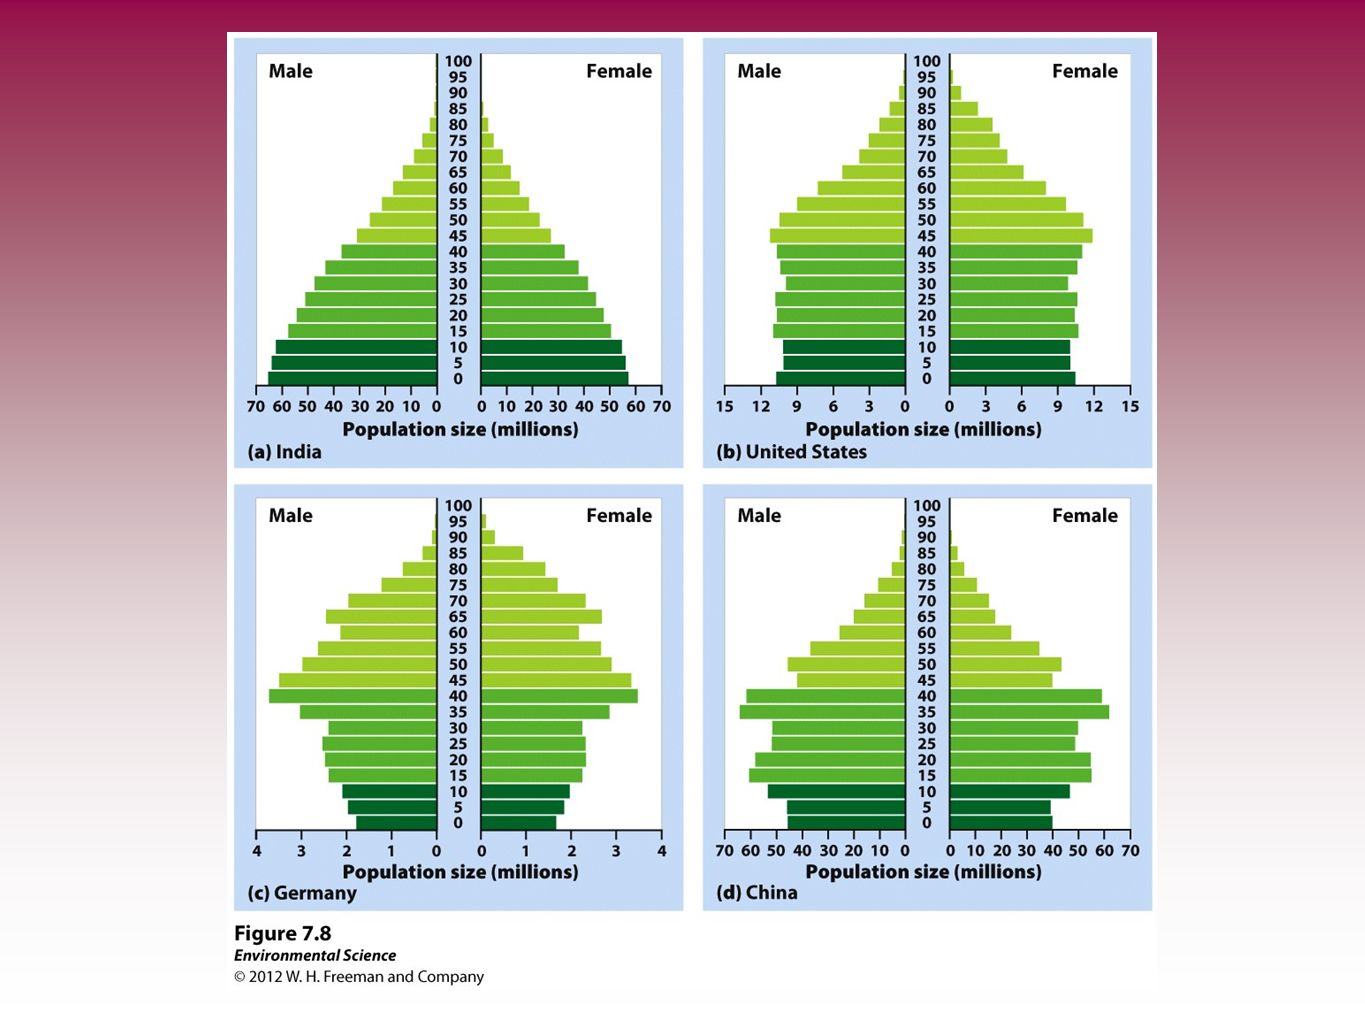
Age Structure Age structure diagrams (population pyramids )- visual representations of age structure within a country for males and females. As shown in figure 7.8 pg 186

19
The Demographic Transition theory of the demographic transition The theory of the demographic transition is the theory that as a country moves from a subsistence economy to industrialization and increased affluence, it undergoes a predictable shift in population growth.

20
The Stages of the Demographic Transition Read and describe in your words the 4 phases, pages 189-190

21
The Stages of the Demographic Transition Phase 1: Slow population growth because there are high birth rates and high death rates which offset each other. Phase 2: Rapid population growth because birth rates remain high but death rates decline due to better sanitation, clean drinking water, increased access to food and goods, and access to health care. Phase 3: Stable population growth as the economy and educational system improves and people have fewer children. Phase 4: Declining population growth because the relatively high level of affluence and economic develop encourage women to delay having children.

22
Family Planning Family planning- the regulation of the number or spacing of offspring through the use of birth control.

23
The 12 Most Populous Countries in the World

24
The relationship between economic development and population growth rate for developing nations.

25
Ecological Footprints Affluence - having a lot of wealth such as money, goods, or property.

26
The IPAT Equation To estimate the impact of human lifestyles on Earth we can use the IPAT equation : I mpact= P opulation X A ffluence X T echnology

29
The Impact of Affluence A nations wealth = Gross domestic product (GDP)- the value of all products and services produced in a year in that country. GDP is made up of consumer spending, investments, government spending, and exports minus imports. A countries GDP often correlates with its pollution levels.

Similar presentations