Download presentation
Presentation is loading. Please wait.

5
Fiscal Organization of Metropolitan Areas in the U.S. In general, highly fragmented School districts, municipalities, special districts, counties, and cities. Of big cities, 25 have consolidated city- couty governments

7
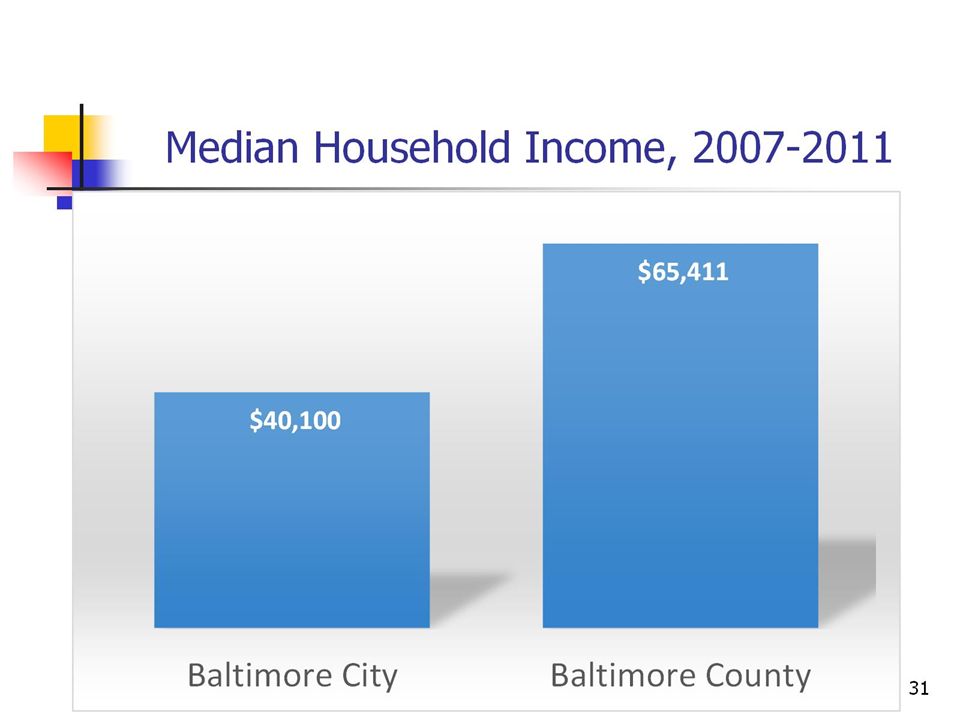
But consolidated city does not imply metropolitan city! Take the example of Baltimore

11
Older Central Cities in the U.S. are at a strong competitive disadvantage relative to their suburbs.

12
Detroit: Largest municipal bankruptcy. 1. Declining Economic base and tax revenue 2. Overlapping gov’ts not important 3. Decline in State Aid 4. Fiscal Imprudence

16
Contrast Detroit with Buffalo, NY State aid replaced declining tax revenues Implicit tax on NYC metro area to fund declining upstate NY

22
No significant metropolitan governments. No trend toward metropolitan consolidation. Fiscal Arrangements and Fiscal Policy City-County: consolidated? School Districts: Independent or dependent, city or county? Special Districts Vary in importance

25
In cities with independent school districts (own taxing authority), municipal government relies more on charges than in cities with dependent school districts
, municipal government relies more on charges than in cities with dependent school districts")
27
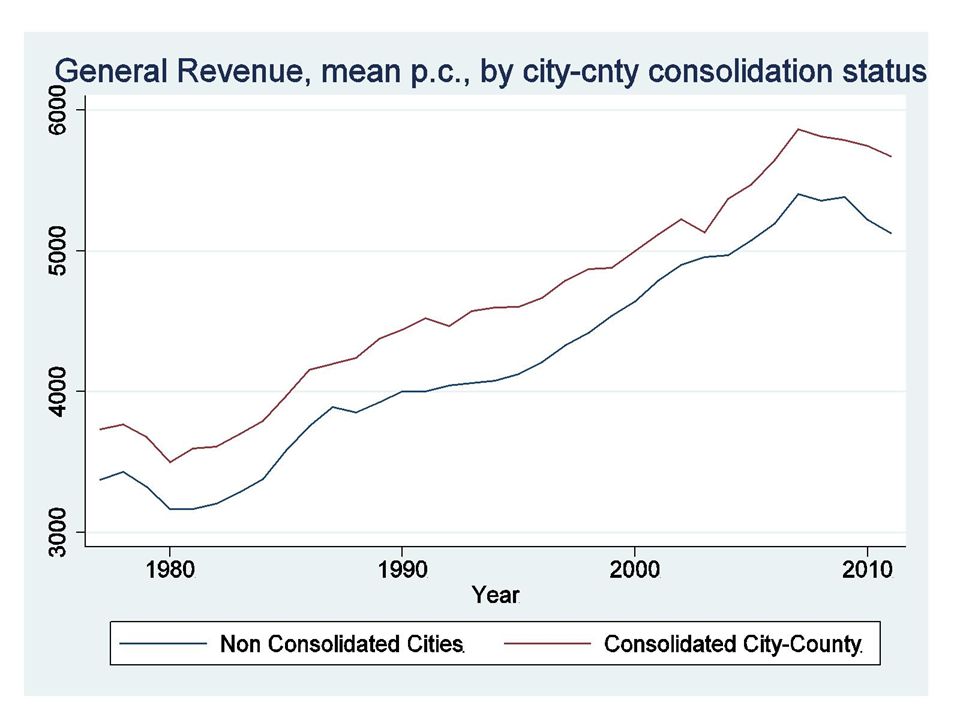
General Revenue held up better in great recession in cities with dependent school districts.

29
Regression Analysis of FISC spending, overall and by function Effect of Population (Economies of scale) Effect of Intergovernmental Grants
 Effect of Intergovernmental Grants")
32
Population Effect: positive overall, positive for all functions except education and administration Intergovernmental Grants are Stimulative $1 of state aid leads to $1.29 spending increase $1 of federal aid leads to $2.3 of additional spending

33
The Great Recession and the fiscal response of cities

Similar presentations