Download presentation
Presentation is loading. Please wait.

1
Power View Overview April 25, 2015

2
POWER VIEW Presentation ready visualizations for the masses.

3
INTRODUCTION Phillip Labry Sr. BI Engineer IT development for over 25 years Developer, Database, BI Experience with Manufacturing, Telecom, Banking, Retail, Government, Energy, Insurance, Healthcare, Consulting Email: Phillip@labry.comPhillip@labry.com Twitter: @PhillipLabry http://phillip.labry.com http://skylinetechnologies.com/Blog.aspx

4
CLIENT SUCCESS

5
THANKS TO OUR SPONSORS

6
OVERVIEW Power View is a tool for intuitive ad hoc reporting which provides an interactive data exploration, visualization, and presentation experience to the business users. Highly visual design experience Rich meta data-driven interactivity Presentation-ready at all times The data model can be optimized to fully exploit the capabilities of the Power View experience Leverages Analysis Services Tabular(Xvelocity) for data source Limited formatting options Supports Multidimensional source in SQL Server 2012 SP1 CU4
 for data source Limited formatting options Supports Multidimensional source in SQL Server 2012 SP1 CU4.")
7
OVERVIEW Power View is a tool for intuitive ad hoc reporting which provides an interactive data exploration, visualization, and presentation experience to the business users. Highly visual design experience Rich meta data-driven interactivity Presentation-ready at all times The data model can be optimized to fully exploit the capabilities of the Power View experience Leverages Analysis Services Tabular(Xvelocity) for data source Limited formatting options Supports Multidimensional source in SQL Server 2012 SP1 CU4
 for data source Limited formatting options Supports Multidimensional source in SQL Server 2012 SP1 CU4.")
8
OVERVIEW Charts and graphs are interactive and can be used as filters Available in Sharepoint, Excel 2013 and Office 365 Pie charts, scatter charts, maps, KPIs, hierarchies Drill up and drill down Background images Tile images Format reports with styles, themes, text resizing, and backgrounds Power View reports on existing multidimensional models Can export to Power Point with Live reports* Reports can be printed

9
OVERVIEW Charts and graphs are interactive and can be used as filters Available in Sharepoint, Excel 2013 and Office 365 Pie charts, scatter charts, maps, KPIs, hierarchies Drill up and drill down Background images Tile images Format reports with styles, themes, text resizing, and backgrounds Power View reports on existing multidimensional models Can export to Power Point with Live reports* Reports can be printed

10
IT’S ALL ABOUT THE MODEL

11
HOW TO INSTALL IT IN EXCEL Included with Excel in Office 2013 Professional Plus Typically not enabled by default Missing “Power View” button on Excel Insert ribbon File -> Options -> Add-ins Manage COM Add-ins Check “Power View”

12
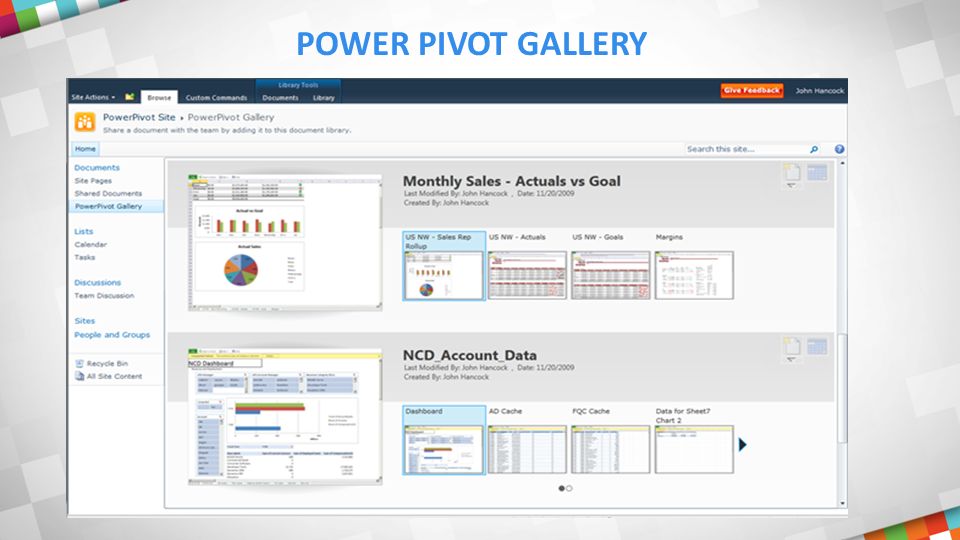
POWER PIVOT GALLERY Special purpose SharePoint document library that provides rich preview capabilities. Can store only Power View reports and Excel Documents Power Pivot workbooks can be scheduled for refresh Sharepoint library must have permissions for all data sources used in Power Pivot workbook or the workbook must have stored userids and passwords(not recommended) Excel documents are supported using Excel Services and support many Excel features. Power View reports can be created from Power Pivot Workbooks stored in the gallery Multiple views: Theatre, Gallery and Carousel
 Excel documents are supported using Excel Services and support many Excel features. Power View reports can be created from Power Pivot Workbooks stored in the gallery Multiple views: Theatre, Gallery and Carousel.")
13
POWER PIVOT GALLERY

15
DATA SOURCES Microsoft SQL Server Analysis Services Tabular Microsoft SQL Server Analysis Services Available in Data connection library Models made available by the BI team

16
KEY PERFORMANCE INDICATORS key performance indicator (KPI) A quantifiable measure for gauging business objectives. The KPI gauges the performance of the value, defined by a base measure, against a target value, also defined by a measure or by an absolute value. KPIs are supported natively Must be present in the model in order to use this feature.

17
HIERARCHIES Hierarchies enable drilling up and down in charts, tables, etc. Hierarchies can be defined in the model or in the power view report Adding multiple fields to the rows or columns box creates a hierarchy in a matrix In a chart add multiple fields in the axis box. If you find that you create the same hierarchy regularly, let the BI team know so they can include it in the model. Supports “unnatural hierarchies”

18
TABLES AND MATRICES Basically columns and rows Can be sorted Are affected by other object selections except other tables or matrices A matrix is more dynamic and allows for expanding and collapsing of hierarchies Cannot affect other objects

19
PIE CHARTS Pie charts can be more complex in Power View than you usually see them. Support hierarchies and drill down Sub slices are available Cross filtering with other charts

20
MAPS Maps are supported in Powerview Maps use Bing maps – internet connectivity is required Data model must have Geography data and must have attributes defined properly Cross filtering is supported Only pie charts are available Size of chart changes with data

21
SLICERS Slicers are an interactive filter that perform like buttons. Cannot hold more than one attribute Cannot hold a measure If you would like to see a measure and an attribute as a slicer, use a horizontal bar graph

22
FILTERS Filters are generally used to shape your data without having a visual representation of the filter on your report. Each Object has a filter The view has a filter View filters can be shared among other views in the report Filters can be complex or simple

23
POWER POINT EXPORT You can export your Power View report to Power Point and create an interactive presentation or a static view of the report views. Interactive mode requires Power Point 2013 Interactive mode requires network connectivity and authority to access the Power View report Static images are not refreshed. They are created during the initial export Interactive mode is available in reading mode or slide show mode only

24
DEMO

25
QUESTIONS? CONTACT Email: Phillip@labry.Com Twitter: @philliplabry Blog: Http://phillip.labry.comPhillip@labry.ComHttp://phillip.labry.com

Similar presentations


 features Compatibility experience and issues Missing cube.>")


