Download presentation
Presentation is loading. Please wait.

1
www.brownfieldstsc.org Using 3-D Image to Develop A Remediation Engineering Design A 3D Image of an Area Of Petroleum Impacted Soil Was Used to Design a Soil Excavation Remedial Action

2
www.brownfieldstsc.org Development of 3D Image 10,000 gallon heating oil tank leaked #2 fuel oil A site investigation was performed using a combination of direct sensing tools and conventional soil & gw sampling Data was integrated into a 3D model using several software package ArcScene & 3D Analyst, an extension of ArcGIS, was used to present the 3D image develop the engineering design

3
Fuel Florescence Detector (FFD) Primarily for petroleum hydrocarbon delineation Direct push Ultraviolet Florescence (UVF) probe (push only) UV lamp in probe causes hydrocarbons to fluoresce Fluorescence captured by probe and converted to electronic signal Continuous log of electronic signal created Signal strength corresponds to concentration and can be imported to ArcGIS Impact area can be imaged by classifying according to signal strength Fuel Fluorescence Detector
 Primarily for petroleum hydrocarbon delineation Direct push Ultraviolet Florescence (UVF) probe (push only) UV lamp in probe causes hydrocarbons to fluoresce Fluorescence captured by probe and converted to electronic signal Continuous log of electronic signal created Signal strength corresponds to concentration and can be imported to ArcGIS Impact area can be imaged by classifying according to signal strength Fuel Fluorescence Detector")
4
www.brownfieldstsc.org FFD Log Profiles Hung From Surface in 3D Model Space Area of Increased Signal Response “Flat Line” FFD Log Profiles At Edges FFD Electronic Signal Profile Land Surface

5
www.brownfieldstsc.org TPH Impact Area 3D Model Built From FFD Profiles Shells Represent FFD Signal Strength From 150 mv to 1200 mv Core Impact Area TPH Impact Model

6
www.brownfieldstsc.org Interval Specific Soil Samples are Collected Based on FFD Logs and Tested For TPH; The Results of Which Are Imbedded Into 3D Model Soil Samples Collected for Two Purposes: 1.Confirm FFD Based TPH Boundary 2.Range of FFD Signals To Develop Correlation Between Signal & TPH Soil Samples Collected To Confirm Boundary Soil Samples Collected To Develop TPH vs Signal Strength Relationship

7
www.brownfieldstsc.org FFD Profiles, TPH 3D Model and Soil Sample TPH Results Merged Together To Show Collaborative Data Set and Demonstrate Delineation

8
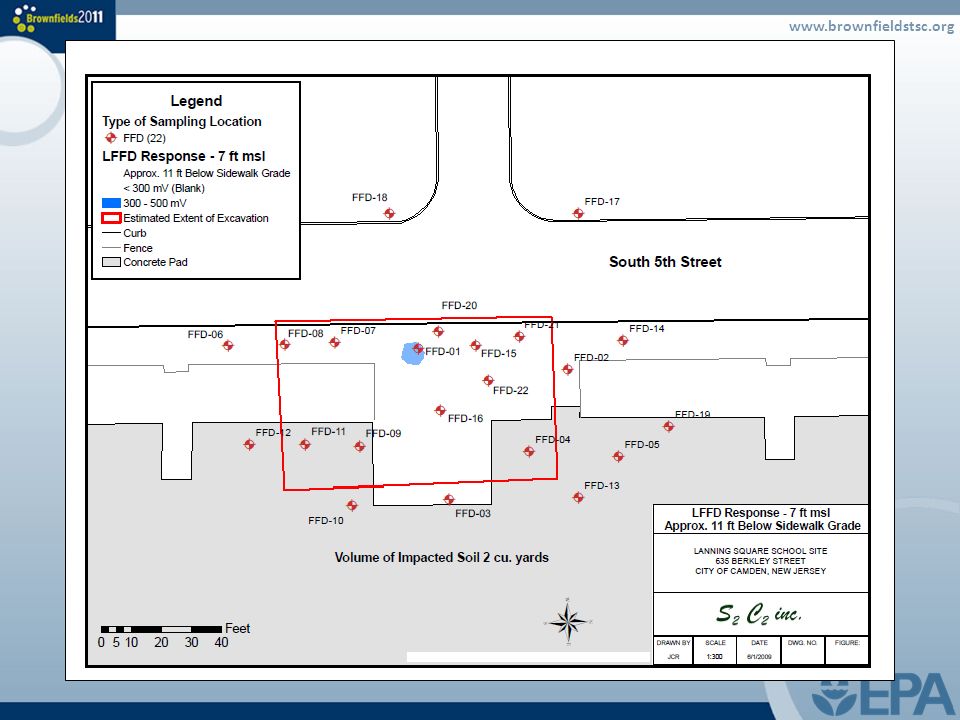
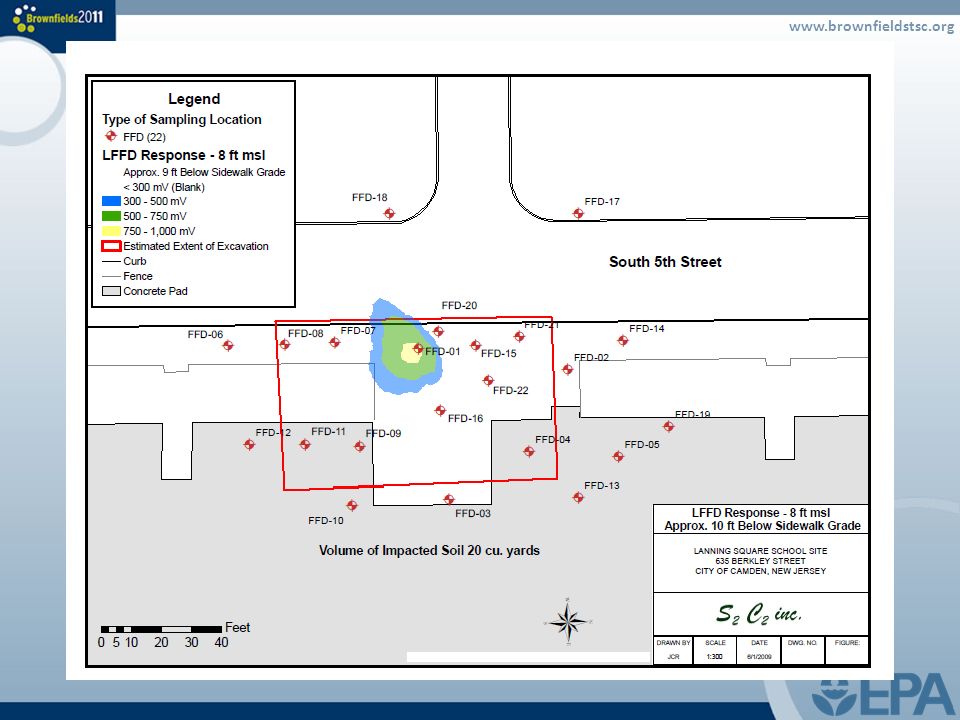
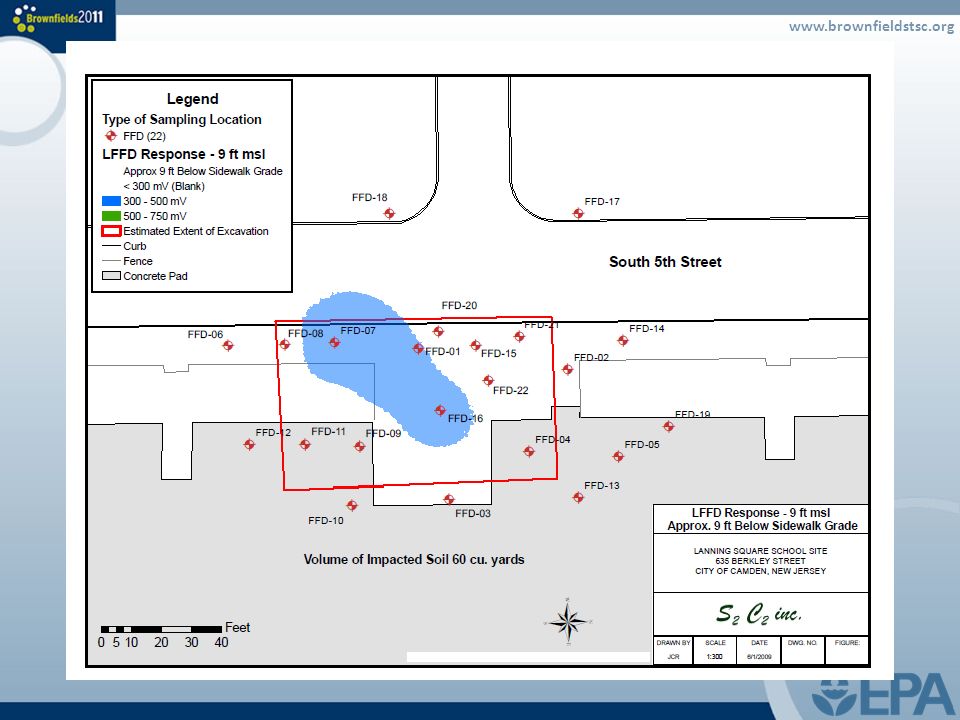
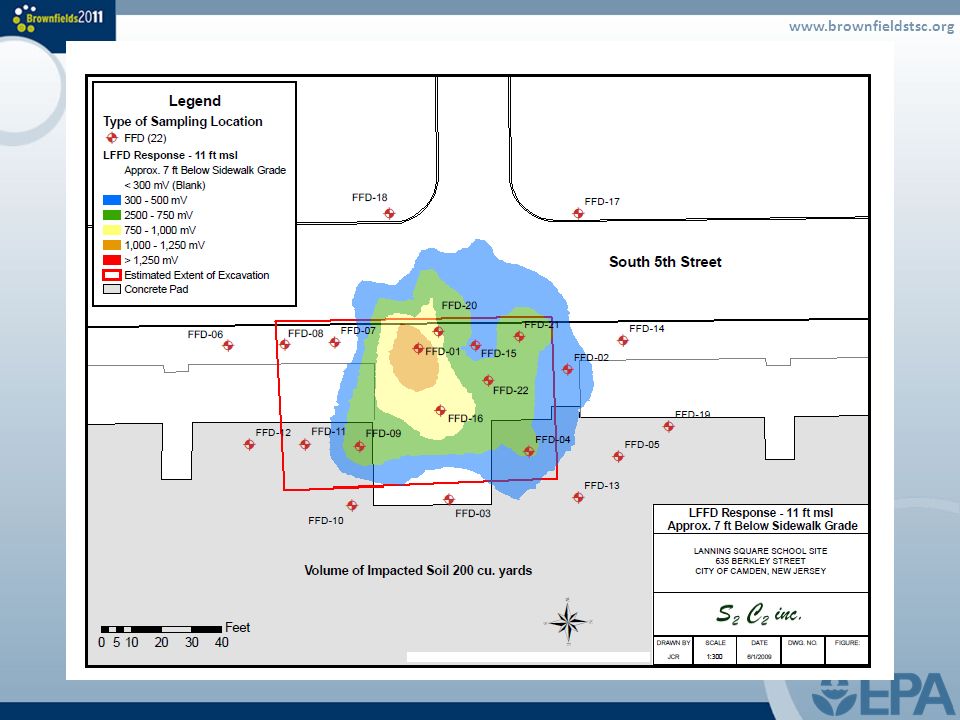
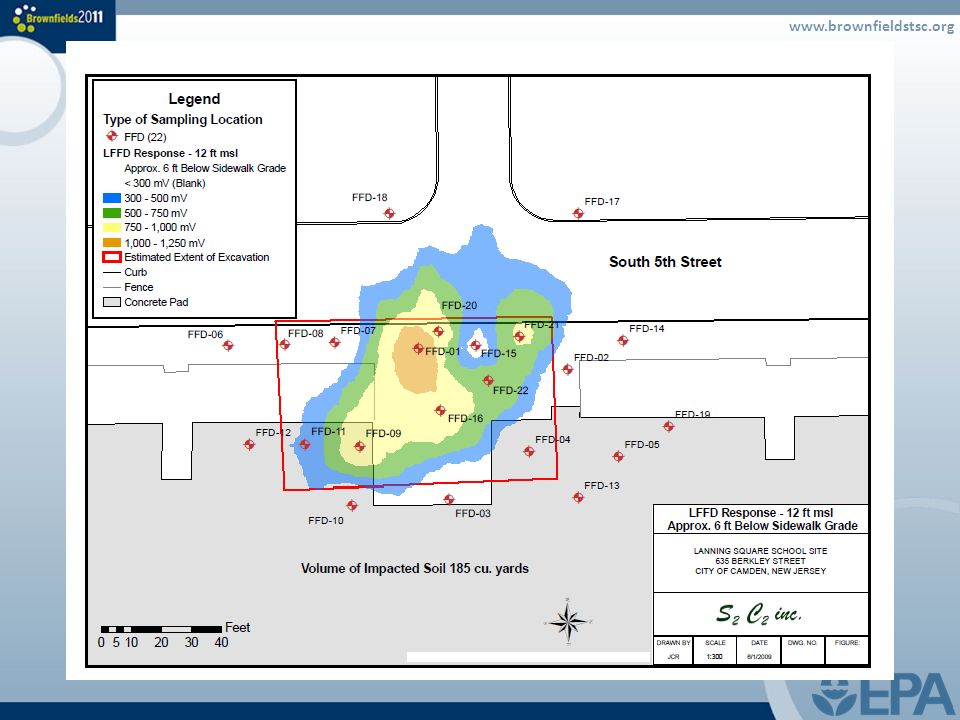
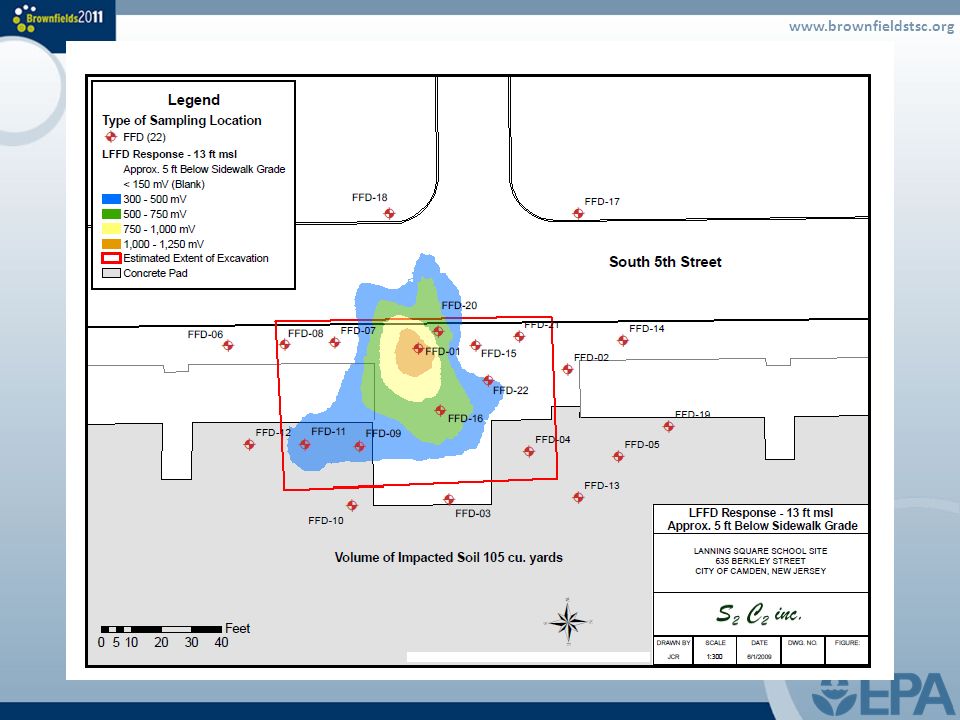
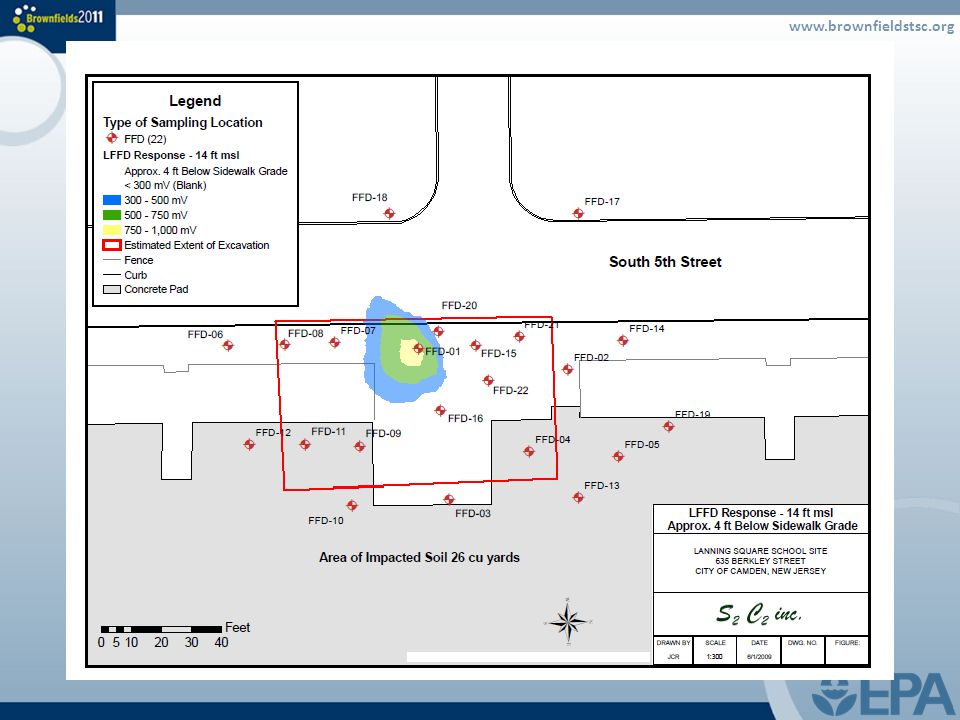
www.brownfieldstsc.org TPH Impact Area Delineated Extent of TPH Impacts Verified Through Collaborative Data Set & Imaging Various Clean up Options Can Be Quickly Evaluated: 1. Total Removal to Beyond 150 mv Shell 2. Removal to Extent of 500 mv Shell Which Correlates with approx. 5-6,000 ppm TPH 3. Free Product/Core Impact Area Removal For Maximum Risk Reduction Benefit

9
www.brownfieldstsc.org Engineering Analysis: Cross Sections Showing The Distribution of Fuel Impacts

10
www.brownfieldstsc.org
18
Using 3D Image of PHC Impact Zone to Design a ISCO Remedial Application Two USTs leaked (gasoline & diesel tanks) creating two plumes of PHC impacts. Direct sensing coupled w/conventional soil & gw sampling was used to develop a 3D image of the impact zone. This image was used to design an In Situ Chemical Oxidation (ISCO) treatment program to remediate the PHC impacts
 treatment program to remediate the PHC impacts.")
19
www.brownfieldstsc.org Background Two Underground Storage Tanks were removed in 1988 – 4,000 gallon unleaded gasoline tank – 2,000 gallon diesel tank Releases of PHC occurred Impacts to soil and groundwater – Investigation performed to delineate impacted area – Develop remedial strategy

20
www.brownfieldstsc.org Warehouse Building Retaining Wall ROW Residential Homes Study Area of UST Petroleum Hydrocarbon Release Former location of 4,000 gallon gasoline UST Former location of 2,000 gallon diesel UST

21
www.brownfieldstsc.org FFD Investigation Delineation of PHC impact zone was still uncertain Specific interval of impacts needed better definition An Investigation was performed w/Fuel Fluorescence Detector (FFD) to carefully isolated PHC impacted interval and lateral extent of PHC impacts FFD detects fluorescence produced by aromatic hydrocarbons when exited by an ultraviolet light source Provides real time data output allowing operator to “see” the testing results in field FFD used to map fuel impacts in study area – 19 FFD pushes – Average depth of push 16 – 17 feet
 to carefully isolated PHC impacted interval and lateral extent of PHC impacts FFD detects fluorescence produced by aromatic hydrocarbons when exited by an ultraviolet light source Provides real time data output allowing operator to see the testing results in field FFD used to map fuel impacts in study area – 19 FFD pushes – Average depth of push 16 – 17 feet")
22
www.brownfieldstsc.org Fuel Fluorescence Detector

23
www.brownfieldstsc.org FFD - 01FFD - 04 Example FFD Logs from Nexus Plastic Investigation PHC Impact Interval Soil Properties

24
www.brownfieldstsc.org FFD Response Area And Soil Sampling: Edges of PHC Impact Area Defined by Soil Sampling & FFD Soil Samples & FFD Match; Confirming Delineation Outer boundary Of Lowest Energy Shell of FFD Model

25
www.brownfieldstsc.org FFD Delineated PHC Soil Impact Area Plume A Plume B Former 4,000 gal Gasoline UST Former 2,000 gal Diesel UST Plume A “hot spot” Plume B “hot spot”

26
www.brownfieldstsc.org Plume A Plume B FFD Logs Zone of PHC Impacts 3D Image of Petroleum Hydrocarbon (PHC) Impacts Soil: Note Two Separate Plumes of PHC Impacts from Two Tanks
 Impacts Soil: Note Two Separate Plumes of PHC Impacts from Two Tanks")
27
www.brownfieldstsc.org PHC Impact Area Collaborative Data Set Used to Establish Treatment Area Combined Soil & Groundwater Results w/FFD Findings Confident that Treatment Area has been defined Two lobes of PHC impacts from the two tanks Treatment Area Lobe 1: 4,000 gallon gasoline tank – Size: 3350 sq ft – Depth Interval: 11-14 ft bls Treatment Area Lobe 2: 2,000 gallon diesel tank – Size: 1100 sq ft – Depth Interval: 8 – 14 ft bls

28
www.brownfieldstsc.org 3350 sq ft 1100 sq ft Treatment Area Plume A Plume B

29
www.brownfieldstsc.org Remediation Option 2 Insitu Chemical Oxidation/Bioaugmentation – Mid-range costs (115k – 160k) based on 1 vs 2 injections – Proven well established technology – Minimal disturbance to the loading area and utilities – Multiple injections maybe necessary to complete the destruction of the PHCs to regulatory limits – Still may need CEA for groundwater impacts – Meet clean up timeframes for bank
 based on 1 vs 2 injections – Proven well established technology – Minimal disturbance to the loading area and utilities – Multiple injections maybe necessary to complete the destruction of the PHCs to regulatory limits – Still may need CEA for groundwater impacts – Meet clean up timeframes for bank")
30
www.brownfieldstsc.org Remedial Option 2 Design Insitu Chemical Oxidation w/Bioaugmentation – One round of oxidizer injection (RegenOx) – Potentially second round of RegenOx/ORC-A bioagumentation injection two months after the first – Soil and groundwater sampling between the two injection events to determine the effectiveness of the first injection and need for second injection
 – Potentially second round of RegenOx/ORC-A bioagumentation injection two months after the first – Soil and groundwater sampling between the two injection events to determine the effectiveness of the first injection and need for second injection")
31
www.brownfieldstsc.org Remedial Option 2 Design(cont.) RegenOx is a product specifically developed to destroy petroleum hydrocarbons through a contact oxidation reaction Destroys PHCs in both soil and groundwater Comparable to Fenton Reagent without exothermic reaction; safe & effective ORC-A is a oxygen releasing compound that provides a long lasting oxygen source to aerobic microbes that degrade PHCs (biological polishing step to support the MNA component of the closure strategy) If second injection needed it will be a combination RegenOx & ORC-A.
 RegenOx is a product specifically developed to destroy petroleum hydrocarbons through a contact oxidation reaction Destroys PHCs in both soil and groundwater Comparable to Fenton Reagent without exothermic reaction; safe & effective ORC-A is a oxygen releasing compound that provides a long lasting oxygen source to aerobic microbes that degrade PHCs (biological polishing step to support the MNA component of the closure strategy) If second injection needed it will be a combination RegenOx & ORC-A.")
32
www.brownfieldstsc.org Remedial Option 2 Design(cont.) Chemicals are mixed on site and injected into the subsurface with direct push equipment Estimate 56 injection points needed to treat the two lobes of PHC impacts Approximately one to weeks to perform one round of the injections NJDEP Permit-by-rule needed to allow the injections: letter application to NJDEP from LSRP
 Chemicals are mixed on site and injected into the subsurface with direct push equipment Estimate 56 injection points needed to treat the two lobes of PHC impacts Approximately one to weeks to perform one round of the injections NJDEP Permit-by-rule needed to allow the injections: letter application to NJDEP from LSRP")
33
www.brownfieldstsc.org Injection Point Pattern Needed to Treat PHCs Injection Point

34
www.brownfieldstsc.org Targeted Injection Interval is the PHC Impact Zone Defined By the 3D Model based on the FFD Results Plume A Plume B Note: Small Component of Plume B PHC Soil Impacts at Deeper Depth Than Main Plume; Influence Design of Injection Pattern Core PHC Impact Area 3D Image conveys the fact that the primary PHC impact interval was thin and that the two Plumes occupied different elevations. The injection intervals needed to be customized to the different thicknesses and elevations.

35
www.brownfieldstsc.org Injection Interval Pattern for the Two Plumes Plume A Injection Interval: 4 feet With the middle of the injection Interval centered on the mid point Elevation of the model PHC Impact zone Plume A Plume A Injection Point: Injection Interval 4 ft From xx to xx ft elevation Plume B Plume B Injection Intervals Vary from 4 ft to 8 ft depending On the thicknesses of PHC soil Impacts. Also target elevation Different than Plume A 8 ft injection Interval to Treat deeper PHC impacts Injection Interval In Situ Chemical Oxidation Injection Interval and Pattern Designed Using 3D Model

36
www.brownfieldstsc.org Mixing Chemical On Site Injection Assembly Injection Nozzle

37
www.brownfieldstsc.org Reactions Occurring as Oxidant Material Comes In Contact With the PHC Impact Interval

Similar presentations


 Solutions for your Leaking Heating Oil Tank.>")


 Zhengzhong Fang (John)>")

>")


 is a buffered source of slow-release oxygen plus inorganic nutrients for accelerated bioremediation of soil, sediment and groundwater environments.>")

 Roxane Fisher and Mark Ferguson.>")
