Download presentation
Presentation is loading. Please wait.

1
Andrea Bertozzi University of California, Los Angeles

2
Two applications Social networks General Big Data Methods Graph clustering techniques Kmeans Spectral clustering Advanced clustering methods - current research Inverse problems

3
Rivalry network among 29 street gangs in Hollenbeck, Los Angeles Tita et al. (2003)
")
4
background rate of violence retaliation strength retaliation duration rivalry intensity self-excitation time since the most recent incident

5
simulated actual Mike Egesdal, Chris Fathauer, Kym Louie, and Jeremy Neuman, Statistical Modeling of Gang Violence in Los Angeles, SIURO 2010.

7
Here k0 is the expected number of retaliations per attack, 1/w is the expected waiting time for retaliation (in days)
")
9
Likelihood function Energy functional

10
Parameters for Los Angeles Hollenbeck including graph network

11
Yves van Gennip et al SIAP 2013 Left: Map of gang territories in the Hollenbeck area of Los Angeles. Right: LAPD FI card data showing average stop location of 748 individuals with social links of who was stopped with whom.

12
Construct a weighted graph with weights: 748 individuals with known gang affiliation recorded in Field Interview Cards in 2009 d(i,j) is the standard Euclidean distance between the average stop locations of individuals i and j. The parameter sigma is one standard deviation larger than the mean distnace between two individuals who have been stopped together. The matrix S(i,j) is the social adjacency matrix with A(i,j) = 1 if i and j were stopped together and zero otherwise.
 is the social adjacency matrix with A(i,j) = 1 if i and j were stopped together and zero otherwise..")
13
Using spectral clustering we group individuals into 31 different clusters. Modeling assumption is that these clusters correspond to social communities among Hollebeck gang members Compare with actual known gang affiliation.

14
Compute V whose columns are the first 31 eignevectors (ordered according to decreasing eigenvalue) of the normalized affinity matrix D -1 W. Here D is the diagonal matrix with the nodes’ degree on the diagonal These eigenvectors are known to solve a relaxation of the normalized cut (Ncut problem) by giving nonbinary approximations to indicator functions for the clusters. We turn them into binary approximations using the k-means algorithm on the rows of V.
 by giving nonbinary approximations to indicator functions for the clusters. We turn them into binary approximations using the k-means algorithm on the rows of V..")
15
Each row corresponds to an individual in the dataset and assigns it a coordinate in R31. K-means iteratively assigns individuals to their nearest centroid and updates the centroids after each step. K-means uses a random initial seeding of centroids, so we average of 10 k-means runs.

16
Is it possible to identify social structures in human behavior from limited observations? How should we choose alpha and S to get the most information out of the data?

17
Purity – percentage of correctly classified individuals. In this case we classify each cluster as the gang in the majority of the cluster. Note that multiple clusters could be assigned to the same gang. Bias in favor of more clusters. Z-Rand score measures correctly identified pairs. Introduce pair counting quantity which is the number of pairs that belong both to the same cluster and to the same gang according to ground truth.

18
Social Spatial

19
Alpha = 0.4

20
Top: The second, third, and fourth eigenvectors of D−1W with S = A and α = 0.4. The axes in the left picture have unit 106 feet (304.8 km) with respect to the same coordinate origin as in Figure 2. The color coding covers different ranges: top left 0 (blue) to 1 (red), top middle −0.103 (blue) to 0.091 (red), top right −0.082 (blue) to 0.072 (red). Bottom: The second, third, and fourth eigenvectors of D−1W with S = n(A + C) and α = 0.4. The color coding covers different ranges: top left −0.082 (blue) to 0.065 (red), top middle −0.091 (blue) to 0.048 (red), top right −0.066 (blue) to 0.115 (red).
 with respect to the same coordinate origin as in Figure 2. The color coding covers different ranges: top left 0 (blue) to 1 (red), top middle −0.103 (blue) to (red), top right −0.082 (blue) to (red). Bottom: The second, third, and fourth eigenvectors of D−1W with S = n(A + C) and α = 0.4. The color coding covers different ranges: top left −0.082 (blue) to (red), top middle −0.091 (blue) to (red), top right −0.066 (blue) to (red)..")
21
p is probability of ground truth vs. Observation data q is false positives to simulate noise. Colors represent different alpha.

22
Joint work with Arjuna Flenner, China Lake Paper MMS 2012

23
In a typical application we have data supported on the graph, possibly high dimensional. The above weights represent comparison of the data. Examples include: voting records of Congress – each person has a vote vector associated with them. Nonlocal means image processing – each pixel has a pixel neighborhood that can be compared with nearby and far away pixels.

24
Buades Coll and Morel (2006)– introduced the NL Means functional for imaging applications – patch comparisons between pixels Osher and Gilboa (2007-8)– developed the Nonlocal TV functional for imaging applications- very effective for image inpainting applications with texture Drawback with Osher-Gilboa is slowness of algorithm We will accomplish these results with much faster run time and extend to general Machine Learning problems Suggests an alternative to the NL means calculus of Gilboa- Osher
– introduced the NL Means functional for imaging applications – patch comparisons between pixels Osher and Gilboa (2007-8)– developed the Nonlocal TV functional for imaging applications- very effective for image inpainting applications with texture Drawback with Osher-Gilboa is slowness of algorithm We will accomplish these results with much faster run time and extend to general Machine Learning problems Suggests an alternative to the NL means calculus of Gilboa- Osher")
25
Bertozzi and Flenner MMS 2012.

27
van Gennip and ALB Adv. Diff. Eq. 2012

28
Joint work with Arjuna Flenner Replaces Laplace operator with a weighted graph Laplacian in the Ginzburg Landau Functional Allows for segmentation using L1- like metrics due to connection with GL Comparison with Hein- Buehler 1-Laplacian 2010.

29
98 th US Congress 1984 Assume knowledge of party affiliation of 5 of the 435 members of the House Infer party affiliation of the remaining 430 members from voting records Gaussian similarity weight matrix for vector of votes (1, 0, -1)
")
30
High dimensional fully connected graph – use Nystrom extension methods for fast computation methods.

31
Schoenlieb and Bertozzi, Comm. Math. Sci. 2011 Basic idea: Project onto Eigenfunctions of the gradient (first variation) operator For the GL functional the operator is the graph Laplacian
 operator For the GL functional the operator is the graph Laplacian.")
32
E. Merkurjev, T. Kostic and A.L. Bertozzi, submitted to SIAM J. Imaging Sci. Instead of minimizating the GL functional Apply MBO scheme involving a simple algorithm alternating the heat equation with thresholding.

33
1) propagation by graph heat equation + forcing term 2) thresholding Simple! And often converges in just a few iterations (e.g. 4 for MNIST dataset)
.")
34
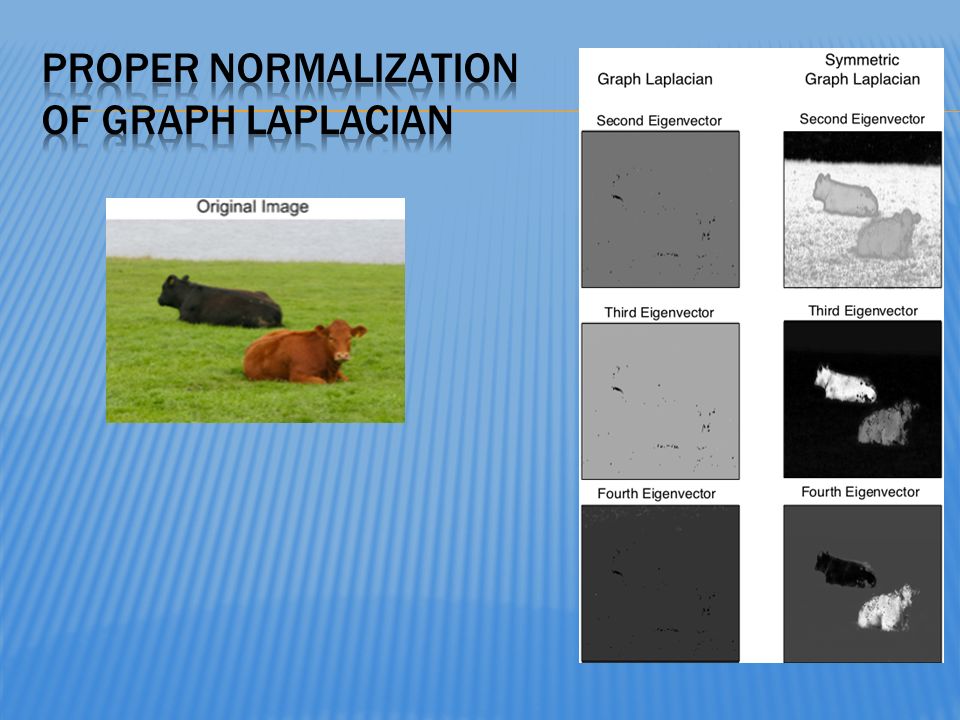
I) Create a graph from the data, choose a weight function and then create the symmetric graph Laplacian. II) Calculate the eigenvectors and eigenvalues of the symmetric graph Laplacian. It is only necessary to calculate a portion of the eigenvectors*. III) Initialize u. IV) Iterate the two-step scheme described above until a stopping criterion is satisfied. *Fast linear algebra routines are necessary – either Raleigh-Chebyshev procedure or Nystrom extension.
 Calculate the eigenvectors and eigenvalues of the symmetric graph Laplacian. It is only necessary to calculate a portion of the eigenvectors*. III) Initialize u. IV) Iterate the two-step scheme described above until a stopping criterion is satisfied. *Fast linear algebra routines are necessary – either Raleigh-Chebyshev procedure or Nystrom extension..")
35
Second eigenvector segmentationOur method’s segmentation

36
Original image 1Original image 2 Handlabeled grass region Grass label transferred

37
Handlabeled sky region Handlabeled cow region Sky label transferred Cow label transferred

39
Original image Damaged imageLocal TV inpainting Nonlocal TV inpainting Our method’s result

40
Local TV inpainting Original image Nonlocal TV inpainting Damaged image Our method’s result

42
Bresson, Laurent, Uminsky, von Brecht (current and former postdocs of our group), NIPS 2012 Relaxed continuous Cheeger cut problem (unsupervised) Ratio of TV term to balance term. Prove convergence of two algorithms based on CS ideas Provides a rigorous connection between graph TV and cut problems.

43
Garcia, Merkurjev, Bertozzi, Percus, Flenner, 2013 Semi-supervised learning Instead of double well we have N-class well with Minima on a simplex in N-dimensions

44
Three moons MBO Scheme 98.5% correct. 5% ground truth used for fidelity. Greyscale image 4% random points for fidelity, perfect classification.

45
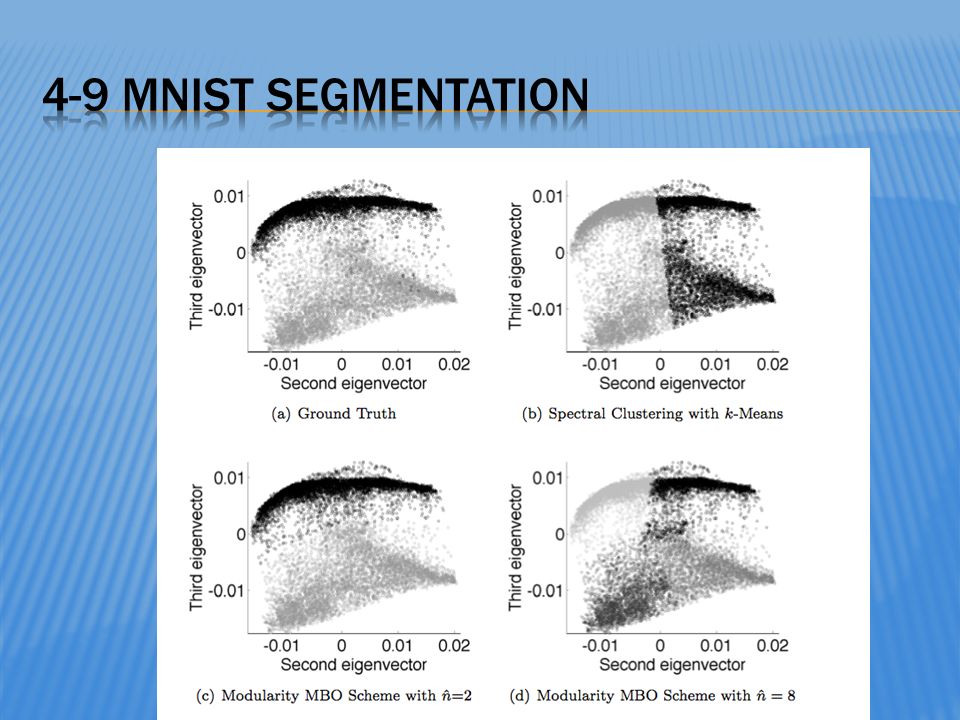
Comparisons Semi-supervised learning Vs Supervised learning We do semi-supervised with only 3.6% of the digits as the Known data. Supervised uses 60000 digits for training and tests on 10000 digits.

48
A METHOD BASED ON TOTAL VARIATION FOR NETWORK MODULARITY OPTIMIZATION USING THE MBO SCHEME Joint work with Huiyi Hu, Thomas Laurent, and Mason Porter, submitted SIAP [w ij ] is graph adjacency matrix P is probability nullmodel (Newman-Girvan) P ij =k i k j /2m k i = sum j w ij (strength of the node) Gamma is the resolution parameter g i is group assignment 2m is total volume of the graph = sum i k i = sum ij w ij This is an optimization (max) problem. Combinatorially complex – optimize over all possible group assignments. Very expensive computationally. Newman, Girvan, Phys. Rev. E 2004.
![A METHOD BASED ON TOTAL VARIATION FOR NETWORK MODULARITY OPTIMIZATION USING THE MBO SCHEME Joint work with Huiyi Hu, Thomas Laurent, and Mason Porter, submitted SIAP [w ij ] is graph adjacency matrix P is probability nullmodel (Newman-Girvan) P ij =k i k j /2m k i = sum j w ij (strength of the node) Gamma is the resolution parameter g i is group assignment 2m is total volume of the graph = sum i k i = sum ij w ij This is an optimization (max) problem.](http://images.slideplayer.com/34/10236860/slides/slide_48.jpg "Combinatorially complex – optimize over all possible group assignments. Very expensive computationally. Newman, Girvan, Phys. Rev. E")
49
Given a subset A of nodes on the graph define Vol(A) = sum i in A k i Then maximizing Q is equivalent to minimizing Given a binary function on the graph f taking values +1, -1 define A to be the set where f=1, we can define:
 = sum i in A k i Then maximizing Q is equivalent to minimizing Given a binary function on the graph f taking values +1, -1 define A to be the set where f=1, we can define:")
50
Thus modularity optimization restricted to two groups is equivalent to This generalizes to n class optimization quite naturally Because the TV minimization problem involves functions with values on the simplex we can directly use the MBO scheme to solve this problem.

52
Lancichinetti, Fortunato, and Radicchi Phys Rev. E 78(4) 2008. Each mode is assigned a degree from a powerlaw distribution with power . Maximum degree is kmax and mean degree by. Community sizes follow a powerlaw distribution with power beta subject to a constraint that the sum of of the community sizes equals the number of nodes N. Each node shares a fraction 1- of edges with nodes in its own community and a fraction with nodes in other communities (mixing parameter). Min and max community sizes are also specified.
. Min and max community sizes are also specified..")
53
Similarity measure for comparing two partitions based on information entropy. NMI = 1 when two partitions are identical and is expected to be zero when they are independent. For an N-node network with two partitions

56
Similar scaling to LFR1K 50,000 nodes Approximately 2000 communities Run times for LFR1K and 50K

57
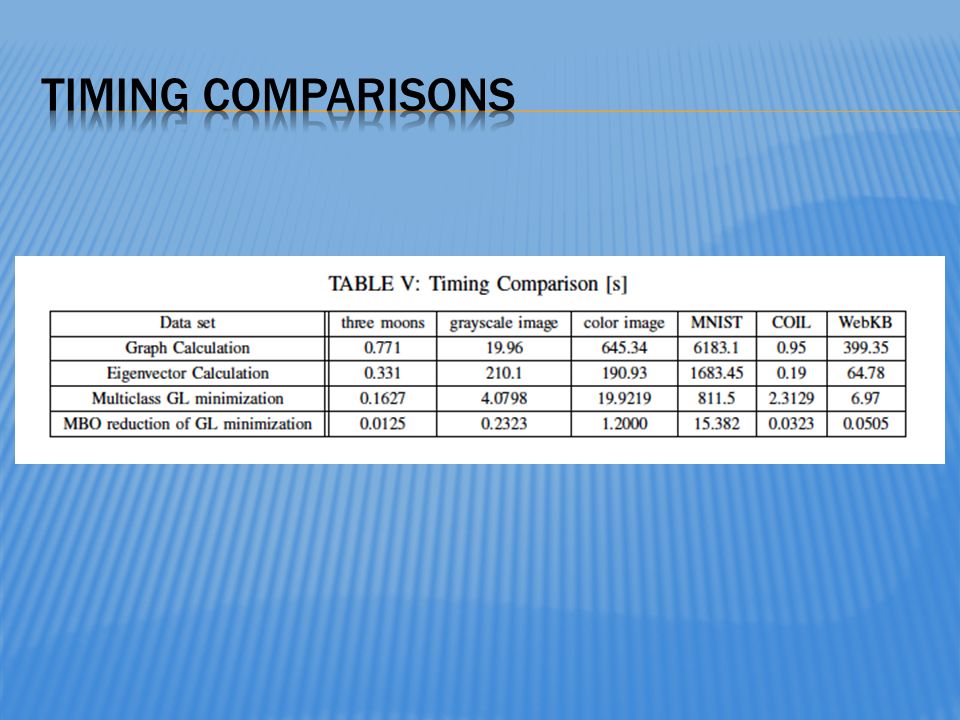
13782 handwritten digits. Graph created based on similarity score between each digit. Weighted graph with 194816 connections. Modularity MBO performs comparably to Genlouvain but in about a tenth the run time. Advantage of MBO based scheme will be for very large datasets with moderate numbers of clusters.

Similar presentations


 edge (u,v) denotes similarity between u and v weighted.>")


 Vipin Kumar Army High Performance.>")


