Download presentation
Presentation is loading. Please wait.

1
1

2
Managing Employee Risk and Controlling Workers' Comp Panelists: Mary Lynn Curran, Willis, Facilitator Caitlin Franklin, Brookdale John R. Anderson, D.O, Concentra David Hobbs, Elmcroft Senior Living Scott Bertulis, Willis 2

3
Panelists John R. Anderson, DO, FACOEM, Senior Vice President, Medical Operations, Concentra Caitlin Franklin, PHR, Director of Safety and Workers Compensation, Brookdale Senior Living David Hobbs, Senior Vice President, Elmcroft Senior Living Scott Bertulis, CSP, ARM, Senior Risk Control Consultant, Willis 3

4
Work Comp What is Workers Compensation Why such significant issue for senior living Alarming trends –Aging Workforce –Obesity Epidemic MMSEA Impact on Claims 4

5
What is workers compensation Legal concept to protect and benefit both employer and employee Employer – no liability, no fault, protection from catastrophic legal judgments Employee – compensation for lost time and medical expenses incurred due to work-related injury or illness Governed by the state; not federal laws Not insurance per se but a defined benefit structure per state Covers employees; not visitors, private caregivers, other providers Covers bodily injury, death or disease diagnosed as arising from an occupational circumstance Lost wages (indemnity payments) replace earnings due to injury or illness. Usually a percentage of the employee’s average weekly wage less a waiting period and at minimum/maximum benefit rates. 5

6
WC Insurers Experience Inflation More Intensely than the Overall CPI Suggests Source: Bureau of Labor Statistics; Insurance Information Institute. Price Level Changes, 2011 vs. 2010 Healthcare Costs Are a Major WC Insurance Cost Driver. They Are Likely to Increase Faster than the CPI for the Next Few Years, at Least 6 Excludes Food and Energy

7
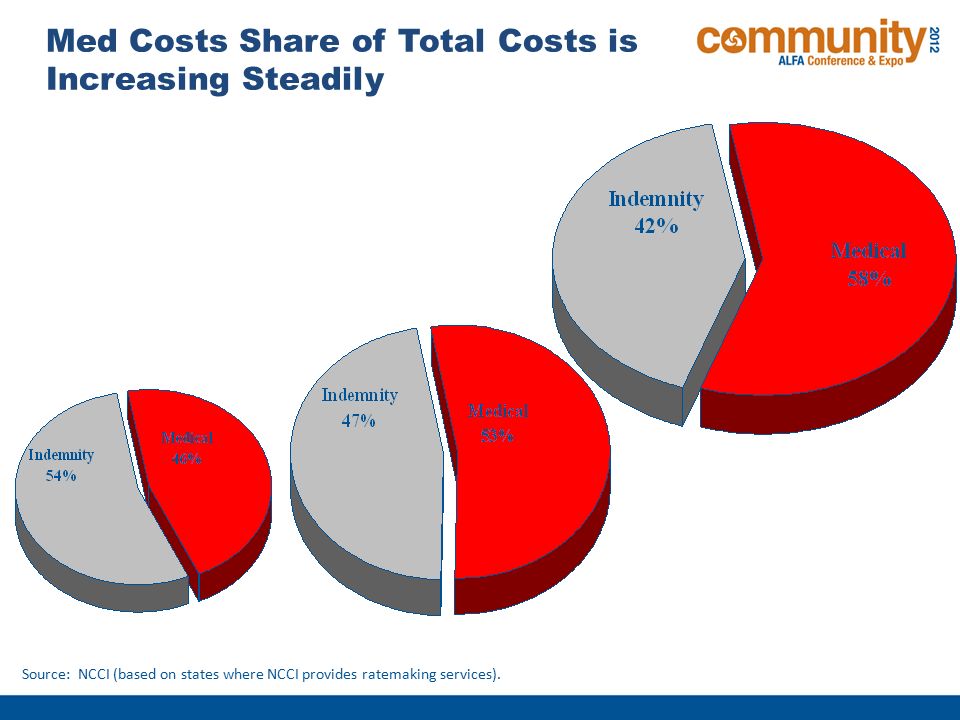
Med Costs Share of Total Costs is Increasing Steadily Source: NCCI (based on states where NCCI provides ratemaking services). 1988 1998 2008
8
WC Med Cost Will Equal 70% of Total by 2018 if Trends Hold Source: Insurance Information Institute. 2018 Estimate This trend will likely be supported by the increased labor force participation of workers age 55 and older.

9
WC Medical Severity Typically Rises Faster Than the Medical CPI Rate Sources: CPI and Med CPI from US Bureau of Labor Statistics, WC med severity from NCCI based on NCCI states. The average annual growth in WC medical severity from 2002 through 2009 was over 6% vs. the medical CPI (about 4%), which itself was higher than the overall CPI
, which itself was higher than the overall CPI.")
10
WC Indemnity Severity Generally Grows Faster than Wages, 1995-2010p 2010p: Preliminary based on data valued as of 12/31/2010; 1991-2009: Based on data through 12/31/2009, developed to ultimate. Based on the states where NCCI provides ratemaking services. Excludes the effects of deductible policies. CPS = Current Population Survey. Source: NCCI WC indemnity severity fell 3% in 2010 even though wages rose by 2% Annual Change 1991–1993:+1.9% Annual Change 1994–2001:+8.9% Annual Change 2002–2009:+6.7%

11
12/01/09 - 9pmeSlide – P6466 – The Financial Crisis and the Future of the P/C 11 U.S. Employment in Health Care & Social Services, Monthly, 1990–2012* *As of January 2012 (Jan 2012 and Dec 2011 are preliminary); Seasonally adjusted Note: Recessions indicated by gray shaded columns. Sources: US Bureau of Labor Statistics; National Bureau of Economic Research (recession dates); Insurance Information Institutes. Millions Employment grew in virtually every month for the last 22 years, unaffected by recessions… Cumulative growth over 22 years: 86.6% …and this growth is expected to continue indefinitely
; Seasonally adjusted Note: Recessions indicated by gray shaded columns. Sources: US Bureau of Labor Statistics; National Bureau of Economic Research (recession dates); Insurance Information Institutes. Millions Employment grew in virtually every month for the last 22 years, unaffected by recessions… Cumulative growth over 22 years: 86.6% …and this growth is expected to continue indefinitely.")
12
12/01/09 - 9pm eSlide – P6466 – The Financial Crisis and the Future of the P/C 12 Occupations with Largest Numerical Growth, 2008–2018: Health, Services Dominate Sources: US Bureau of Labor Statistics: Occupational Outlook Handbook, 2010-2011 Edition; Insurance Information Institute BLS projects we’ll need 1.7 million new health care workers by 2018 over 2008. Also 700,000 truck drivers and construction and landscape workers. Occupations Number of new jobs Percent change Wages (May 2008 median)Education/training category Registered nurses581,50022$62,450Associate degree Home health aides460,9005020,460Short-term on-the-job training Customer service representatives399,5001829,860Moderate-term on-the-job training Combined food preparation and serving workers, including fast food 394,3001516,430Short-term on-the-job training Personal and home care aides375,8004619,180Short-term on-the-job training Retail salespersons374,700820,510Short-term on-the-job training Office clerks, general358,7001225,320Short-term on-the-job training Accountants and auditors279,4002259,430Bachelor's degree Nursing aides, orderlies, and attendants 276,0001923,850Postsecondary vocational award Postsecondary teachers256,9001558,830Doctoral degree Construction laborers255,9002028,520Moderate-term on-the-job training Elementary school teachers, except special education 244,2001649,330Bachelor's degree Truck drivers, heavy and tractor- trailer 232,9001337,270Short-term on-the-job training Landscaping and groundskeeping workers 217,1001823,150Short-term on-the-job training
Education/training category Registered nurses581,50022$62,450Associate degree Home health aides460, ,460Short-term on-the-job training Customer service representatives399, ,860Moderate-term on-the-job training Combined food preparation and serving workers, including fast food 394, ,430Short-term on-the-job training Personal and home care aides375, ,180Short-term on-the-job training Retail salespersons374,700820,510Short-term on-the-job training Office clerks, general358, ,320Short-term on-the-job training Accountants and auditors279, ,430Bachelor s degree Nursing aides, orderlies, and attendants 276, ,850Postsecondary vocational award Postsecondary teachers256, ,830Doctoral degree Construction laborers255, ,520Moderate-term on-the-job training Elementary school teachers, except special education 244, ,330Bachelor s degree Truck drivers, heavy and tractor- trailer 232, ,270Short-term on-the-job training Landscaping and groundskeeping workers 217, ,150Short-term on-the-job training.")
13
The Aging of the Workforce: Looking ahead In 2010, 16.2 million people age 60-64 In 2015, forecasting 14-15 million age 65-69 If historical patterns persist, 5 million of them will be in the labor force in 2015 compared to 3.5 million employed in 2010 In 2010, 12.0 million people age 65-69 In 2015, forecasting 10 million people age 70-74 If historical patterns persist, 2 million of them will be in the labor force in 2015 compared to 1.5 million employed in 2010 13

14
14 Older Workers Are More Likely to Slip When Walking, but Less Likely to Overexert Themselves Source: US Bureau of Labor Statistics, US Department of Labor at http://www.bls.gov/news.release/pdf/osh2.pdf Table 14http://www.bls.gov/news.release/pdf/osh2.pdf Incidence Rate (2010) Source of Injury:
 Source of Injury:")
15
15 Older Workers Lose More Days from Work Due to Injury or Illness Source: US Bureau of Labor Statistics, Nonfatal Occupational Injuries and Illnesses Requiring Days Away From Work, 2010 (Table 10), released November 9, 2011. Median Days Away From Work Age 65+ workers median lost time is 2-3X that of workers age 25-34 There will be more lost time as the workforce ages in the future

16
16 Older Workers Are Much More Likely to Break a Bone *per 10,000 full-time-equivalent workers Source: US Bureau of Labor Statistics, US Department of Labor at http://www.bls.gov/news.release/pdf/osh2.pdf Table 14http://www.bls.gov/news.release/pdf/osh2.pdf Incidence Rate* (2010)
")
17
The Obesity Epidemic 17 In 1994, in no state was the percent of adults who were obese as high as 20%. By 2010, all 50 states had adult obesity rates of 20% or more. In 12 states, 30% of the adults were obese.

18
18 Most Obese Workers File Twice as Many WC Claims as Healthy-Weight Workers Source: Ostbye, T., et al, “Obesity and Workers Compensation,” Archives of Internal Medicine, April 23, 2007. The most obese have twice as many claims and 13 times more lost workdays than healthy weight workers

19
19 WC Medical Claims and Indemnity Costs are 5-10x Higher for the Most Obese Workers Source: Ostbye, T., et al, “Obesity and Workers Compensation,” Archives of Internal Medicine, April 23, 2007. Indemnity costs are 11 times higher for the most obese workers than for healthy-weight workers.

20
20 Additional (to WC) Costs of Obese Workers Source: Finkelstein, E., et al, “The Costs of Obesity in the Workplace,” Journal of Occupational and Environmental Medicine, Volume 52, No. 10 (October 2010), pp. 971-976. The most obese workers cost employers for greater medical care and by being less productive (by being absent more and being less productive when at work. Estimated Per Capita Costs
, pp The most obese workers cost employers for greater medical care and by being less productive (by being absent more and being less productive when at work. Estimated Per Capita Costs.")
21
MMSEA Impact on WC claims Willis estimates MSAs for WC are up anywhere from 150% to 400% from those completed 2 years ago for the same injuries/same type of claims Most of increase in last 2 years id due to CMS calculating lifetime pharmacy needs The pace of the hardening of the wc market will escalate as claim closure rates fall due to inability to settle these cases and the inflated settlement amounts caused by MSAs. Willis estimates that MSAs will increase the overall cost of claims by 8- 12% in the next 3-5 years. Medical inflation is at same rate of 8-12% per year Delays in getting an approved MSA from CMS are costing employers millions each year…both additional indemnity and medical costs 21

22
MMSEA Impact on WC claims Employers have to start developing protocols NOW to deal with employees that will be MSA eligible over the life of their claim. More utilization review: the use of explicit criteria to determine the medial necessity of treatment. Management of PBMs (Pharmacy Benefit Managers): a third party that contracts with pharmacies to negotiate discounts and rebates with drug manufacturers. Settling claims before an MSA is required. 22
: a third party that contracts with pharmacies to negotiate discounts and rebates with drug manufacturers. Settling claims before an MSA is required. 22.")
23
Reluctance to Close-out Future Medical Injured workers are not as willing to close out medical costs. With the increasing costs of prescriptions, workers are fearful of settling the medical portion of the claim. CA, TX, KY are all considered high-cost states High-cost states are estimated to have an ultimate per-claim Rx cost of more than 1.5 times the median estimate Claimant lawyers are now trying to partner with carriers/adjusters to find out ways to bring medical under control so they can get claims settled We’ve even seen plaintiff attorneys pulling workers off a pro- employee doctor back to the employer’s doctor in order to get the treatment stopped. In many jurisdictions, the courts/states are making employers hold open medical longer and preventing the settlement of the medical portion of the claim.

24
Safety and Risk Control WC Pre-Loss Activities Focused Risk Control Activities Safety Program Rollout Focused WC training programs: –Return to Work Program –WC Accident Investigation –Medical Management –Back Injury Prevention –WCIMP Refresher –Resident Handling Safety WC Post-Loss Activities WCIMP (Workers Compensation Injury Management Program) Updates Functional Job Analysis Return to Work Program WC Accountability Program
 Updates Functional Job Analysis Return to Work Program WC Accountability Program")
25
Panelists John R. Anderson, DO, FACOEM, Senior Vice President, Medical Operations, Concentra Caitlin Franklin, PHR, Director of Safety and Workers Compensation, Brookdale Senior Living David Hobbs, Senior Vice President, Elmcroft Senior Living Scott Bertulis, CSP, ARM, Senior Risk Control Consultant, Willis 25

Similar presentations


 2010 7.5%9.5% 20097.8%9.6% Rochester MSA U.S.>")


