Download presentation
Presentation is loading. Please wait.

1
Human Pop Growth

2
Human population growth

3
Human Population Clock: Global birth rate = 6 per second and death rate is 3 per second. Predictions are that, even with slowing growth rates, pop. will double again within 100 years! Of the >7 billion people alive today, ½ live in poverty!

4
This question is difficult to answer. Estimates are usually based on food, but human agriculture limits assumptions on available amounts. Human population growth rate has been growing more than exponentially. What is the carrying capacity of Earth for humans?

6
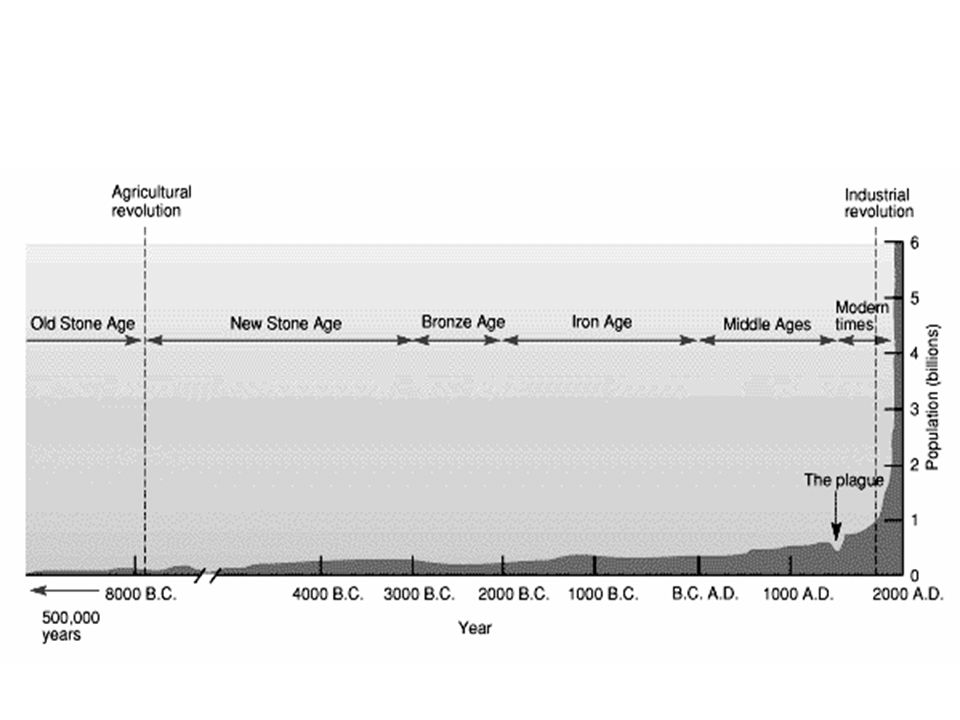
2,000 years ago the population was 150 million 1800 it was 1 billion 1930 it was 2 billion 10,000 generations to reach 2 billion 3 people/second 260 thousand/day 1.8 million/week

7
HUMAN POPULATION GROWTH 1999 1975 domestication of plants, animals 9000 B.C. (about 11,000 years ago) agriculturally based urban societies beginning of industrial, scientific revolutions
 agriculturally based urban societies beginning of industrial, scientific revolutions.")
8
Population Explosion! Green Revolution Medical Advancements Industrial Revolution

9
Green Revolution 1940s – 1960s Advancements in agricultural practices – Pesticides – Irrigation – Synthetic Nitrogen fertilizers Development of high-yield crops like rice, wheat, maize -> allowed food production to keep pace with growing population

10
Medical Advancements Medicine: – Development of penicillin – Cancer treatments – AIDS drugs – Vaccinations Medical knowledge: – Obstetrics -> decreases mortality rate Increased life expectancy, especially in developed nations

11
Increase in growth rate: Expansion of habitat Increased capacity in existing habitats Substituting and importing resources Population has sidestepped limiting factors: Technology (agriculture) Medicine
 Medicine")
12
Population size has limits beyond which even humans can easily control: The availability of food and water Invasion of parasites, pathogens, or disease Over-crowding Severe or sudden climatic changes Pollution of air, soil and water

16
If we do not take steps to control human population growth, it is likely that one or more of these growth- limiting factors will eventually kick in to forcibly reduce our numbers.

17
Earth’s carrying capacity has expanded due to cultural change.

18
Impacts of Continued Growth increased hunger/starvation desertification increased number of refugees increased urbanization dying seas/rivers loss of biodiversity

19
Differing Views Thomas Malthus – human pop growth is not always desirable. If pop increases faster than food supplies, consequences are famine, disease, and war. Birth control should be our biggest priority. Karl Marx – pop growth is a symptom of poverty – we need social justice for all to overcome this. Must eliminate poverty and oppression. Technological optimists – Humans can continue to raise our carrying capacity regardless of pop size – we are intelligent enough to find ways to increase food and shelter.

20
Measuring Population Growth Crude birth rate = the number of births per thousand individuals in a population per year. Crude death rate = the number of deaths per thousand individuals in a population per year. Fertility = the potential of reproduction exhibited in a population.

23
MEDC’s vs. LEDC’s (More Eco. Developed Countries) MEDC: – Industrialized nation with high GDP – Relatively rich and people unlikely to starve – High resource use (per capita) and low population growth rates
 MEDC: – Industrialized nation with high GDP – Relatively rich and people unlikely to starve – High resource use (per capita) and low population growth rates.")
24
(Less Eco. Developed Countries) LEDC: – Less industrialized (some have little industry at all!) – May have raw materials, but tend to be exported out – Lower GDP and higher poverty rates – Poor, low standards of living, high pop. growth rates
 LEDC: – Less industrialized (some have little industry at all!) – May have raw materials, but tend to be exported out – Lower GDP and higher poverty rates – Poor, low standards of living, high pop. growth rates.")
25
Developed Nations Developing Nations

26
Measuring population growth Natural increase rate (r) = the form in which human population growth rates are usually expressed Crude birth rate – crude death rate 10
 = the form in which human population growth rates are usually expressed Crude birth rate – crude death rate 10")
27
Human Population growth = 1.4% per year Developing nations = 1.7% Developed nations = 1.0% Growth rate 19501970199020102030 Year 4.5 3.0 1.5 0 Population (billions) Developing Countries Developed Countries Projections *Add about 84 million people per year at this rate)
 Developing Countries Developed Countries Projections *Add about 84 million people per year at this rate)")
28
The highest growth rates in the world are in the middle East and Sub-Saharan Africa, where social issues and politics keep birth rates extremely high.

30
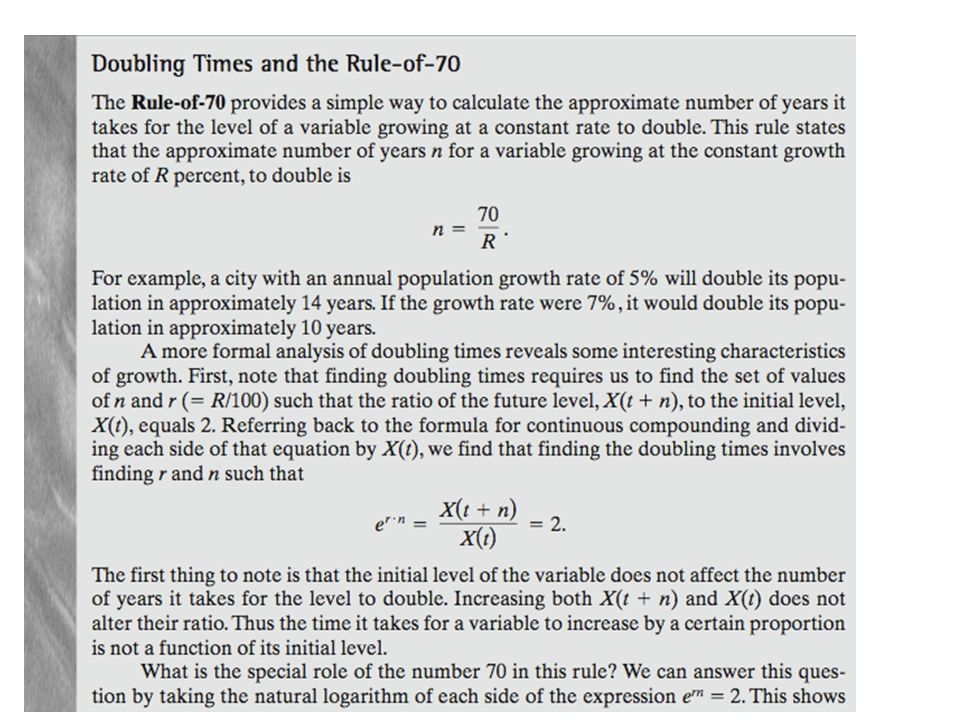
Doubling Time Doubling time (T) = 70. annual percentage rate (g) Doubling time (T) = 70. = 50 years 1.4 Doubling time = the number of years it would take a population to double its size at its current growth rate.

32
Age Sex Pyramids

33
Age/Sex Pyramids Show the proportion of the population (or of each sex) at each age level.
 at each age level.")
34
Demographer usually plot % or # of male and females in the total population in each of three categories: 1.Pre-reproductive (0-14) 2.Reproductive (15-44) 3.Post-reproductive (45 and up) MaleFemale Ages 0-14Ages 15-44Ages 45-85+
 2.Reproductive (15-44) 3.Post-reproductive (45 and up) MaleFemale Ages 0-14Ages 15-44Ages")
35
How does Age Structure Affect Population Growth? Age/Sex Pyramids help demographers determine the potential for future growth of a specific age group as well as that of the total population. The overall shape of the pyramid indicates potential growth. Age structure diagrams not only reveal a population’s growth trends, but can point to future social conditions.

36
MaleFemale U.S. MaleFemale Congo MaleFemale Germany

37
Why would a country’s leaders want to know the proportion of the population in different age groups? What difference does the age of the people in a country make? What kinds of products do young people use? Older people? Is it important for a government leader or planner to know the age of population they are serving?

38
Why do people have large families? High infant and childhood mortality Security in old age (take care of parents) Children are an economic asset in agricultural societies Status of women – social status depends on # of children, particularly boys. Unavailability of contraception
 Children are an economic asset in agricultural societies Status of women – social status depends on # of children, particularly boys. Unavailability of contraception.")
39
Ways to reduce family size: Provide education Improve health (basic hygiene, simple medicines/vaccines) Provide contraception Increase family income Improve resource management – reforestation, soil conservation measures
 Provide contraception Increase family income Improve resource management – reforestation, soil conservation measures")
40
MaleFemale Rapid Growth Guatemala Nigeria Saudi Arabia Ages 0-14Ages 15-44Ages 45-85+ Slow Growth United States Australia Canada MaleFemale

41
Zero Growth Spain Austria Greece MaleFemale Negative Growth Germany Bulgaria Sweden MaleFemale Ages 0-14Ages 15-44Ages 45-85+

42
“Graying Populations” Large segment of population is in Post- Reproductive Age Problems: – Large voter base for elderly will affect younger population – Large number of old people in jobs means less for young people – Collapse of social security? Several countries like Germany, Denmark, Hungary are giving incentives to women to encourage them to have more children.

43
3002001000 200300 85+ 80-85 75-79 70-74 65-69 60-64 55-59 50-54 45-49 40-44 35-39 30-34 25-29 20-24 15-19 10-14 5-9 0-4 MaleFemale Population (millions) Age Developing Countries
 Age Developing Countries")
44
3002001000 200300 85+ 80-85 75-79 70-74 65-69 60-64 55-59 50-54 45-49 40-44 35-39 30-34 25-29 20-24 15-19 10-14 5-9 0-4 MaleFemale Population (millions) Age Developed Countries
 Age Developed Countries")
45
Fig. 46.15, p. 827 CANADAUNITED STATES INDIAAUSTRALIA MEXICOCHINA

46
Age Structure Diagram U.S.

47
Demographic Transition

49
2.5 2.0 1.5 1.0 0.5 0.0 19501960197019801990200020102020203020402050 0 2 4 6 8 10 Growth rate (percent) Population in billions Year Less developed countries More developed countries
 Population in billions Year Less developed countries More developed countries")
50
Why has the world’s population grown at such different rates throughout history ? Natural increase = births – deaths Net migration = immigrants – emigrants Births Deaths Migration

51
What affects birth rates? Fertility Rates Replacement level fertility = # of children a couple needs to produce to replace themselves Total fertility rate = estimate of the average # of children a woman will produce during her childbearing years (15-49 ) * Fertility rates have been dropping in most parts of the world. Ex. Mexico from 7 to 2.5 in 30 years
 * Fertility rates have been dropping in most parts of the world. Ex. Mexico from 7 to 2.5 in 30 years.")
52
Fertility a measure of reproduction the number of children the average woman will have in her lifetime 2.0 vs. 2.1

53
Births per woman < 2 2-2.9 3-3.9 4-4.9 5+ No Data Fertility Rates

54
What affects fertility rates? Importance of children to labor force (esp. in rural families) Urbanization (rural families have more babies than urban) Cost of raising and educating children (expensive in developed countries) Education and employment options for women (More options = less babies) Average age of marriage (younger have more babies) Availability of pension plans (children = only form of pension in developing countries) Availability of legal abortions Availability of birth control Religious beliefs, traditions and culture (more children in Catholic and Muslim families, some cultures there is male pride for large families)
 Urbanization (rural families have more babies than urban) Cost of raising and educating children (expensive in developed countries) Education and employment options for women (More options = less babies) Average age of marriage (younger have more babies) Availability of pension plans (children = only form of pension in developing countries) Availability of legal abortions Availability of birth control Religious beliefs, traditions and culture (more children in Catholic and Muslim families, some cultures there is male pride for large families).")
55
What affects death rates? Higher food supplies Better nutrition Improved medical and health technology Improved sanitation Safer water supplies

56
Indicators of overall health Growth = natural increase – net migration Life expectancy Infant mortality ** = # of infants that die prior to one year of age.

57
Infant deaths per 1,000 live births <10 <10-35 <36-70 <71-100 <100+ Data not available

58
Population (2002) Population projected (2025) Infant mortality rate Life expectancy Fertility rate (TFR) %Population under age 15 % Population over age 65 Per capita GNI PPP (2000) 288 million 174 million 130 million 346 million 219 million 205 million 6.8 33 75 77 years 69 years 52 years 2.1 2.2 5.8 21% 33% 44% 13% 5% 3% $34,100 $7,300 $800 United States (highly developed) Brazil (moderately developed) Nigeria (less developed) © 2004 Brooks/Cole – Thomson Learning
 Population projected (2025) Infant mortality rate Life expectancy Fertility rate (TFR) %Population under age 15 % Population over age 65 Per capita GNI PPP (2000) 288 million 174 million 130 million 346 million 219 million 205 million years 69 years 52 years % 33% 44% 13% 5% 3% $34,100 $7,300 $800 United States (highly developed) Brazil (moderately developed) Nigeria (less developed) © 2004 Brooks/Cole – Thomson Learning")
59
On the whole, birth rates have not increased in the world (but we still have a lot of people having babies). Death rates have decreased dramatically in the last century due to technology and medicine. HIV/AIDS is still having a dramatic effect on the world. – Mostly kills young adults – alters age structure of population – Life expectancy drops to 35 years old – increases # of orphans – Decimates # of available workers in affected countries

60
Growth in the U.S. Natural increase rate is just 0.6%, yet the total growth rate is still high. Thought that we would have a “stable” population by 2050 without immigration -> 800,000 legal immigrants and 500,000 illegal immigrants enter each year. Baby boom = lots of babies born in the 1950s due to the optimism and prosperity at end of World War II.

61
Family Planning Used to determine the desired family size. Birth control methods include: – Abstinence – Avoiding sex during ovulation – Diaphragms and condoms – Birth control pills using hormones – Physical barrier implantations (IUD) – Sterilization – abortion
 – Sterilization – abortion.")
62
Family Size Gov’t control of family size was successful in China – Became concerned when pop neared 1 billion – created policy where families are limited to one child per family. – Communist country where people have little impact on decisions – Incentives for the one-child family include freed education and medical care for child, preferred housing, better pensions.

63
Drawbacks to limiting population growth Women may be pushed to get abortions or undergo sterilizations Many rural families would ignore 1-child rule because they need laborers on farms. Right to have the number of children they desire is oppressed. Disproportionate male to female birth ratios because sons are favored over daughters in Chinese society.

64
Developed Countries 50 40 30 20 10 0 1775 1800 185019001950 2000 2050 Rate per 1,000 people Year Rate of natural increase Crude birth rate Crude death rate Rate of natural increase = crude birth rate – crude death rate © 2004 Brooks/Cole – Thomson Learning

65
Developing Countries 50 40 30 20 10 0 1775 1800 185019001950 2000 2050 Rate per 1,000 people Crude birth rate Rate of natural increase Crude death rate Year © 2004 Brooks/Cole – Thomson Learning

66
How can economic development help reduce birth rates? Demographers have developed a hypothesis known as the DEMOGRAPHIC TRANSITION. It states that as countries become industrialized, first death rates go down and then their birth rates decline. Four factors must be present: 1. children must survive to maturity, 2. standard of living and 3. women social status must be improved, and 4. must have access to birth control and be educated on its use. Many developing countries get trapped entering the “industrial” phase and have constantly increasing populations. These poorer countries need help from developed countries to push into industrial phase.

67
4 stages of Demographic Transition: 1.Pre-industrial: birth rate and death rate are both high = little growth. (high infant mortality, malnutrition, and disease)
.")
68
2. Transitional: death rate falls due to improved living and birth rates stay high = rapid growth. (Better medicine and sanitation decreases DR. BR stays high).
..")
69
3. Industrial: fertility falls and closes gap between birth and death rates = low growth. (More food, better health care, technology and education cause BR to decrease, nearing the DR

70
Low High Relative population size Birth rate and death rate (number per 1,000 per year) 80 70 60 50 40 30 20 10 0 Stage 1 Preindustrial Stage 2 Transitional Stage 3 Industrial Stage 4 Postindustrial Low growth rate Increasing growth rate Very high growth rate Decreasing growth rate Low growth rate Zero growth rate Negative growth rate Birth rate Total population Death rate Time 4. Post-industrial: birth rate falls below death rate = zero growth.

Similar presentations


 G. Tyler Miller’s.>")


 Population size (N) -ideal habitat -maximum reproduction -unlimited resources Increase often.>")


