Download presentation
Presentation is loading. Please wait.

1
Helping you make SMART choices about your money!

2
02/08/16 Preface THE INFORMATION PROVIDED HEREIN IS NOT INTENDED FOR DISTRIBUTION TO THE GENERAL PUBLIC The information provided herein is for general information purposes only and should not be considered as specific investment or tax advice. The information provided is for educational purposes, and individuals should seek the advice of a professional for explanation. In conjunction with any copies of specific slides or pages given to any individual it is required that a copy of the “Important Disclosures Regarding Simulated Strategies” also be given to that individual. It is encouraged that if a client or potential client is interested in receiving a copy of a specific page or slide after it has been discussed it should be provided to them with all the proper disclosures. This book or specific slides or pages should not be given to individuals without any explanation or without a copy of the “Important Disclosures Regarding Simulated Strategies”. There are specific pages marked “For Advisor Use Only” which may not be given to any individuals who are clients or who might potentially become clients. They are included and intended for internal use only.

3
02/08/16 3 Develop a Plan

4
This page intentionally left blank. 02/08/16

5
5 –Will I outlive my money? –Tax Planning –Maximize Retirement –Is my Estate in order? Goals What we do TOGETHER Financial Plan Execute Enjoy Life! – –Diversify – –Rebalance – –Tax Efficiency – –Asset location – –Create a plan – –Set goals What we do For You What YOU DO

6
This page intentionally left blank. 02/08/16

7
7 Diversification does not eliminate the risk of market loss. There is no guarantee investment strategies will be successful. For illustrative purposes only. Create a plan tailored to your personal financial needs. Focus On What You Can Control Create a plan to fit your needs and risk tolerance Diversify broadly Reduce expenses and turnover Minimize taxes Rebalance Buy Low / Sell High China Greece Gold Tax Rates The Dow OilPrices InterestRates “NOISE” Elections

8
This page intentionally left blank. 02/08/16

9
9 Execute the Plan (Based on Long-term Academic Principles)
")
10
02/08/16 FOR ADVISOR USE ONLY STORY: Before you get all starry eyed and blurry let me explain the slide. The different colors are different areas of the market. You have big companies (orange and green), small companies (blues), international companies (blacks and greys), Real estate (brown), Third world countries (purple) and Bonds (green). The years are going across and the winner for that year is on top and the underperformer on the bottom. As you can see there’s no real pattern. If we look closely I like to pick on the late 90’s when 20/20 TV series had the Chimpanzee beating the stock broker as it was that easy back then. Well the orange color was hot in 95/96/97/98 but by the time the media or you pick up on it chances are you would buy it in 97 or 98 which is “buying high” and then you realize second to last place or last place for a number of years and you get frustrated and sell low. Our goal is the opposite. I equate this to a flower garden: Each one of these colors is a different flower. No matter what time of the year you are constantly clipping of some of the flowers, bringing them inside, and enjoying them. And then you go plant something else that’s going to bloom later. So you are constantly clipping flowers off, enjoying the flowers, and other flowers are blooming. This is rebalancing. “Clipping” the asset class while its high and enjoying it, and going out and “planting” a new asset class to enjoy later. Advisor note: looking at the purple color (emerging markets) is a good one to point out as well. It’s extremely volatile and you can point out in 2007 we sold, 2008 we bought, 2009 we sold again, etc….
, small companies (blues), international companies (blacks and greys), Real estate (brown), Third world countries (purple) and Bonds (green). The years are going across and the winner for that year is on top and the underperformer on the bottom. As you can see there’s no real pattern. If we look closely I like to pick on the late 90’s when 20/20 TV series had the Chimpanzee beating the stock broker as it was that easy back then. Well the orange color was hot in 95/96/97/98 but by the time the media or you pick up on it chances are you would buy it in 97 or 98 which is buying high and then you realize second to last place or last place for a number of years and you get frustrated and sell low. Our goal is the opposite. I equate this to a flower garden: Each one of these colors is a different flower. No matter what time of the year you are constantly clipping of some of the flowers, bringing them inside, and enjoying them. And then you go plant something else that’s going to bloom later. So you are constantly clipping flowers off, enjoying the flowers, and other flowers are blooming. This is rebalancing. Clipping the asset class while its high and enjoying it, and going out and planting a new asset class to enjoy later. Advisor note: looking at the purple color (emerging markets) is a good one to point out as well. It’s extremely volatile and you can point out in 2007 we sold, 2008 we bought, 2009 we sold again, etc…..")
11
02/08/16 11 S&P 500 US Large Company Value Stocks US Small Company Growth Stocks US Small Company Value Stocks International Value Stocks International Small Company Stocks Asset Class Returns 1989 – 2015 Emerging Markets Portfolio U.S. Aggregate Bond Source: Dimensional Fund Advisors, Inc. 1989 to 1996 – Simulated Index Performance except for U.S. Aggregate Bond which is Simulated Index Performance for 1989 to Present. 1997 to Present – Actual Fund Performance. Information from sources deemed reliable, but its accuracy cannot be guaranteed. Performance is historical and does not guarantee future results. See Sources and Descriptions of Data at the end of this booklet. REITS Index Can You Pick the Next Winner?

12
02/08/16 FOR ADVISOR USE ONLY STORY: This is a dollar back in 1964 and you can go back to the 1920’s and see similar results. I like to point out the treasury bill or long term bond line in that if a bank was offering a CD that returned 5-7% on average there would be a line a mile long to get in but as you can see over time, once you whack out taxes, it hardly gets ahead of inflation. The power of investing is owning stocks overtime and to own each line but lean towards the faster area (small value). Look at all these great companies as just a small example of what you could own by owning that area. DETAIL: This chart shows the risk/return characteristics of various asset classes. Note the almost perfect correlation between the amount of risk taken and the return received for each of the asset classes over the long term.
. Look at all these great companies as just a small example of what you could own by owning that area. DETAIL: This chart shows the risk/return characteristics of various asset classes. Note the almost perfect correlation between the amount of risk taken and the return received for each of the asset classes over the long term..")
13
02/08/16 13 Log Scale $198 $369 $1,045 $133 $41 $12 $8 Inflation Source: Dimensional Fund Advisors, Inc. Performance is derived from both historical and simulated data and does not guarantee future results. Information from sources deemed reliable and current, but its accuracy cannot be guaranteed. See Sources and Descriptions of Data at the end of this booklet. Growth of $1 Compound Annual Growth 1964 – 2015 Standard Deviation U.S. Small Company Value 14.30%27.95 U.S. Small Company Growth 12.03% 30.27 U.S. Large Company Value 10.70%21.18 U.S. Large Company (S&P 500) Growth 9.86%16.87 Long-Term Bonds 7.38%11.98 Treasury Bills4.91%3.22 Inflation3.99%2.96 Who’s the Long-Term Winner?
 Growth 9.86%16.87 Long-Term Bonds 7.38%11.98 Treasury Bills4.91%3.22 Inflation3.99%2.96 Who’s the Long-Term Winner .")
14
This page intentionally left blank. 02/08/16

15
15 Small Cap Value Share price$ 13.52 Earning per share$ 1.34 Price/earning ratio10 Large Cap Growth Share price$100.72 Earning per share$ 0.28 Price/earning ratio360 Large Cap Growth Share price$596.38 Earning per share$ 0.70 Price/earning ratio854 Source: Morningstar, 1-22-16 Information from sources deemed reliable, but its accuracy cannot be guaranteed. Performance is historical and does not guarantee future results. Price is what you pay. Value is what you get. - Warren Buffet Growth vs. Value Large Cap Value Share price$ 41.06 Earning per share$ 5.40 Price/earning ratio8

16
02/08/16 FOR ADVISOR USE ONLY STORY: We believe in markets, not managers. What would have been your choice in 1980? Would you have gone with the new technology of cell phones and invested in Motorola? Or would you have invested in the company that makes Spam, boring old Spam? Most of us would agree that we would have gone with cell phones at the time. However, since that time, Hormel has outperformed Motorola significantly. We do not claim to know what the next “hot” stock will be because truly no one can really know.

17
02/08/16 17 % Total Return sourced from Morningstar: January 1, 1981 to December 31, 2015 Cell Phones?SPAM? OR Motorola 1,368% (35 Year Return) Hormel Foods 27,177% (35 Year Return) US Large GrowthUS Small Cap What Would Have Been Your Investment Choice in 1980? We Believe in Markets – Not Managers
 Hormel Foods 27,177% (35 Year Return) US Large GrowthUS Small Cap What Would Have Been Your Investment Choice in We Believe in Markets – Not Managers.")
18
02/08/16 FOR ADVISOR USE ONLY STORY: Diversification helps reduce risks that have no expected return, but diversifying within your home market is not enough. Global diversification can broaden your investment universe.

19
02/08/16 19 30 Stocks9,971 Stocks Practice Smart Diversification 271 Stocks Source: Morningstar. 1 Asset Class 10 Asset Classes

20
02/08/16 FOR ADVISOR USE ONLY STORY: When the markets are going up, people tend to be greedy and want to buy. When the market goes down, people get scared and they sell. What we do is keep people from doing this through rebalancing, constantly selling high, buying low, and building wealth.

21
02/08/16 21 Source: behaviorgap.com What Not To Do (What People Do) What To Do (What Our Clients Do) Sell High + Buy Low = Rebalancing The Guide to Wealth
 What To Do (What Our Clients Do) Sell High + Buy Low = Rebalancing The Guide to Wealth")
22
02/08/16 FOR ADVISOR USE ONLY STORY: What are the potential benefits of selling high and buying low. Even though the profits haven’t been significantly higher, when rebalancing there is less variability and downside risk, making the ride smoother for you.

23
02/08/16 23 20 years through December 31, 2015 Annualized Returns (%) Maximum 12-month loss (%) Results for a 60% Stock/40% Bond Portfolio Past 20 years (1996-2015) Source: Past performance is no guarantee of future results. The example above is based on a hypothetical portfolio consisting of 60% S&P 500 Index and 40% Barclays Capital US Aggregate Bond Index. Indexes are not available for the direct investment and reflect an unmanaged universe of securities, which does not take into account advisory or transaction fees, all of which will reduce their overall return. Information from sources deemed reliable and current, but its accuracy cannot be guaranteed. See Sources and Descriptions of Data at the end of this booklet. The rebalanced portfolio was rebalanced to its original 60% stock/40% bond allocation annually during the 20-year period. Maximum loss is based on largest negative return on an annual basis during the 20-year period. Rebalancing alone does not ensure gains or prevent loses from occurring in a portfolio or account. 7.40% 7.56% Without Rebalancing: More variability and downside risk With Rebalancing: Less variability and downside risk Potential Benefits of Selling High/Buying Low

24
02/08/16 FOR ADVISOR USE ONLY STORY: Here’s a representation of the market over about forty years. The three columns represent an investor in 100% bonds, 100% S&P 500, and our 100% diversified stock allocation. As you move along the columns from left to right, you can see that the annualized return increases and there’s not much difference with the standard deviation between the S & P 500 and the diversified solution. Most investors have a lion’s share of their assets in the S&P 500. Our allocation invests your money into all portions of the market, leaning towards value over growth. This enables us to capture returns from all 20,000 stocks, not just the 500 in the S&P, which creates a higher return for you. DETAIL: If you are using this slide be sure to pass out presentation booklets that include “Important Disclosures Regarding Simulated Strategies.”

25
02/08/16 25 FixedS&PAll Stocks Equity 0%100% US Stocks010070 Large Company Growth010015 Large Company Value0020 Small Company Growth0010 Small Company Value0025 International Stocks0030 Large Company Value0014 Small Company Growth004 Small Company Value008 Emerging Markets Growth00 2* Emerging Markets Value00 2* Emerging Markets started in 1988* Fixed Income 100%0% Six Month Treasury Bills10000 Annualized Return (%)5.5311.9113.55 Annual Standard Deviation (%) (Volatility)3.9916.6619.34 Annual Average Return (%)5.6013.2515.36 Growth of $1$9.07$101.00$182.99 Growth of $1,000$9,075$100,998$182,993 Growth of $100,000$907,488$10,099,842$18,299,290 Source: Dimensional Fund Advisors Inc. Performance is derived from both historical simulated data and does not guarantee future results. All material represented is compiled from sources believed to be reliable and current, but accuracy cannot be guaranteed. *Simulations provided for illustration purposes only. Actual portfolios and their historical performance returns will differ for our clients. The investment returns and principal value of mutual funds acquired through our firm will fluctuate and may be worth more or less than their original cost when sold. Actual portfolios will be determined based on individual client needs and independent allocation modeling. All portfolios assume deferred taxes, reinvestment of dividends and capital gains, and annual rebalancing. Portfolios do not reflect investment advisory fees or investor’s trading costs. (Fees and costs will affect subsequent performance.) Asset class data include simulated and live returns. For portfolio construction, simulated data is used prior to the inception of the live portfolios. Simulated data does not reflect deductions of fund expenses that a client would pay. Nor do simulated returns represent results of actual trading. See Sources and Descriptions of Data to identify which periods are simulated and which periods contain live data for each data series. Portfolio returns do not reflect the deduction of investment advisory fees. Simulated Strategies - Value Tilt, 1975 - 2015 Personalized Investment Strategies Reflect Your Investment Policy
 Asset class data include simulated and live returns. For portfolio construction, simulated data is used prior to the inception of the live portfolios. Simulated data does not reflect deductions of fund expenses that a client would pay. Nor do simulated returns represent results of actual trading. See Sources and Descriptions of Data to identify which periods are simulated and which periods contain live data for each data series. Portfolio returns do not reflect the deduction of investment advisory fees. Simulated Strategies - Value Tilt, Personalized Investment Strategies Reflect Your Investment Policy.")
26
02/08/16 FOR ADVISOR USE ONLY STORY: Before you get starry eyed on this slide let me explain it. This is showing returns for 30+ years. I don’t care how old people are we all have a 30+ year horizon. If I’m 65 then I have one of these. If I’m 35 then I may have two of these. Let’s look at the top line of 100% stocks. You can see the decline that can and will happen of a -44%. (try to equate this in dollars such as if they have $100,000 to invest then say it could go down to $56,000 in one year). Will you be able to ride out the bad times and stick with it? Have you ever gotten uneasy on an airplane ride and needed some Dramamine to help smooth out the ride? It didn’t make the ride go any quicker, but it did help smooth out the ride. This is very similar to what fixed income (bonds) will do for your portfolio. Adding fixed income to a portfolio decreases how much your portfolio will go down in the short-term. However, the cost of this is seen in long term growth, which is less the more fixed income you add. Although, there is the consequence for adding the fixed income, if you need the “Dramamine” so you don’t sell at a bad time, then it is worth it but unfortunately there is a cost and that’s what the right side of this graph shows…. SPECIAL NOTE: Extremely important slide to work with the client and understand the risk tolerance. It is recommended to walk the client through our online risk tolerance questionnaire to gage the client on the allocation that bests fits them. Even with this knowledge the downside is much more painful then the upside so we have to be aware of that with clients so we need to make sure to go over the worst single year decline and watch the client’s eyes.
. Will you be able to ride out the bad times and stick with it. Have you ever gotten uneasy on an airplane ride and needed some Dramamine to help smooth out the ride. It didn’t make the ride go any quicker, but it did help smooth out the ride. This is very similar to what fixed income (bonds) will do for your portfolio. Adding fixed income to a portfolio decreases how much your portfolio will go down in the short-term. However, the cost of this is seen in long term growth, which is less the more fixed income you add. Although, there is the consequence for adding the fixed income, if you need the Dramamine so you don’t sell at a bad time, then it is worth it but unfortunately there is a cost and that’s what the right side of this graph shows…. SPECIAL NOTE: Extremely important slide to work with the client and understand the risk tolerance. It is recommended to walk the client through our online risk tolerance questionnaire to gage the client on the allocation that bests fits them. Even with this knowledge the downside is much more painful then the upside so we have to be aware of that with clients so we need to make sure to go over the worst single year decline and watch the client’s eyes..")
27
02/08/16 27 Portfolio to Fit Your Goals Returns Data Worst & Best For Various Investment Policy Allocations Based on data from 1978 – 2015 (38 years) Source: Dimensional Fund Advisors, Inc. Information from sources deemed reliable, but its accuracy cannot be guaranteed. Performance is derived from both historical and simulated data and does not guarantee future results. See Sources and Descriptions of Data at the end of this booklet.

28
02/08/16 FOR ADVISOR USE ONLY STORY: We need to own stocks in our lives no matter what age due to us living longer. The probability of us not outliving our money goes up as we increase the allocation to stocks. DETAIL: Morningstar ran simulations to find out what the probability of your portfolio lasting through a 25-year retirement is. As you move right on the chart, you see that the more allocated to equity you are, the more likely it is that your money will last.

29
02/08/16 29 Probability of Meeting Your Retirement Income Needs IMPORTANT: Data generated by Morningstar regarding the likelihood of various investment outcomes using the Ibbotson Wealth Forecasting Engine are hypothetical in nature, do not reflect actual investment results, and are not guarantees of future results. Results may vary over time and with each simulation. This is for illustrative purposes only and not indicative of any investment. An investment cannot be made directly in an index. © 2013 Morningstar, Inc. 6/30/2014 84% 28% 3% 0% 97% 69% 26% 4% 0% 95% 79% 54% 29% 12% 92% 79% 63% 46% 29% 87% 77% 65% 52% 40% 4% 5% 6% 7% 8% 100% Bonds 75% B 25% S 50% B 50% S 25% B 75% S 100% Stocks Various withdrawal rates and portfolio allocations over a 25-year retirement Less likelyMore likely Annual Withdrawal Rate

30
This page intentionally left blank. 02/08/16

31
31 Fees to Serve You The following fees are charged quarterly based upon the value of the client’s account: Account BalanceAnnual Fee $0 to $49,9991.75% $50,000 to $199,9991.50% $200,000 to $499,9991.25% $500,000 to $999,9991.00% $1,000,000 to $1,999,999.90% $2,000,000 to $2,999,999.80% $3,000,000 to $3,999,999.70% $4,000,000 to $4,999,999.60% $5,000,000 or more.50% *Family and group discounts are available.

32
This page intentionally left blank. 02/08/16

33
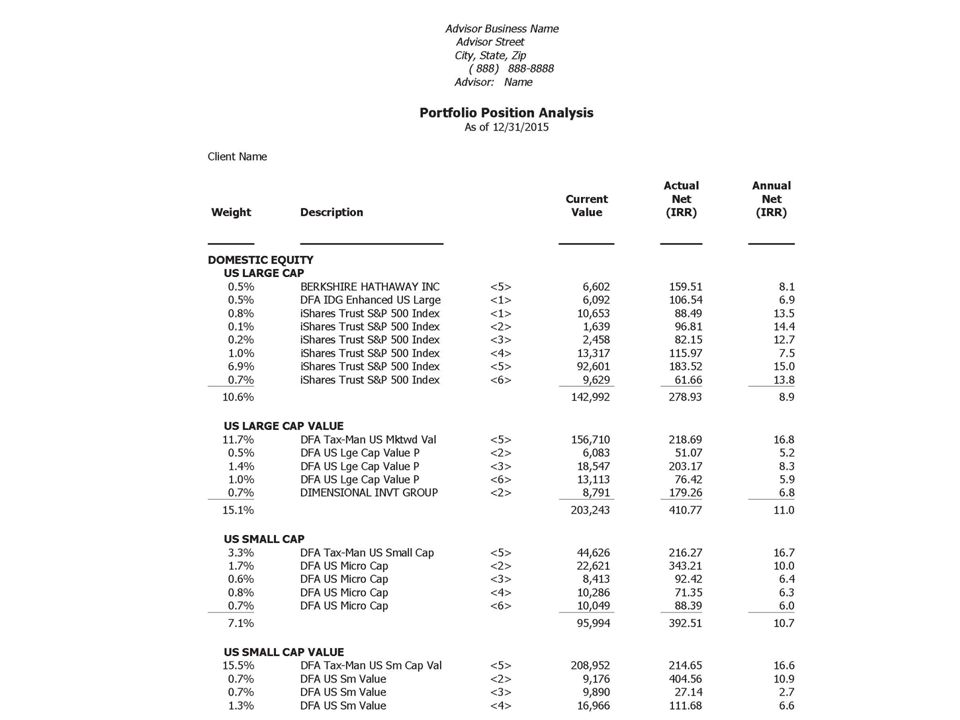
33 Quarterly Statement

34
This page intentionally left blank. 02/06/15

46
This page intentionally left blank. 02/06/15

47
02/08/16 47 Sources and Disclosures “Honesty is the first chapter in the book of wisdom.” – Thomas Jefferson

48
02/08/16 48 Our investment strategy is based on the principles of Modern Portfolio Theory (MPT). The tenets of MPT provide for a passive long-term buy-and-hold strategy implemented through globally diversified portfolios. Mutual funds representing asset classes where academic research has demonstrated higher expected returns for the level of risk taken are combined in a single portfolio. Portfolios are constructed in a manner to provide diversification for the purpose of reducing the risk caused by volatility. Portfolios are rebalanced to maintain agreed upon asset allocations. Historical performance information is provided to demonstrate the methodology used in building portfolios using the aforementioned investment strategy. This information should not be considered as a demonstration of actual performance results, and should not be interpreted as such. The results are based on back-tested data and not actual accounts. The back-tested data used in creating the simulated strategies includes simulated data where live funds were not in existence to provide actual returns. The simulated data was developed in the belief that it represents the historic performance of the live funds. Live funds will differ from simulated strategies. Simulated data does not reflect deductions of fund expenses that an investor would pay and does not represent results of actual trading. Live funds may exclude securities with characteristics not otherwise excluded in certain databases used in some simulated strategies. Sources and Descriptions of Data (following these disclosures) is an integral part of and should be read in conjunction with this explanation. Back-tested data does not represent the impact that material economic and market factors might have on an investment advisor’s decision-making process if the advisor were actually advising an investor. The back-testing of performance differs from actual account performance because an investment strategy may be adjusted at any time, for any reason and can continue to be changed until desired or better performance results are achieved. The back- tested results assume ordinary and capital gains and dividends are reinvested, regular rebalancing and no income taxes. Information about advisor fees and expenses is available upon request. Important Disclosures Regarding Simulated Strategies
 is an integral part of and should be read in conjunction with this explanation. Back-tested data does not represent the impact that material economic and market factors might have on an investment advisor’s decision-making process if the advisor were actually advising an investor. The back-testing of performance differs from actual account performance because an investment strategy may be adjusted at any time, for any reason and can continue to be changed until desired or better performance results are achieved. The back- tested results assume ordinary and capital gains and dividends are reinvested, regular rebalancing and no income taxes. Information about advisor fees and expenses is available upon request. Important Disclosures Regarding Simulated Strategies.")
49
02/08/16 49 Sources and Descriptions of Data Sources and Descriptions of Data supplied by Dimensional Fund Advisors, Inc. Information from sources deemed reliable but its accuracy cannot be guaranteed.

50
02/08/16 50 Sources and Descriptions of Data Sources and Descriptions of Data supplied by Dimensional Fund Advisors, Inc. Information from sources deemed reliable but its accuracy cannot be guaranteed.

51
02/08/16 51 Sources and Descriptions of Data Sources and Descriptions of Data supplied by Dimensional Fund Advisors, Inc. Information from sources deemed reliable but its accuracy cannot be guaranteed.

52
02/08/16 52 Sources and Descriptions of Data Sources and Descriptions of Data supplied by Dimensional Fund Advisors, Inc. Information from sources deemed reliable but its accuracy cannot be guaranteed.

53
02/08/16 53 Sources and Descriptions of Data Sources and Descriptions of Data supplied by Dimensional Fund Advisors, Inc. Information from sources deemed reliable but its accuracy cannot be guaranteed.

54
02/08/16 54 Sources and Descriptions of Data Sources and Descriptions of Data supplied by Dimensional Fund Advisors, Inc. Information from sources deemed reliable but its accuracy cannot be guaranteed.

55
02/08/16 55 Performance data shown represents past performance. Past performance is no guarantee of future results and current performance may be higher or lower than the performance shown. The investment return and principal value of an investment will fluctuate so that an investor’s shares, when redeemed, may be worth more or less than their original cost. To obtain performance data current to the most recent month-end access our website at www.dimensional.com. Average annual total returns include reinvestment of dividends and capital gains. DFA is an investment advisor registered with the SEC. Consider the investment objectives, risks, and charges and expenses of the Dimensional funds carefully before investing. For this and other information about the Dimensional funds, please read the prospectus carefully before investing. Prospectuses are available by calling Dimensional Fund Advisors at (512) 306-7400; on the Internet at https://us.dimensional.com/other/prospectuses Mutual funds distributed by DFA Securities LLC. https://us.dimensional.com/other/prospectuses Prior to April 1, 2002, the following reimbursement fees may have been charged to purchasers of the respective portfolios: International Small Company Portfolio 0.675%; Continental Small Company Portfolio 1.00%; Japanese Small Company Portfolio 0.50%; Pacific Rim Small Company Portfolio 1.00%; International Small Cap Value Portfolio 0.675%; Emerging Markets Small Cap Portfolio 1.00%; Emerging Markets Value Portfolio 0.50%; Emerging Markets Portfolio 0.50%. Prior to April 1998, the reimbursement fee for the International Small Company Portfolio was 0.70% and the reimbursement fee for the International Small Cap Value Portfolio was 0.70%. Prior to July 1995, the reimbursement fees were as follows: International Small Cap Value Portfolio 1.00%; Continental Small Company Portfolio 1.50%; Japanese Small Company Portfolio 1.00%; Pacific Rim Small Company Portfolio 1.50%; UK Small Company Portfolio 1.50%; Emerging Markets Portfolio 1.50%. Returns for these portfolios are presented net of these reimbursement fees. All reimbursement fees are based on the net asset value of the shares purchased. The standardized returns presented reflect deduction, where applicable, of the reimbursement fees for the portfolios. Non-standardized performance data reported by Dimensional Fund Advisors Inc. does not reflect deduction of the reimbursement fee. If reflected, the fee would reduce the performance quoted. Principal Risks The principal risks of investing in the Dimensional funds may include one or more of the following: market risk, small companies risk, risk of concentrating in the real estate industry, foreign securities and currencies risk, emerging markets risk, banking concentration risk, interest rate risk, risk of investing for inflation protection, risk of municipal securities, and/or fund of funds risk. To more fully understand the risks related to an investment in the funds, investors should carefully read each fund's prospectus. Investments in foreign issuers are subject to certain considerations that are not associated with investments in US public companies. Investments of the International Equity, Emerging Markets Equity and the Global Fixed Income Portfolios will be denominated in foreign currencies. Changes in the relative values of these foreign currencies and the US dollar, therefore, will affect the value of investments in the Portfolios. However, the Global Fixed Income Portfolios will utilize forward currency contracts to minimize these changes. Further, foreign issuers are not generally subject to uniform accounting, auditing, and financial reporting standards comparable to those of US public corporations and there may be less publicly available information about such companies than comparable US companies. Also, legal, political, or diplomatic actions of foreign governments, including expropriation, confiscatory taxation, and limitations on the removal of securities, property, or other assets of the Portfolios, could adversely affect the value of the assets of these Portfolios. Securities of small companies are often less liquid than those of large companies. As a result, small company stock and the funds which invest in them may fluctuate relatively more in price. Although securities of larger firms fluctuate relatively less, economic, political and issuer specific events will cause the value of all securities and the funds which invest in them to fluctuate as well. Additionally, DFA Real Estate Securities Portfolio is concentrated in the real estate industry. The Portfolio's exclusive focus on the real estate industry may cause its risk to approximate the general risks of direct real estate ownership. Its performance may be materially different from the broad US equity market. Fixed Income Portfolios: The net asset value of a fund that invests in fixed income securities will fluctuate when interest rates rise. An investor can lose principal value investing in a fixed income fund during a rising interest rate environment. Risk of Banking Concentration Focus on the banking industry would link the performance of the DFA One-Year Fixed Income and/or the Two-Year Global Fixed Income Portfolios to changes in performance of the banking industry generally. For example, a change in the market's perception of the riskiness of banks compared to non-banks would cause the Portfolio's values to fluctuate. Inflation Protected Securities Portfolio: Inflation –protected securities are expected to be protected from long-term inflationary trends, short-term increases in inflation may lead to a decline in the Portfolio’s value. If interest rates rise due to reasons other than inflation, the Portfolio’s investment in these securities may not be protected to the extent that the increase is not reflected in the securities’ inflation measures. The Portfolio may also suffer a loss during periods of sustained deflation. Short Term Muni Bond Portfolio: Municipal Bonds may be subject to income risk, which is the risk that falling interest rates will cause the Portfolio's income to decline, and interest rate risk, which is the risk that bond prices overall will decline over short or even long periods because of rising interest rates. The Portfolio may also be affected by: call risk, which is the risk that during periods of falling interest rates, a bond issuer will call or repay a higher-yielding bond before its maturity date; credit risk, which is the risk that a bond issuer will fail to pay interest and principal in a timely manner; and tax liability risk, which is the risk of noncompliant conduct by a bond issuer, resulting in distributions by the Portfolio being taxable to share-holders as ordinary income. Finally, there is legislative or regulatory risk, which is the risk that new federal or state legislation may adversely affect the tax-exempt status of securities held by the Portfolio, or that there could be an adverse interpretation by the Internal Revenue Service or by state tax authorities. DFA Standardized Performance Data and Disclosures
 ; on the Internet at Mutual funds distributed by DFA Securities LLC. Prior to April 1, 2002, the following reimbursement fees may have been charged to purchasers of the respective portfolios: International Small Company Portfolio 0.675%; Continental Small Company Portfolio 1.00%; Japanese Small Company Portfolio 0.50%; Pacific Rim Small Company Portfolio 1.00%; International Small Cap Value Portfolio 0.675%; Emerging Markets Small Cap Portfolio 1.00%; Emerging Markets Value Portfolio 0.50%; Emerging Markets Portfolio 0.50%. Prior to April 1998, the reimbursement fee for the International Small Company Portfolio was 0.70% and the reimbursement fee for the International Small Cap Value Portfolio was 0.70%. Prior to July 1995, the reimbursement fees were as follows: International Small Cap Value Portfolio 1.00%; Continental Small Company Portfolio 1.50%; Japanese Small Company Portfolio 1.00%; Pacific Rim Small Company Portfolio 1.50%; UK Small Company Portfolio 1.50%; Emerging Markets Portfolio 1.50%. Returns for these portfolios are presented net of these reimbursement fees. All reimbursement fees are based on the net asset value of the shares purchased. The standardized returns presented reflect deduction, where applicable, of the reimbursement fees for the portfolios. Non-standardized performance data reported by Dimensional Fund Advisors Inc. does not reflect deduction of the reimbursement fee. If reflected, the fee would reduce the performance quoted. Principal Risks The principal risks of investing in the Dimensional funds may include one or more of the following: market risk, small companies risk, risk of concentrating in the real estate industry, foreign securities and currencies risk, emerging markets risk, banking concentration risk, interest rate risk, risk of investing for inflation protection, risk of municipal securities, and/or fund of funds risk. To more fully understand the risks related to an investment in the funds, investors should carefully read each fund s prospectus. Investments in foreign issuers are subject to certain considerations that are not associated with investments in US public companies. Investments of the International Equity, Emerging Markets Equity and the Global Fixed Income Portfolios will be denominated in foreign currencies. Changes in the relative values of these foreign currencies and the US dollar, therefore, will affect the value of investments in the Portfolios. However, the Global Fixed Income Portfolios will utilize forward currency contracts to minimize these changes. Further, foreign issuers are not generally subject to uniform accounting, auditing, and financial reporting standards comparable to those of US public corporations and there may be less publicly available information about such companies than comparable US companies. Also, legal, political, or diplomatic actions of foreign governments, including expropriation, confiscatory taxation, and limitations on the removal of securities, property, or other assets of the Portfolios, could adversely affect the value of the assets of these Portfolios. Securities of small companies are often less liquid than those of large companies. As a result, small company stock and the funds which invest in them may fluctuate relatively more in price. Although securities of larger firms fluctuate relatively less, economic, political and issuer specific events will cause the value of all securities and the funds which invest in them to fluctuate as well. Additionally, DFA Real Estate Securities Portfolio is concentrated in the real estate industry. The Portfolio s exclusive focus on the real estate industry may cause its risk to approximate the general risks of direct real estate ownership. Its performance may be materially different from the broad US equity market. Fixed Income Portfolios: The net asset value of a fund that invests in fixed income securities will fluctuate when interest rates rise. An investor can lose principal value investing in a fixed income fund during a rising interest rate environment. Risk of Banking Concentration Focus on the banking industry would link the performance of the DFA One-Year Fixed Income and/or the Two-Year Global Fixed Income Portfolios to changes in performance of the banking industry generally. For example, a change in the market s perception of the riskiness of banks compared to non-banks would cause the Portfolio s values to fluctuate. Inflation Protected Securities Portfolio: Inflation –protected securities are expected to be protected from long-term inflationary trends, short-term increases in inflation may lead to a decline in the Portfolio’s value. If interest rates rise due to reasons other than inflation, the Portfolio’s investment in these securities may not be protected to the extent that the increase is not reflected in the securities’ inflation measures. The Portfolio may also suffer a loss during periods of sustained deflation. Short Term Muni Bond Portfolio: Municipal Bonds may be subject to income risk, which is the risk that falling interest rates will cause the Portfolio s income to decline, and interest rate risk, which is the risk that bond prices overall will decline over short or even long periods because of rising interest rates. The Portfolio may also be affected by: call risk, which is the risk that during periods of falling interest rates, a bond issuer will call or repay a higher-yielding bond before its maturity date; credit risk, which is the risk that a bond issuer will fail to pay interest and principal in a timely manner; and tax liability risk, which is the risk of noncompliant conduct by a bond issuer, resulting in distributions by the Portfolio being taxable to share-holders as ordinary income. Finally, there is legislative or regulatory risk, which is the risk that new federal or state legislation may adversely affect the tax-exempt status of securities held by the Portfolio, or that there could be an adverse interpretation by the Internal Revenue Service or by state tax authorities. DFA Standardized Performance Data and Disclosures.")
56
02/08/16 56 Fund of Funds Risk (Global Equity, Global 60/40, Global 25/75 Portfolios) The investment performance of each Portfolio is affected by the investment performance of the Underlying Funds in which the Portfolio invests. The ability of a Portfolio to achieve its investment objective depends on the ability of the Underlying Funds to meet their investment objectives and on the Advisor's decisions regarding the allocation of the Portfolio's assets among the Underlying Funds. There can be no assurance that the investment objective of any Portfolio or Underlying Fund will be achieved. Through their investments in the Underlying Funds, the Portfolios are subject to the risks of the Underlying Funds investments. The risks of the Underlying Funds may include Market Risk, Small Company Risk, Risks of Concentrating in the Real Estate Industry, Emerging Markets Risk, Interest Rate Risk, Credit Risk, and Risks of Banking Concentration. Definitions of Statistical Terms Average Returns (arithmetic mean) is a measure of the “middle performance” of the fund, computed by adding up all the returns and dividing by the number of periods. Standard Deviation measures how different the actual fund returns are from its average performance (see above). The closer the actual returns are to the average, the smaller the standard deviation. Standard deviation is a measure of volatility, generally associated with the risk of investments. Correlation measures the degree to which the performance of two funds moves in tandem, and the direction of their association (one goes up, the other goes up as well – positive correlation). Correlation plays an important part in diversification. Auto-correlation is a specific application of correlation (see above). In this case, the comparison is not between two different funds, but rather returns of the same fund between different periods. For example, an auto-correlation of two periods would show the correlation in returns two periods apart (March-January, April-February, May-March, etc). Covariance measures the trend of common movement in returns between two funds. A positive covariance shows the fund’s returns moving in the same direction, whereas a negative covariance shows the funds moving in opposite direction (when one goes up, the other one goes down). Covariance plays a role in determining portfolio volatility. Regression analysis examines the statistical connection between a variable of interest and one or more factors used to explain its variation. For example, if the variable of interest is student test scores, regression could be used to show the connection to factors such as time spent studying or IQ. R-squared is used in regression analysis to determine to what degree the variation in the changing series of interest is explained by the factors used to explain it. R-squared ranges from 0 (no explanatory power), to 1 (virtually all variation is explained by the analysis). In the example above, if test scores is the variable of interest, while IQ and study time are the factors used to explain it, then an R-squared of.9 would indicate that 90% of the variation in test scores can be explained by these two factors. Standard Error is a measure of precision when calculating various statistical terms. Generally, the higher the standard error, the lower the statistical strength of that estimation. T-statistic examines the statistical precision of various estimations by comparing the value of the calculation to the standard error (see above). Generally, a t-stat value of 2 or higher shows enough statistical precision to have confidence in the estimate being different from zero. Turnover is a measure of the fund's trading activity, and loosely represents the portion of a fund's holdings that have changed over a year. A lower turnover ratio indicates a more passive strategy. Tracking Error shows how different are each period’s returns of a given fund from the returns of a reference “benchmark” (generally commercial indexes). For example, if fund A’s returns in two subsequent periods are 10% and 20%, while the benchmark’s returns are 5% and 25% for the same periods, the average is the same (15%), but there is tracking error since there was a difference in period by period returns (period 1: 10% versus 5%, period 2: 20% versus 25%). Alpha measures the difference between the fund’s average performance and what would be expected based its compensating risk level, such as beta (see below). For example, if the fund’s average return was 10%, but the expectation based on its beta was 9%, then the alpha would show as 1%. Beta measures the degree to which the returns of a fund change with the market movements. Generally, the higher the scale of fund movements (up or down) relative to the market, the greater the beta. This is considered to be compensating risk for investors, i.e. the more risk (higher beta), the higher the investors’ expected returns versus the market. Three Factor Model explains the source of performance variation among investment portfolios, and it is an extension of previous Nobel Prize winning work. The model specifies that differences in portfolio returns can be attributed to (1) stocks/fixed income mix – riskier stocks have a higher potential return, (2) market capitalization of portfolio – smaller capitalization stocks are riskier and therefore have higher expected returns, and (3) market price relative to accounting measures of the firm, such as book value – stocks with higher book value to market ratios are riskier and have higher expected returns. This model was first published in major academic journals but has gained wide spread acceptance among investment professionals. SMB stands for Small Minus Big, and shows the difference in performance between the returns of small cap stocks and large cap stocks, and it is one of the factors used in the model described above. When used in regression analysis its computed coefficient (s) illustrates to what degree the portfolio captures the returns of small cap or large cap stocks. HML stands for High Book-to-Market (BtM) Minus Low Book-to-Market (BtM), and shows the difference in performance between the stocks with high BtM ratios (value stocks) and stocks with low BtM ratios (growth stocks), and it is one of the factors used in the model described above. When used in regression analysis its computed coefficient (h) illustrates to what degree the portfolio captures the returns value or growth stocks. DFA Standardized Performance Data and Disclosures
 is a measure of the middle performance of the fund, computed by adding up all the returns and dividing by the number of periods. Standard Deviation measures how different the actual fund returns are from its average performance (see above). The closer the actual returns are to the average, the smaller the standard deviation. Standard deviation is a measure of volatility, generally associated with the risk of investments. Correlation measures the degree to which the performance of two funds moves in tandem, and the direction of their association (one goes up, the other goes up as well – positive correlation). Correlation plays an important part in diversification. Auto-correlation is a specific application of correlation (see above). In this case, the comparison is not between two different funds, but rather returns of the same fund between different periods. For example, an auto-correlation of two periods would show the correlation in returns two periods apart (March-January, April-February, May-March, etc). Covariance measures the trend of common movement in returns between two funds. A positive covariance shows the fund’s returns moving in the same direction, whereas a negative covariance shows the funds moving in opposite direction (when one goes up, the other one goes down). Covariance plays a role in determining portfolio volatility. Regression analysis examines the statistical connection between a variable of interest and one or more factors used to explain its variation. For example, if the variable of interest is student test scores, regression could be used to show the connection to factors such as time spent studying or IQ. R-squared is used in regression analysis to determine to what degree the variation in the changing series of interest is explained by the factors used to explain it. R-squared ranges from 0 (no explanatory power), to 1 (virtually all variation is explained by the analysis). In the example above, if test scores is the variable of interest, while IQ and study time are the factors used to explain it, then an R-squared of.9 would indicate that 90% of the variation in test scores can be explained by these two factors. Standard Error is a measure of precision when calculating various statistical terms. Generally, the higher the standard error, the lower the statistical strength of that estimation. T-statistic examines the statistical precision of various estimations by comparing the value of the calculation to the standard error (see above). Generally, a t-stat value of 2 or higher shows enough statistical precision to have confidence in the estimate being different from zero. Turnover is a measure of the fund s trading activity, and loosely represents the portion of a fund s holdings that have changed over a year. A lower turnover ratio indicates a more passive strategy. Tracking Error shows how different are each period’s returns of a given fund from the returns of a reference benchmark (generally commercial indexes). For example, if fund A’s returns in two subsequent periods are 10% and 20%, while the benchmark’s returns are 5% and 25% for the same periods, the average is the same (15%), but there is tracking error since there was a difference in period by period returns (period 1: 10% versus 5%, period 2: 20% versus 25%). Alpha measures the difference between the fund’s average performance and what would be expected based its compensating risk level, such as beta (see below). For example, if the fund’s average return was 10%, but the expectation based on its beta was 9%, then the alpha would show as 1%. Beta measures the degree to which the returns of a fund change with the market movements. Generally, the higher the scale of fund movements (up or down) relative to the market, the greater the beta. This is considered to be compensating risk for investors, i.e. the more risk (higher beta), the higher the investors’ expected returns versus the market. Three Factor Model explains the source of performance variation among investment portfolios, and it is an extension of previous Nobel Prize winning work. The model specifies that differences in portfolio returns can be attributed to (1) stocks/fixed income mix – riskier stocks have a higher potential return, (2) market capitalization of portfolio – smaller capitalization stocks are riskier and therefore have higher expected returns, and (3) market price relative to accounting measures of the firm, such as book value – stocks with higher book value to market ratios are riskier and have higher expected returns. This model was first published in major academic journals but has gained wide spread acceptance among investment professionals. SMB stands for Small Minus Big, and shows the difference in performance between the returns of small cap stocks and large cap stocks, and it is one of the factors used in the model described above. When used in regression analysis its computed coefficient (s) illustrates to what degree the portfolio captures the returns of small cap or large cap stocks. HML stands for High Book-to-Market (BtM) Minus Low Book-to-Market (BtM), and shows the difference in performance between the stocks with high BtM ratios (value stocks) and stocks with low BtM ratios (growth stocks), and it is one of the factors used in the model described above. When used in regression analysis its computed coefficient (h) illustrates to what degree the portfolio captures the returns value or growth stocks. DFA Standardized Performance Data and Disclosures.")
Similar presentations


 at a financial institution. Certificates of.>")


>")

