Download presentation
Presentation is loading. Please wait.

1
Demographic Pressures in North Africa: Causes and Consequences

2
North Africa Population (1970-2000)
")
3
Population Growth Rate (1970-2000)
")
4
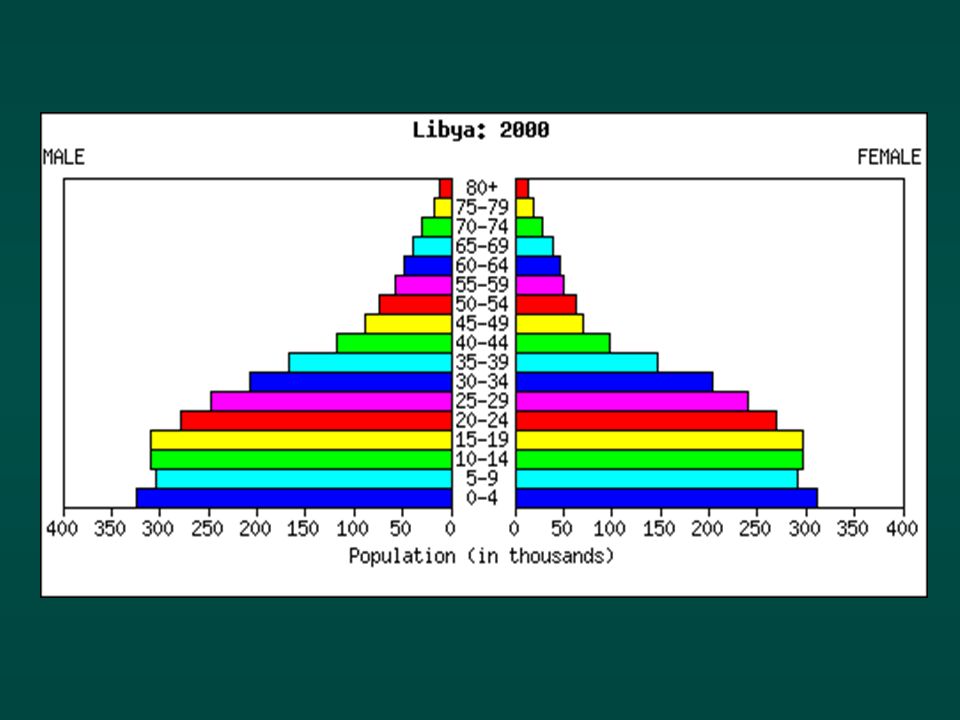
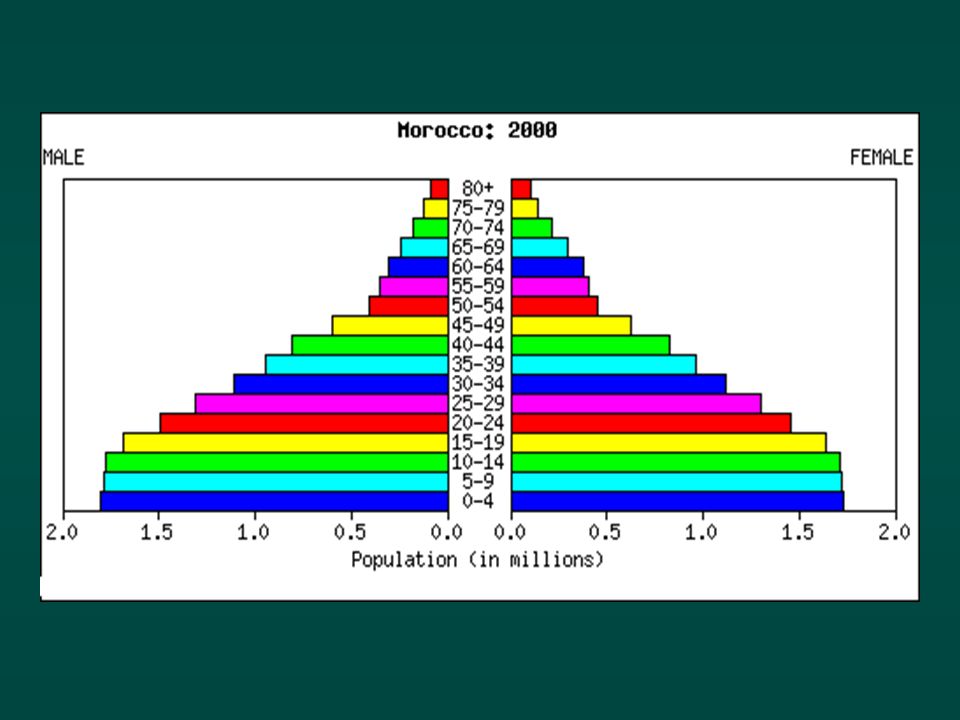
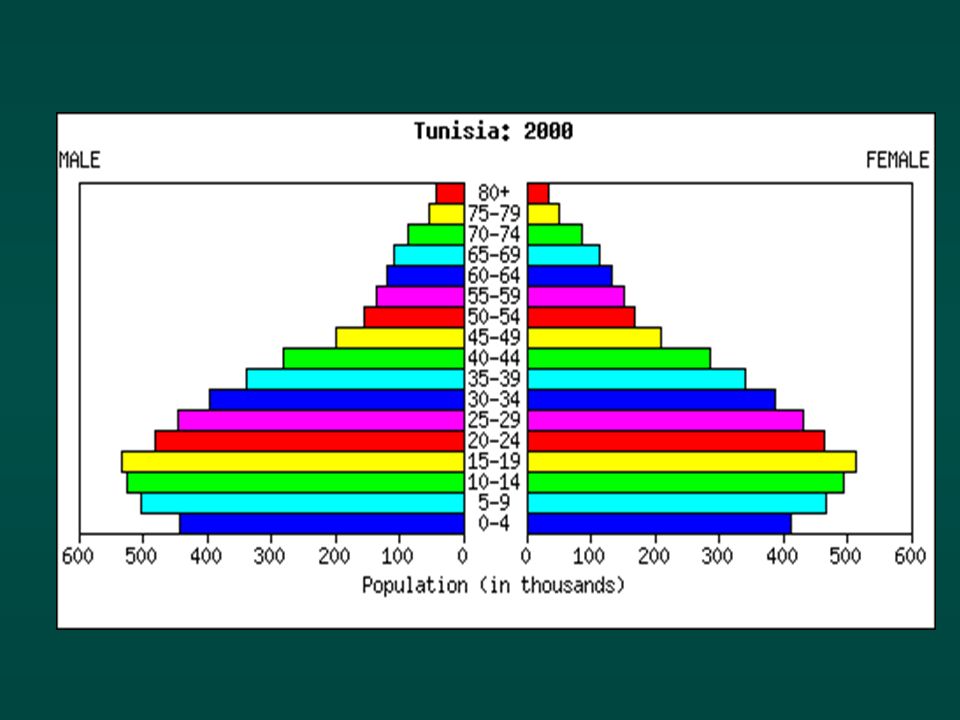
Population Structure in North Africa Country Age group 0-1415-6465+Total Algeria 34.861.04.1100.0 Egypt 35.460.54.1100.0 Libya 33.962.73.4100.0 Morocco 34.761.24.1100.0 Tunisia 29.764.45.9100.0

10
Total Fertility Rate (1970-2000)
")
11
Age-Specific Fertility Rates, 1995-2000

12
Total Fertility Rate (1970-2000)
")
13
Life Expectancy at Birth (1970-2000)
")
14
Consequences

15
Education

16
School Age Population (1980-2000)
")
17
Arable Land

18
Arable Land (1979-81 & 1997-99)
")
19
Fresh Water

20
... there are now about 1.2 billion people live in areas lacking water in the world. By 2050, the world population lacking water will be 2.4 billion. ” “ The United Nations, 1996

21
Fresh Water Resources in North Africa (1999-2025)
")
22
Demographic Pressures in North Africa: Causes and Consequences

Similar presentations


>")


