Download presentation
Presentation is loading. Please wait.

1
Moving Forward: Egypt and Its Population

2
Egypt’s Population

3
2 % Growth Rate 61.5

4
Egypt’s Population 123 2 % Growth Rate 61.5

5
Egypt China India Bangladesh

6
Egypt China India Bangladesh 5.5% habitable and 2.4% arable

7
= 100 persons Comparative Density EgyptBangladesh

8
Bangladesh = 100 persons Comparative Density Egypt 1,400 people/km 2

9
Bangladesh = 100 persons Comparative Density Egypt 2,600 people/km 2 1,400 people/km 2

10
= 100 persons Comparative Density Egypt 5,100 people/km 2 in 2030 Bangladesh 1,400 people/km 2

11
New Valley Development

12
Current Arable Land

13
New Valley Development Current Arable Land New Valley Arable Land

14
New Valley Development Current Arable Land New Valley Arable Land

15
New Valley Development Current Arable Land New Valley Arable Land 15 years.

16
Projection Assumptions u Two population projections

17
Projection Assumptions u Two population projections - Current fertility rate of 3.3 remains constant - red

18
Projection Assumptions u Two population projections - Current fertility rate of 3.3 remains constant - red - Replacement level fertility of 2.1 children per woman by 2015 - yellow

19
Annual Births constant fertility low fertility

20
Annual Births 1.6 constant fertility low fertility

21
Annual Births 2.5 1.6 constant fertility low fertility

22
Annual Births 1.5 2.5 1.61.6 constant fertility low fertility

23
Total Population constant fertility low fertility

24
Total Population 61.5 106 constant fertility low fertility

25
Total Population 61.5 90 106 constant fertility low fertility

26
Sectoral Impacts

27
Economy

28
Consequences of Growth Currently, Egypt must create 520,000 new jobs each year.

29
New Jobs Required

30
520 580 constant fertility

31
520 580 New Jobs Required low fertility constant fertility 270

32
2.4 million jobs 520 580 New Jobs Required low fertility constant fertility 270

33
Effects on the Economy With ample employment:

34
Effects on the Economy With ample employment: With inadequate employment:

35
Water

36
Water u Drinking u Irrigation u Industry u Drinking u Irrigation u Industry

37
... a lack of water may become one of the most serious impediments to the nation’s economic development, to say nothing of its negative impact on the quality of life of Egypt’s residents.” “ Egyptian Center for Economic Studies, 1996

38
Water Available per Person constant fertility low fertility

39
Water Available per Person 570 980 constant fertility low fertility

40
Water Available per Person 670 570 980 constant fertility low fertility

41
Water Available per Person 670 570 980 constant fertility low fertility 18% difference

42
Health

43
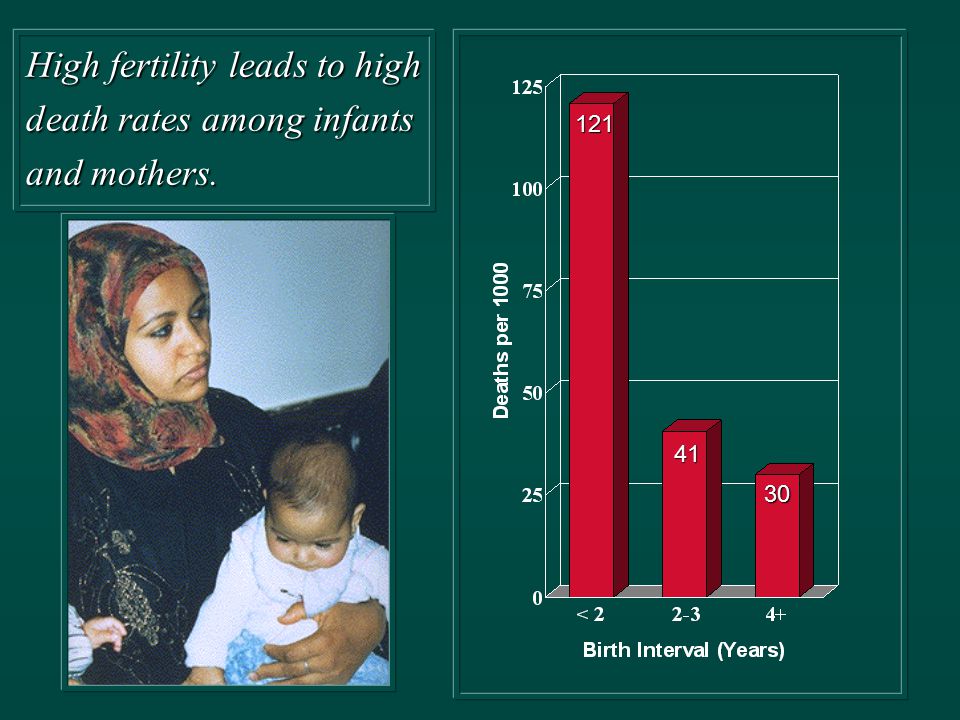
High fertility leads to high death rates among infants and mothers.

44
30 41 121
45
High Risk Births

46
26%

47
425,000 infants exposed 26% High Risk Births

48
425,000 infants exposed 34,000 infant lives saved High Risk Births

49
Benefits of Birth Spacing

50
Sectoral Impacts - 2026 18% higher income per person 2.7 million fewer in Cairo 3.8 million fewer primary students 18% more water 480 million LE saved annually in health costs

51
Contraceptive Prevalence and Total Fertility Contraceptive Prevalence Rate Total Fertility Rate

52
Contraceptive Prevalence and Total Fertility Contraceptive Prevalence Rate Total Fertility Rate 7% 7

53
Contraceptive Prevalence and Total Fertility Contraceptive Prevalence Rate Total Fertility Rate 48% 7% 7

54
Contraceptive Prevalence and Total Fertility Contraceptive Prevalence Rate Total Fertility Rate 7% 7 48%

55
Contraceptive Prevalence and Total Fertility Contraceptive Prevalence Rate Total Fertility Rate 7% 7 54% 48%

56
Contraceptive Prevalence and Total Fertility Contraceptive Prevalence Rate Total Fertility Rate 7% 3.6 7 54% 3.3 48%

57
Contraceptive Prevalence and Total Fertility Contraceptive Prevalence Rate Total Fertility Rate 7% 3.6 7 54% 3.3 70% 48%

58
Contraceptive Prevalence and Total Fertility Contraceptive Prevalence Rate Total Fertility Rate 7% 3.6 7 54% 3.3 70% 2.1 48%

59
Actions Required è Continue strong Government of Egypt support for the family planning program è Strengthen linkages between the family planning program and other sectors è Enhance private sector participation in the family planning program

60
Cost and Benefits of Family Planning Programs

61
Tunisia 8.60

62
TunisiaIndonesia 8.60 12.50

63
TunisiaIndonesiaThailand 8.60 12.50 14.00

64
TunisiaIndonesiaThailandEgypt 8.60 12.50 14.00 30.00

65
Effects of a Delay

66
104 - 2010

67
Effects of a Delay 104 - 2010 108 - 2015

68
Effects of a Delay 104 - 2010 112 - 2020 108 - 2015

69
Effects of a Delay 104 - 2010 112 - 2020 108 - 2015

70
Effects of a Delay 104 - 2010 112 - 2020 108 - 2015 5 year delay = 4 million 5 year delay = 4 million

71
Egypt’s Choices Continue current efforts Implement new approaches

72
Egypt’s Choices 3 Continue current efforts Implement new approaches

73
Egypt’s Choices 3 3 Continue current efforts Implement new approaches

74
Actions Required è Continue strong Government of Egypt support for the family planning program è Strengthen linkages between the family planning program and other sectors è Enhance private sector participation in the family planning program

75
Moving Forward: Egypt and Its Population

Similar presentations


 Population size (N) -ideal habitat -maximum reproduction -unlimited resources Increase often.>")

>")


