Download presentation
Presentation is loading. Please wait.

1
1 ANOVA: ANalysis Of VAriances Shyh-Kang Jeng Department of Electrical Engineering/ Graduate Institute of Communication/ Graduate Institute of Networking and Multimedia

2
Scenarios To test if the following statements are plausible – –Music compressed by four MP3 compressors are with the same quality – –Three new drugs are all as effective as a placebo – –Four brands of beer are equally tasty – –Lectures, group studying, and computer assisted instruction are equally effective for undergraduate students 2

3
Comparing Four MP3 Compressors Test four brands, A, B, C, D 10 subjects each brand (40 in total) to provide a satisfaction rating on a 10-point scale Assume that the rating to each brand is a normal distribution, but all four distributions are with the same variance
 to provide a satisfaction rating on a 10-point scale Assume that the rating to each brand is a normal distribution, but all four distributions are with the same variance")
4
Hypotheses Null hypothesis Alternative hypothesis

5
Problem of Using a t-Test Must compare two brands at a time There are 6 possible comparisons Each has a 0.05 chance of being significant by chance Overall chance of significant result, even when no difference exist, approaches 1-(0.95) 6 ~ 0.26
 6 ~ 0.26")
6
Sample Data SubjectABCD 14572 24581 35672 45693 56763 63634 74425 84524 93624 104333 Mean4.25.34.93.1 Grand mean: 4.375 *Adapted from: G. R. Norman and D. L. Streiner, Biostatistics, 3rd ed.

7
Thinking in Terms of Signals and Noises Signals – –Overall difference among the means of the groups – –Sum of all the squared differences between group means and the overall means Noises – –Overall variability within the groups – –Sum of all the squared differences between individual data and their group means

8
Sum of Squares (Between)
")
9
Sum of Squares (Within)
")
10
Sum of Squares (Total)
")
12
12 2 Distribution

13
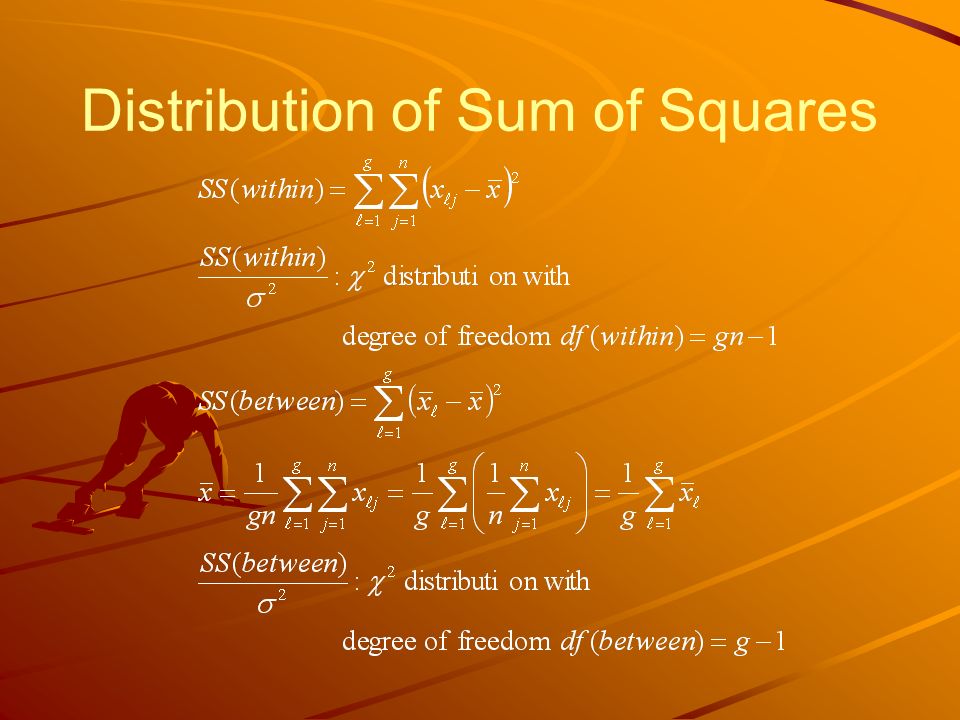
Distribution of Sum of Squares

15
15 F-Distribution

16
16

17
Distribution of F

18
Expected Values of Sum of Squares

19
Degrees of Freedom

20
ANOVA Summary SourceSum of Squares dfMean square F Between 27.87539.2923.296 Within101.500362.819 Total129.37539

21
Hypothesis Testing

Similar presentations

 Part III: Additional Hypothesis Tests Renee R. Ha, Ph.D. James C. Ha, Ph.D Integrative Statistics for the Social.>")


, we have: H 0 : 1 = 2 = 3 = … = k H 1 : at least one i does not equal the others.>")


![Hypothesis testing for the mean [A] One population that follows a normal distribution H 0 : = 0 vs H 1 : 0 Suppose that we collect independent.](/16/5187864/big_thumb.jpg "Hypothesis testing for the mean [A] One population that follows a normal distribution H 0 : = 0 vs H 1 : 0 Suppose that we collect independent.>")
.>")

.>")


 Quantitative Methods in HPELS 440:210.>")


>")