Download presentation
Presentation is loading. Please wait.

1
Topic 1 Tools of the Biology Laboratory Exercise I. The spectrophotometer. Exercise II. Liquid Measurements. Exercise III. Sedimentation and Centrifugation.

2
Exercise I. The Spectrophotometer Experiment 2: Absorption Spectra of Dyes. Experiment 1: Concentration of an unknown Dye.

3
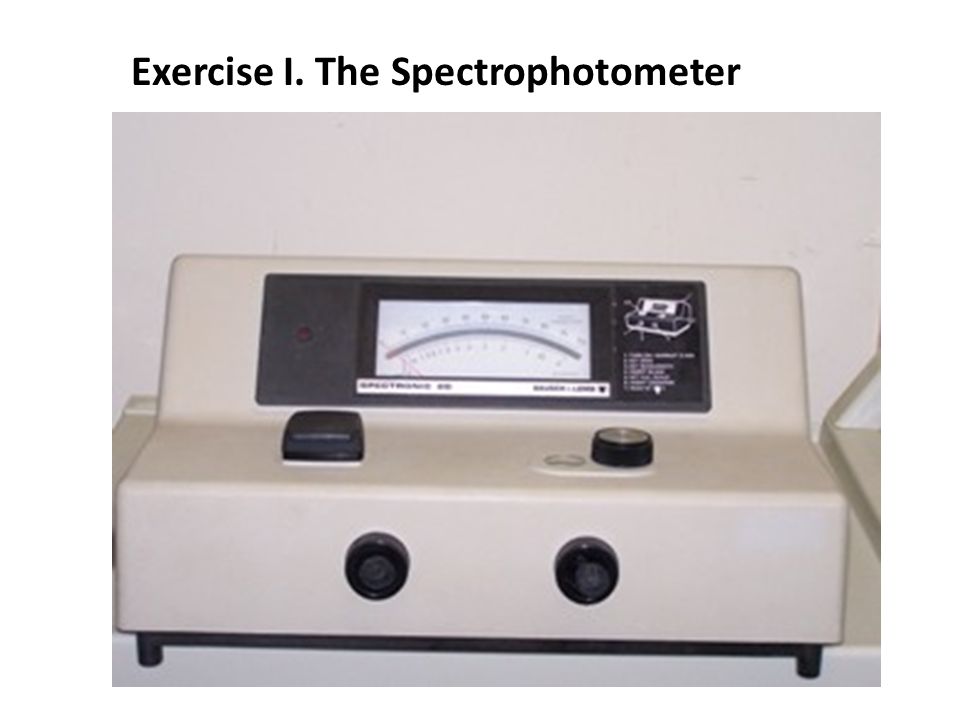
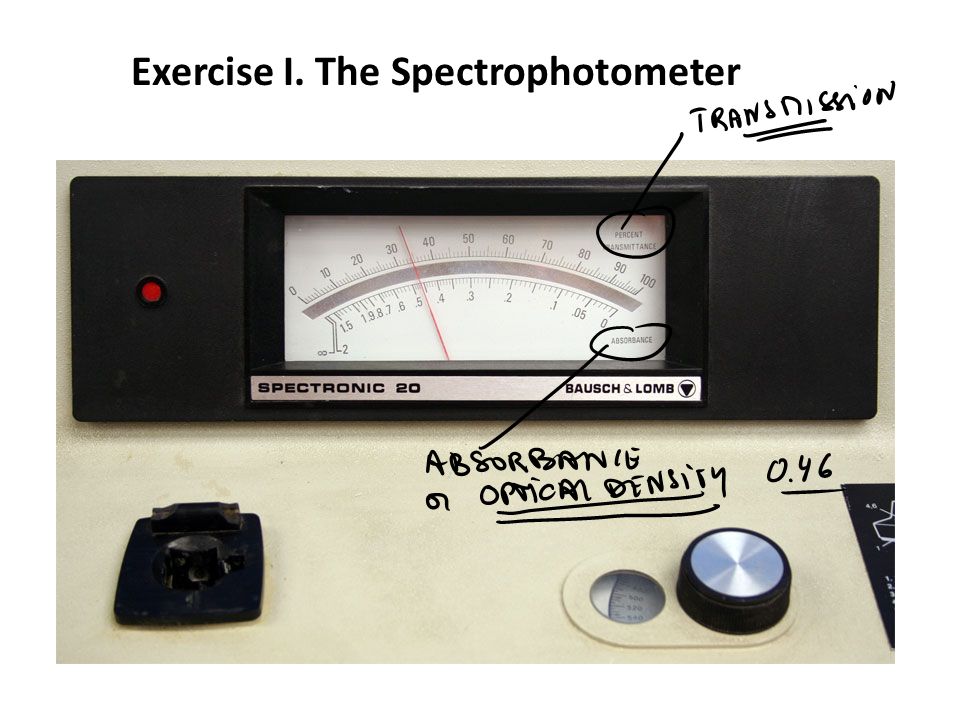
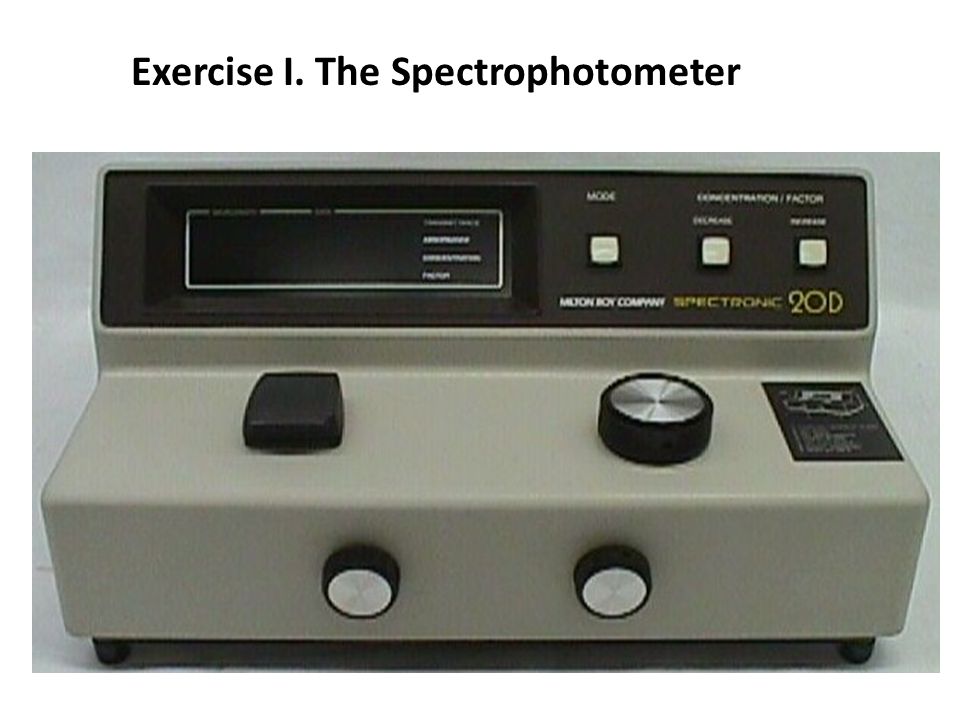
Exercise I. The Spectrophotometer

9
Exercise I. The Spectrophotometer: Absorption spectrum. 1. Change wavelength. 2. Blanc. 3. Measure.

10
Exercise I. The Spectrophotometer: Absorption spectrum.

11
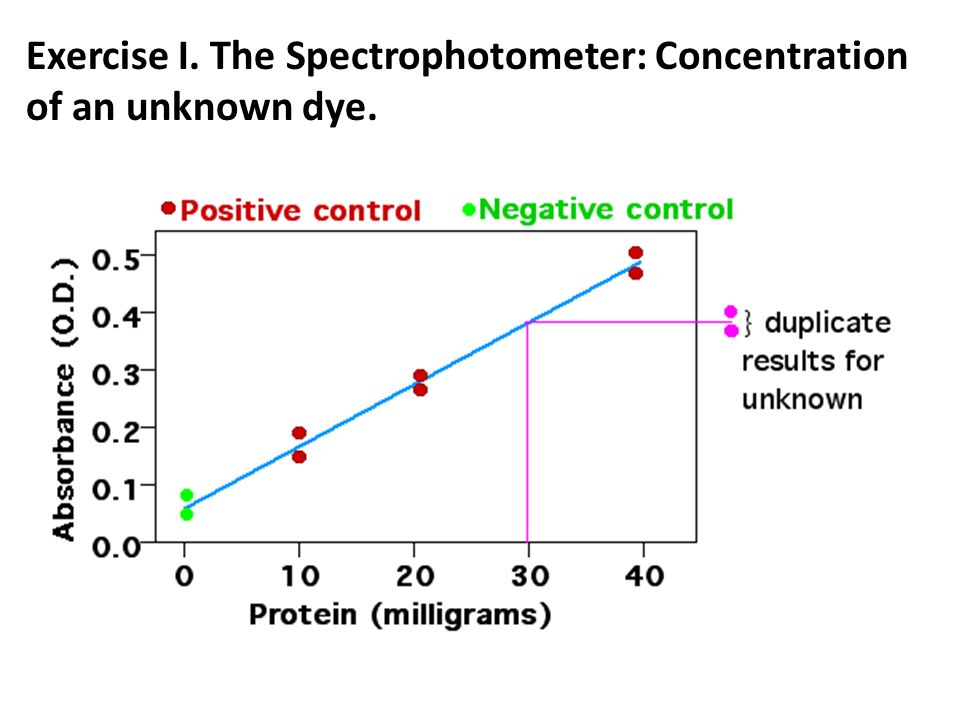
Exercise I. The Spectrophotometer: Concentration of an unknown dye.

13
LAB REPORT FORMAT: (1 report per group!) LAB TITLE: Properties and Function of Enzymes. Experiment 1. Goal: one sentence. Method: Relevant. Results: (based on class data). A (mean and SEM) is significantly different (P<0.05) from B (mean and SEM). Conclusion: A is different from B. Explanation.
. A (mean and SEM) is significantly different (P<0.05) from B (mean and SEM). Conclusion: A is different from B. Explanation..")
15
Figure 1. Standard curve of yellow dye at 420 nm. We measured the optical density at 420 nm of four concentrations of yellow dye (1, 2, 3, and 4 drops per sample) using a Spectronix 21 spectrophotometer. The OD of Standard 1 ((0.217 ± 0.0070) was significantly smaller (P<0.05, Student’s t-test) than that of Standard 2 (0.410 ± 0.0057), the OD of Standard 2 was significantly smaller (P<0.05) than that of Standard 3 (0.619 ± 0.0045) and the OD of Standard 3 was significantly smaller (P<0.05) than that of Standard 4 (0.806 ± 0.0087). We calculated the standard curve (linear regression y = 0.1977x + 0.0186, R 2 = 0.9996).We measured the optical density at 420 nm of an unknown concentration of yellow dye (OD equals 0.699 ± 0.0054) and used the standard curve to determine its concentration (3.44 drops per sample).
 using a Spectronix 21 spectrophotometer. The OD of Standard 1 ((0.217 ± ) was significantly smaller (P<0.05, Student’s t-test) than that of Standard 2 (0.410 ± ), the OD of Standard 2 was significantly smaller (P<0.05) than that of Standard 3 (0.619 ± ) and the OD of Standard 3 was significantly smaller (P<0.05) than that of Standard 4 (0.806 ± ). We calculated the standard curve (linear regression y = x , R 2 = ).We measured the optical density at 420 nm of an unknown concentration of yellow dye (OD equals ± ) and used the standard curve to determine its concentration (3.44 drops per sample)..")
16
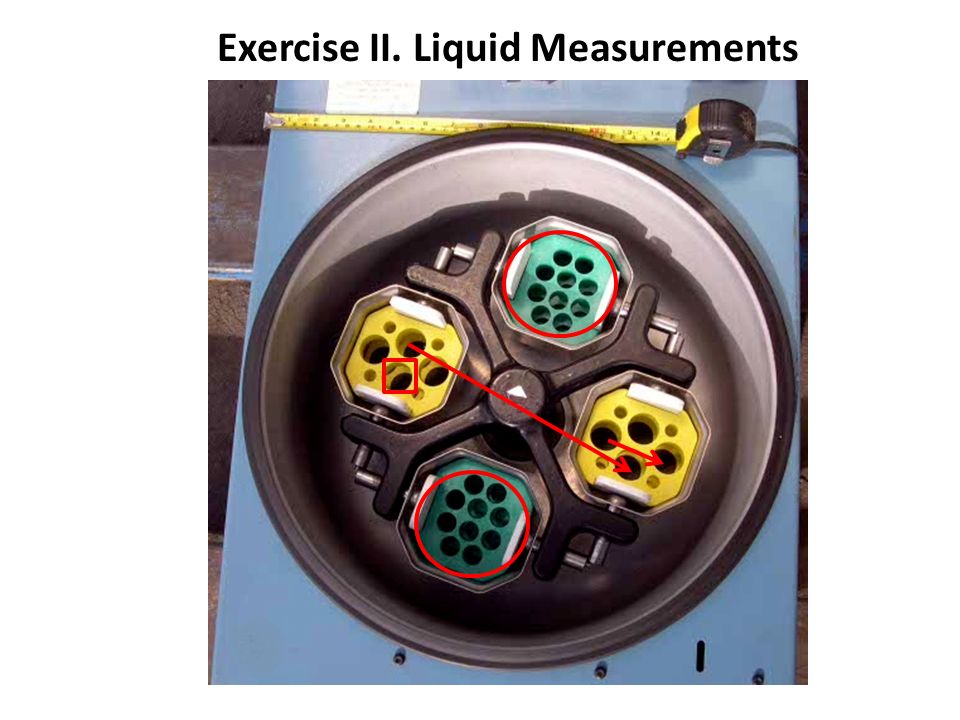
Exercise II. Liquid Measurements Accuracy of (1) 50 ml Graduated cylinder, (2) 10 ml serological pipette, and (3) 1.0 ml micropipette. Percent error when device is used at maximal and 1/10 th maximal nominal volume.
 50 ml Graduated cylinder, (2) 10 ml serological pipette, and (3) 1.0 ml micropipette. Percent error when device is used at maximal and 1/10 th maximal nominal volume..")
17
Exercise II. Liquid Measurements Measure by weight (mass). Read mass in g. Tare or zero the balance. Add volume of water. Measure. What mass (g) do you expect?
 do you expect .")
18
Exercise II. Liquid Measurements: 50 ml cylinder.

19
Exercise II. Liquid Measurements: 10 ml pipette.

20
Exercise II. Liquid Measurements

21
Exercise II. Liquid Measurements: 1.0 ml micropipettor.

22
Exercise II. Liquid Measurements

24
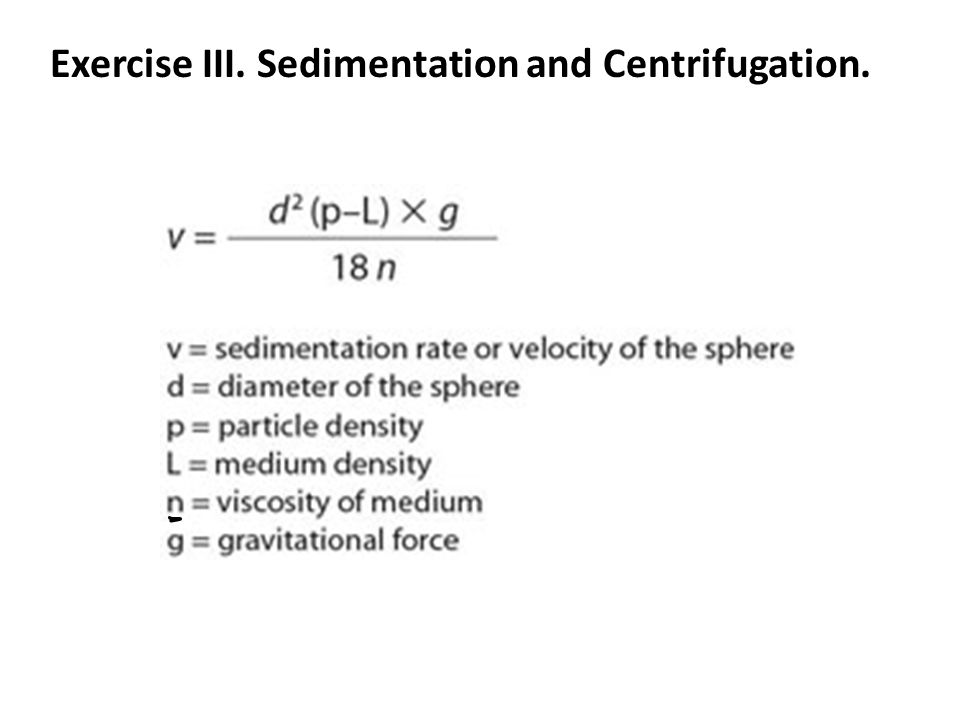
Exercise III. Sedimentation and Centrifugation.

26
Sedimentation at 1 gSedimentation in 50 ml conical tube at slow centrifugation Sedimentation in microfuge tubes at high speed centrifugation

27
Exercise III. Sedimentation and Centrifugation.

30
Exercise II. Liquid Measurements

33
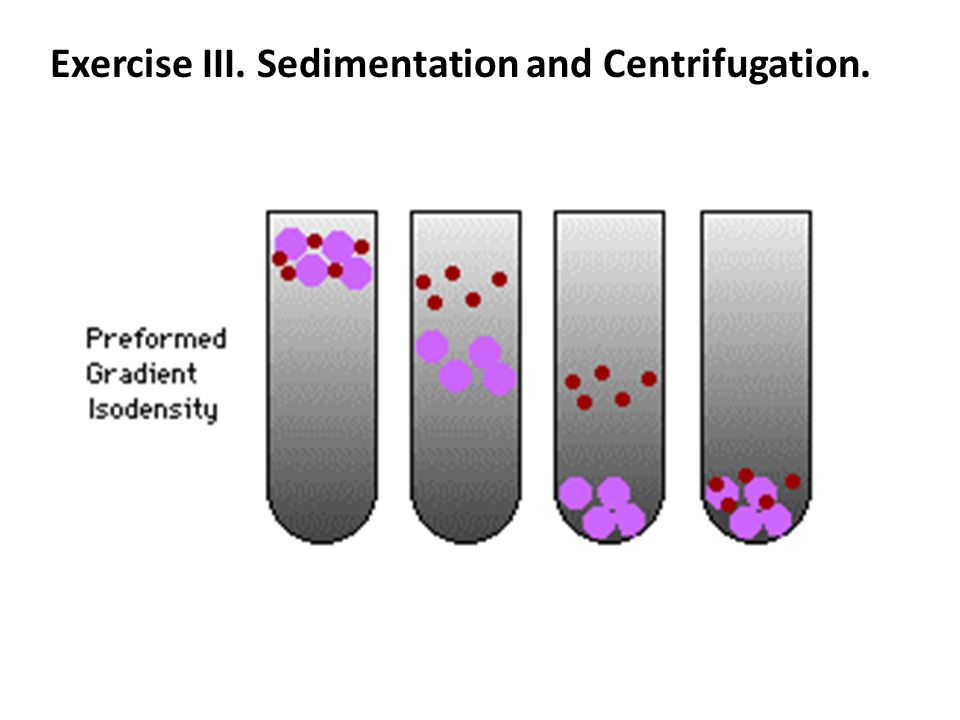
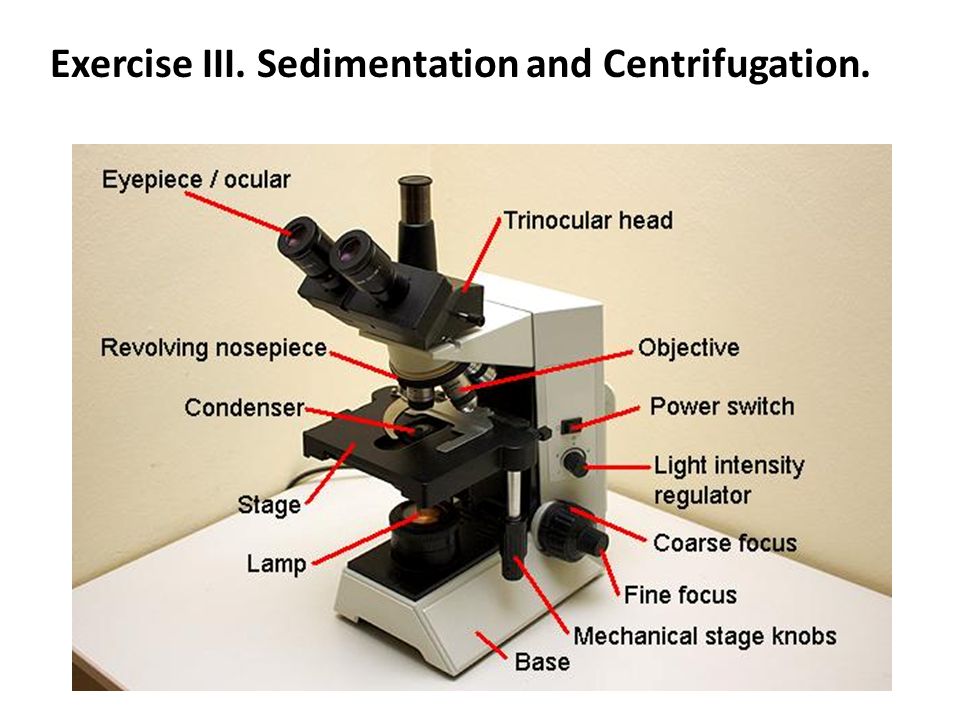
Exercise III. Sedimentation and Centrifugation.

35
Sedimentation at 1 gSedimentation in 50 ml conical tube at slow centrifugation Sedimentation in microfuge tubes at high speed centrifugation

Similar presentations


 Regular Objects 1.Measure the each side of the block in centimeters. Calculate volume in cm³: multiply.>")


![Identification of the common laboratory glassware, pipettes and Equipment . BCH 312 [PRACTICAL]](/24/7474341/big_thumb.jpg "Identification of the common laboratory glassware, pipettes and Equipment . BCH 312 [PRACTICAL]>")


