Download presentation
Presentation is loading. Please wait.

1
Attribution of Haze Project Update Fire Emissions Joint Forum Meeting September 8-9, 2004 Worley, ID

2
Attribution of Haze Project Update Today’s presentation Schedule status Class I areas for attribution Support contractor/web page Emissions data displays examples Source apportionment modeling parameters Transport regression approach

3
2004 AoH Project Schedule - Status 9/20-21 – Uses of Modeling Results training 9/21-22 – AoH meeting (both in Salt Lake City) “Interim” emissions inventories displays/qualifiers Source apportionment modeling results for each Class I area by State and key species Detailed draft outline of project report 10/8 and every 2 weeks – conference call Week of 11/15 – AoH and Dust Emissions Forum meetings/Causes of Haze tools training – Las Vegas CoHA “transport regression” results for source regions Natural/manmade source apportionment results for each Class I area Continuing drafting or report External review draft report December 2004 Complete report by January 2005
 Interim emissions inventories displays/qualifiers Source apportionment modeling results for each Class I area by State and key species Detailed draft outline of project report 10/8 and every 2 weeks – conference call Week of 11/15 – AoH and Dust Emissions Forum meetings/Causes of Haze tools training – Las Vegas CoHA transport regression results for source regions Natural/manmade source apportionment results for each Class I area Continuing drafting or report External review draft report December 2004 Complete report by January 2005")
4
AoH Phase I Web Page Operational Go to the AoH Work Group “About” page and click on the “Phase I (ARS)” link under “Projects” in the right hand navigation box Or, go directly to this link: http://www.wrapair.org/forums/aoh/ars1/index.html This page contains a brief overview of the project and direct links to ARS presentations The “Report” section of the navigation box will direct you to other ARS documents – currently, only the “EI Summary Products” link is active
 link under Projects in the right hand navigation box Or, go directly to this link: This page contains a brief overview of the project and direct links to ARS presentations The Report section of the navigation box will direct you to other ARS documents – currently, only the EI Summary Products link is active")
5
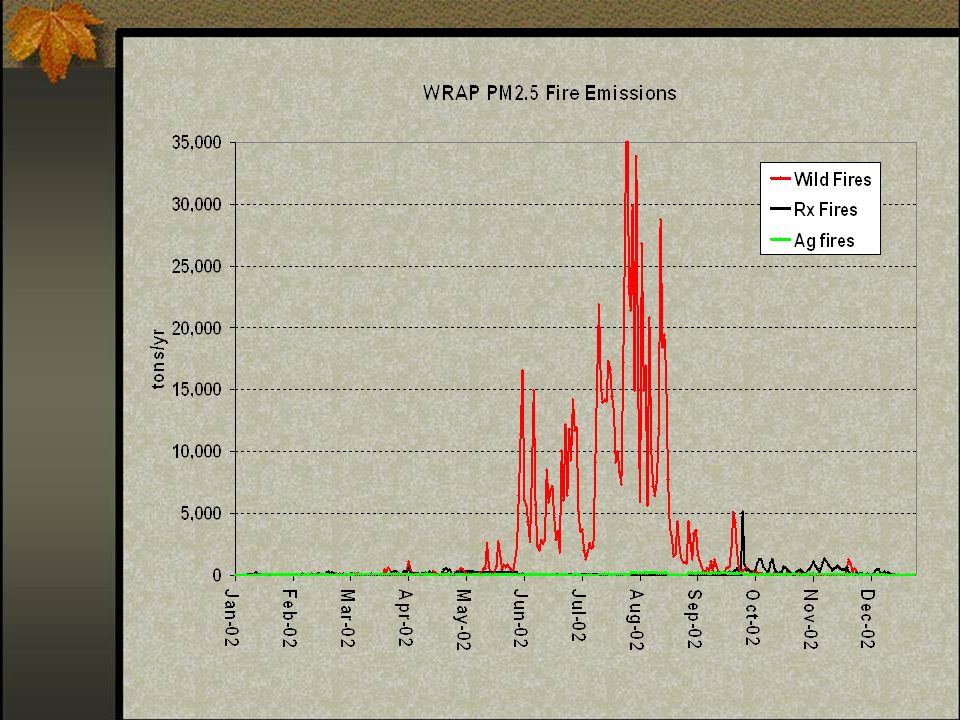
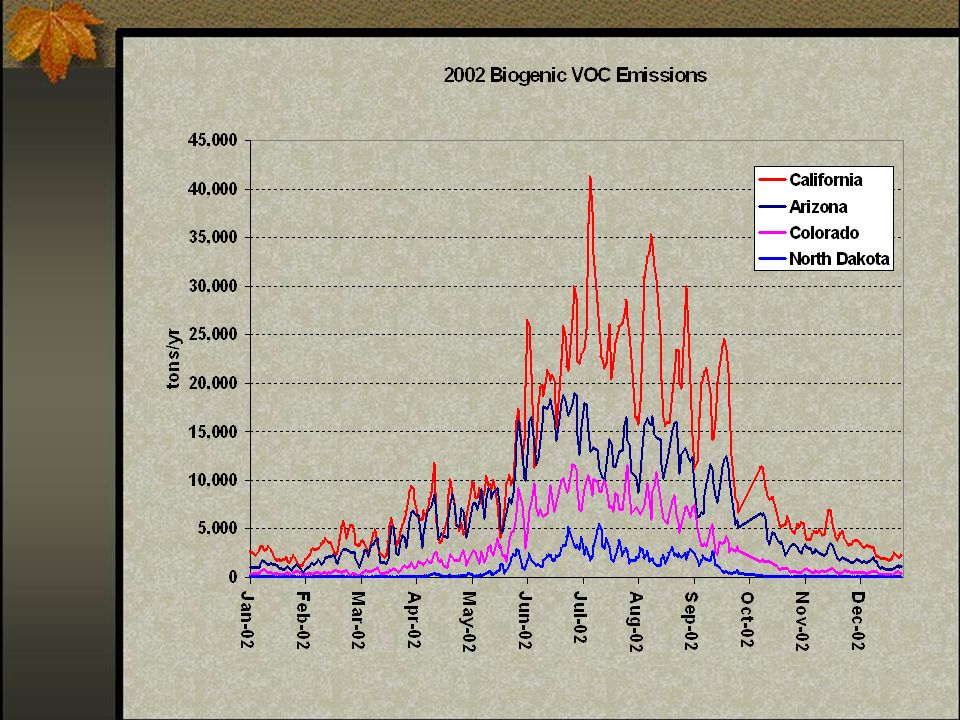
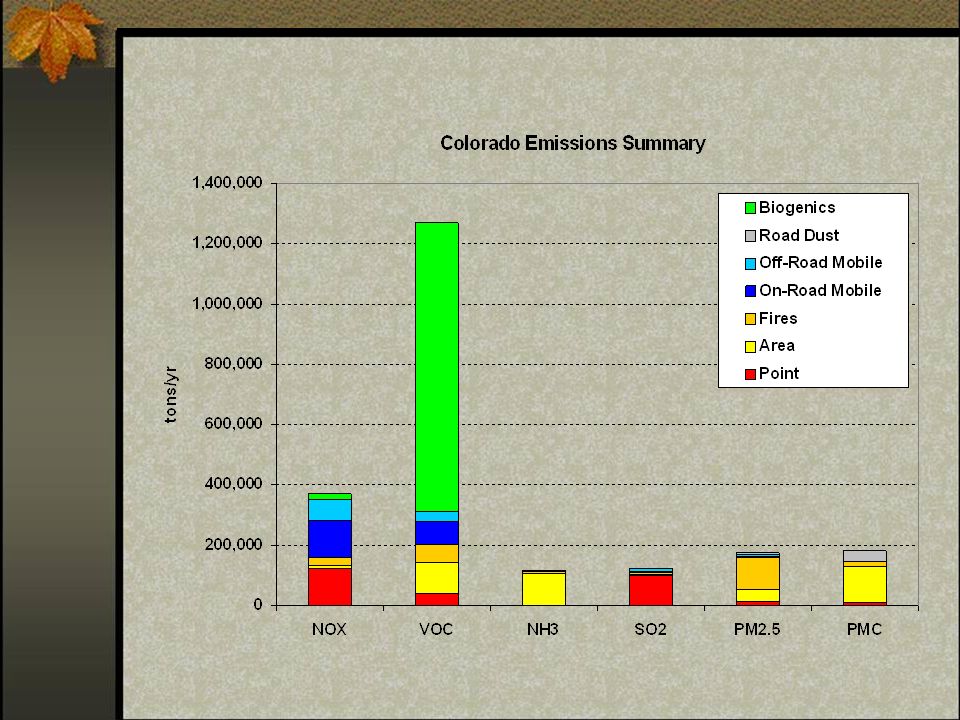
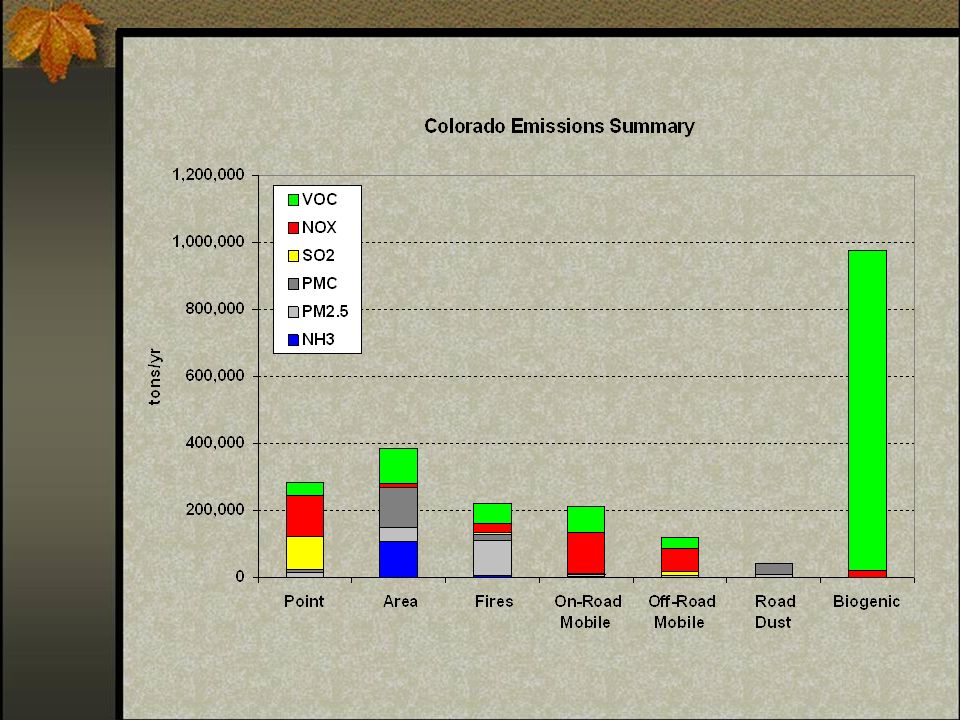
Review of 2002 “interim” Emissions Fires Actual 2002 wildland fire and prescribed fire emission inventories Specific location, date, size and fuel loading for each fire event. Biogenic Emissions Biogenic Emissions Inventory System (BEIS3) Vegetation Data: Biogenic Emissions Landuse Database (BELD3) Meteorological Data (MM5v3)
 Vegetation Data: Biogenic Emissions Landuse Database (BELD3) Meteorological Data (MM5v3).")
13
Next Steps Review modeling and monitoring results Work with RMC to determine best way to summarize boundary conditions and off- shore emissions Prepare a simple comparison between “actual” and “interim” 2002 EI Develop outline for final report Generate summary products for Class I areas/clusters Updates will be presented at AoH meeting in Salt Lake City (Sept. 20-22)
.")
17
Tagging Priorities for “2002-like” EIs (State/Source Category/Species) for Geographic Source Apportionment Modeling Study (6/04) CMAQ/Models3 Emissions Groupings Source Categories (Priority Order) States/Countries/ Regions to be Tagged # of Tags WRAP Region Data Source Comments SO 2 1. Point 2. Combined Mobile (on-road + non-road) 1-13. Contiguous WRAP region states (WA, OR, CA, AZ, NV, UT, ID, MT, WY, CO, NM, SD, ND) 14. Mexico 15. Canada 16. Combined area of states east of WRAP region 1. 16 2. 16 1. Pechan 2. ENVIRON Accounts for ~85 % of regional emissions, varies by state NO x 1. Point 2. Combined Mobile (on-road + non-road) 1. 16 2. 16 1. Pechan 2. ENVIRON Accounts for ~ 80% of emissions, varies by state, no biogenic NO x NH 3 Total NH 3 from all source categories 16 Various Accounts for 100 % of emissions, dominated by area source category in all states, no biogenic NH 3 PM 2.5 (Includes EC, OC, fine fraction dust, and small amounts of directly emitted NO 3 and SO 4 EC from: 1. Combined Fire (Wx, Rx, Ag) 2. Area 1. 16 2. 16 1.Air Sciences 2. Pechan 1. Fire accounts for >50 % of regional PM 2.5 emissions, varies by state 2. Area accounts for ~33% of regional PM 2.5 emissions, varies by state PMCoarse (Includes all species in the PM 2.5 to PM 10 aerosol fraction)
 Contiguous WRAP region states (WA, OR, CA, AZ, NV, UT, ID, MT, WY, CO, NM, SD, ND) 14. Mexico 15. Canada 16. Combined area of states east of WRAP region Pechan 2. ENVIRON Accounts for ~85 % of regional emissions, varies by state NO x 1. Point 2. Combined Mobile (on-road + non-road) Pechan 2. ENVIRON Accounts for ~ 80% of emissions, varies by state, no biogenic NO x NH 3 Total NH 3 from all source categories 16 Various Accounts for 100 % of emissions, dominated by area source category in all states, no biogenic NH 3 PM 2.5 (Includes EC, OC, fine fraction dust, and small amounts of directly emitted NO 3 and SO 4 EC from: 1. Combined Fire (Wx, Rx, Ag) 2. Area Air Sciences 2. Pechan 1. Fire accounts for >50 % of regional PM 2.5 emissions, varies by state 2. Area accounts for ~33% of regional PM 2.5 emissions, varies by state PMCoarse (Includes all species in the PM 2.5 to PM 10 aerosol fraction).")
18
CoHA Project – Example Approach: Receptor-oriented source contribution analyses of aerosol/meteorological monitoring data NW-AK NE-AK SE-AK SW-AK NW SW NE SE Denali Transport Regression Region

19
CoHA Project – Example Approach: Receptor-oriented source contribution analyses of aerosol/meteorological monitoring data

Similar presentations


 Implementation Workgroup.>")


