Download presentation
Presentation is loading. Please wait.

1
Good Morning! Let’s talk about Journal 2… CodeMain Points What I was looking for √ (yes) ~ (almost) x (no) observation“the graph shows…” “the big picture is…” “the overall trend is…” √ (yes) ~ (almost) x (no) inference“I think ___ because…” “this might happen because…” √ (yes) ~ (almost) x (no) question“why is…?” “when did…?” “are there…?”
 ~ (almost) x (no) observation the graph shows… the big picture is… the overall trend is… √ (yes) ~ (almost) x (no) inference I think ___ because… this might happen because… √ (yes) ~ (almost) x (no) question why is… when did… are there… .")
2
Journal 2 Questions! How many wolves die per year? Since 2011, the wolves are no longer endangered, and so more than 550 were killed in the 2013 hunting season. Do wolves have predators? Yes. Humans. What happened in 1995? Wolves were re-introduced to Idaho and Yellowstone National Park. Breeding habits of wolves? Wolves mate once a year (in the spring). They often have one litter of cubs.
. They often have one litter of cubs..")
3
Journal 2 What was the wolf population before 1979? Why is the population increasing?

4
True or False? “Wow, visual data is so cool and useful and it will definitely never ever lie to me!”

5
Goals Understand common ways that we can be deceived by data Define the difference between correlation and causation Practice asking questions about data

6
3-D Graphs Which item (A, B, C, or D) is the largest? Which is the smallest?
 is the largest Which is the smallest")
7
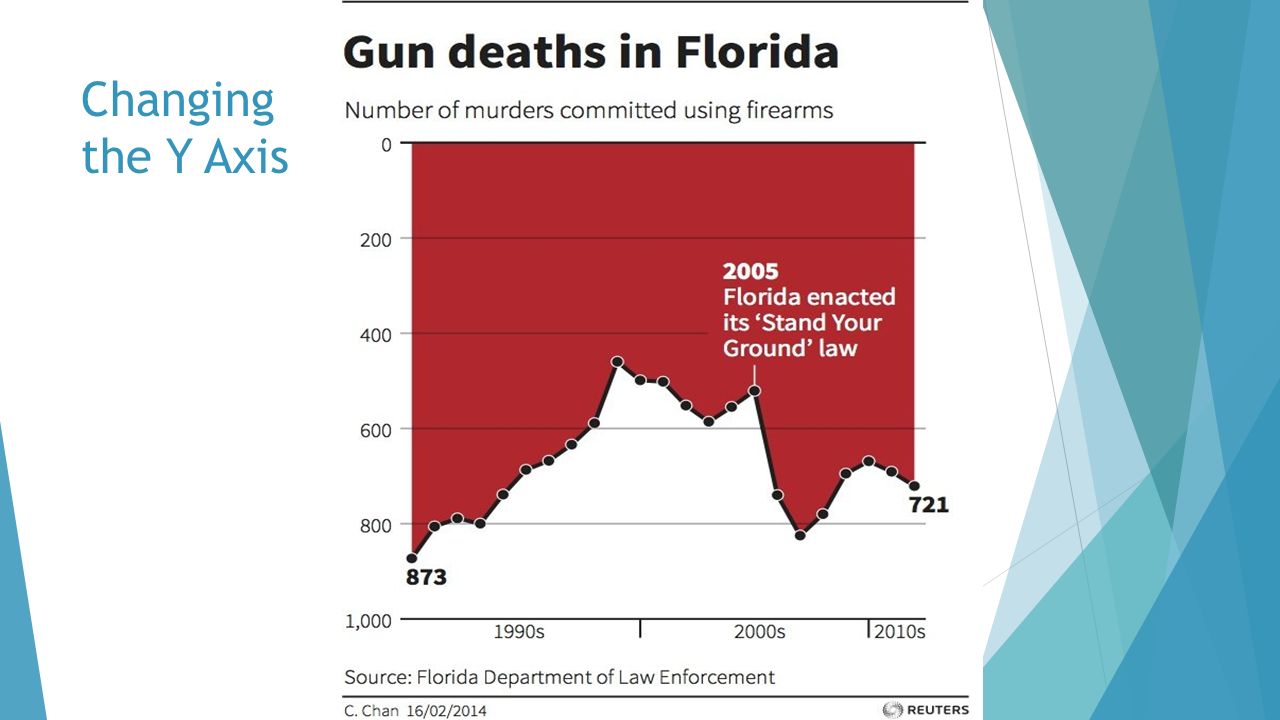
Changing the Y Axis

9
Cherry Picking

11
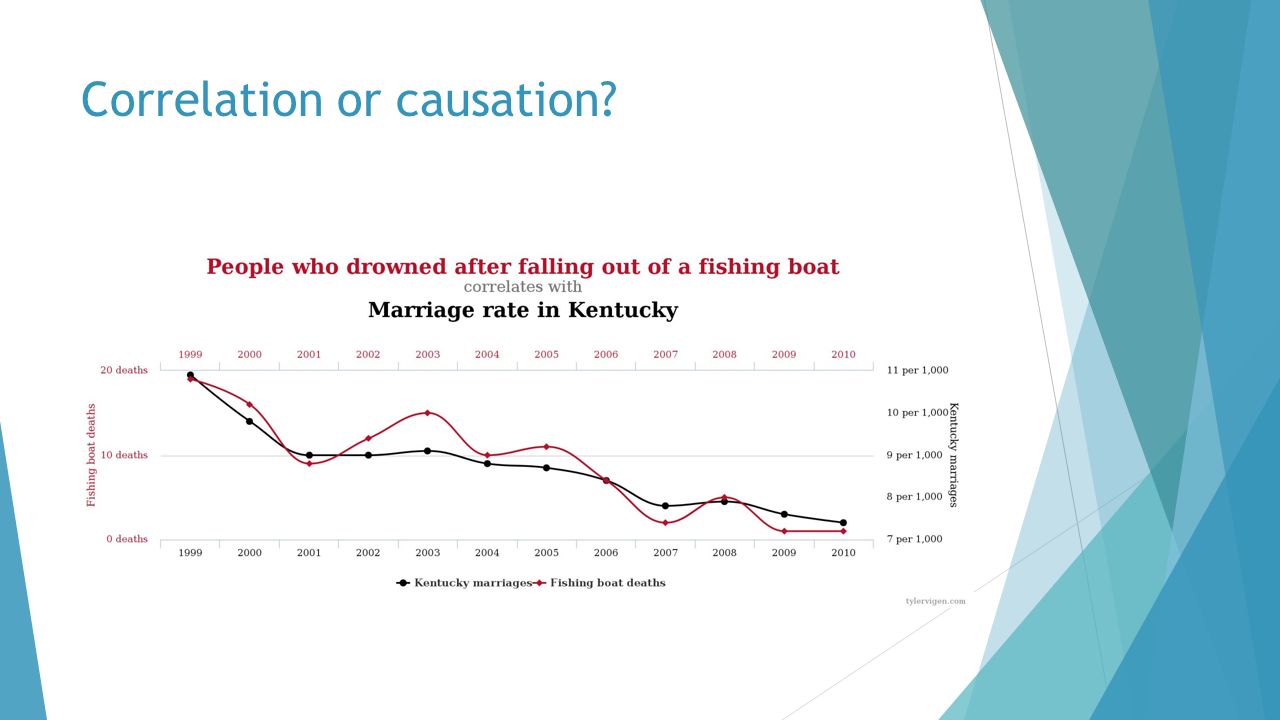
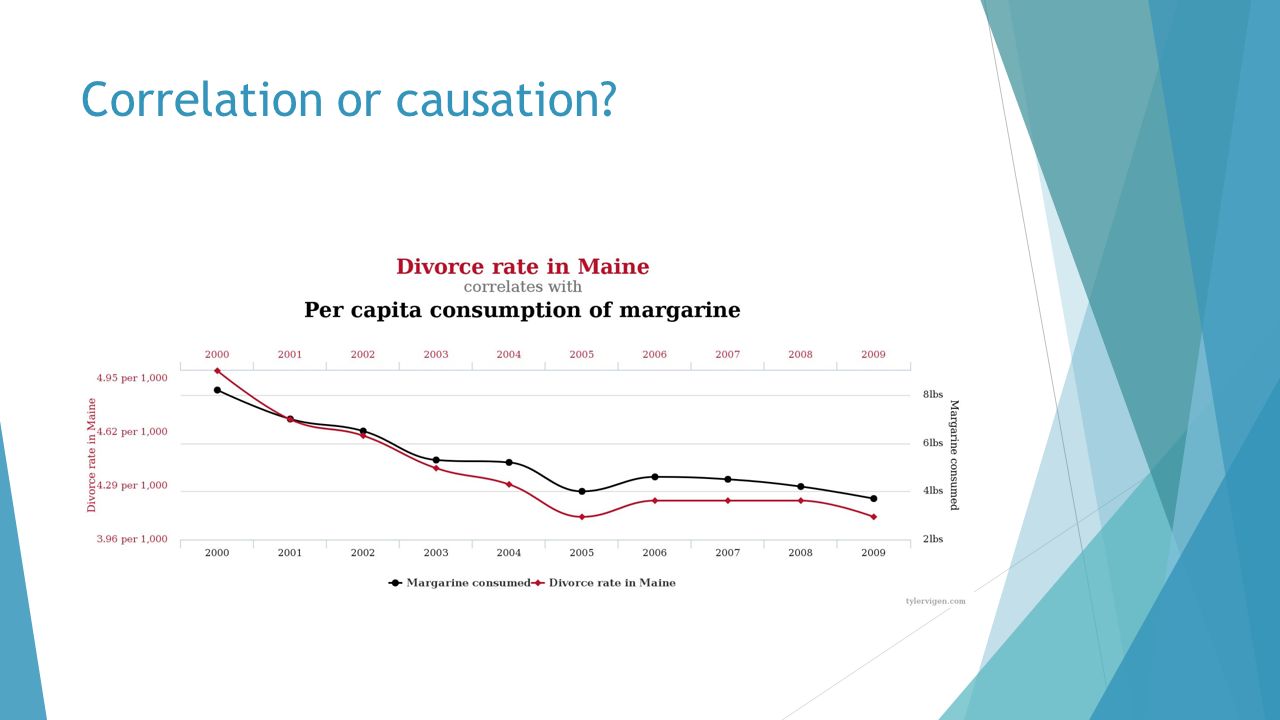
Correlation vs. Causation Correlation: a relationship between two variables “If I see X increase, I think I will also find that Y increased” Causation: in which one variable causes the other to happen “I know that as X goes up, so will Y because X causes Y” CORRELATION ≠ CAUSATION

12
Correlation vs. Causation http://tylervigen.com/discover http://tylervigen.com/discover http://www.tylervigen.com/spurious-correlations http://www.tylervigen.com/spurious-correlations

13
Correlation or causation?

16
Observation vs. Interpretation I see that… Based on that, I think…

17
So what can we do?

18
Asking Questions Is this data trying to sell me something? Is this data reliable? Is there more data from years before or after? Is the data extrapolating (predicting far into the future with limited information)? Why do I see this on the data? Are there other variables involved?
. Why do I see this on the data. Are there other variables involved .")
19
Practice Time! Please do Journal 3 Warning: this one is tricky! Think outside the box...are there other variables you are not thinking of?

20
Think outside the box…are there other things going on?

Similar presentations


 and response variable (y). u We.>")


