Download presentation
Presentation is loading. Please wait.

2
Two-Dimensional Infrared Correlation in Time-resolved Spectroscopy Sadeq M. Al - Alawi Department of Chemistry University of Bahrain October 24, 2002

3
Two-dimensional IR spectroscopy It is an analytical method based on time-resolved detection of IR signals to study molecular interaction

4
How does it work ? When a perturbation is applied to the system, various chemical constituents of the system are excited. The excitation and subsequent relaxation toward the equilibrium can be probed with IR.

5
The forward Fourier transform Y 1 ( ) of the dynamic spectral intensity y( 1,t)observed at a wavenumber, 1 is given by:
 of the dynamic spectral intensity y( 1,t)observed at a wavenumber, 1 is given by:")
6
Likewise, the conjugate of the Fourier transform 2 * ( ) of dynamic spectral intensity y( 2,t) observed at spectral variable 2 is given by 2 * ( ) = y( 2,t) e +it dt = 2 re ( ) -i 2 im ( ) 2 * ( ) = y( 2,t) e +it dt = 2 re ( ) -i 2 im ( )
 of dynamic spectral intensity y( 2,t) observed at spectral variable 2 is given by 2 * ( ) = y( 2,t) e +it dt = 2 re ( ) -i 2 im ( ) 2 * ( ) = y( 2,t) e +it dt = 2 re ( ) -i 2 im ( )")
7
The complex two-dimensional correlation intensity is defined as ( 1, 2 ) + i ( 1, 2 ) = 1 ( ). 2 * ( ) d
 d .")
8
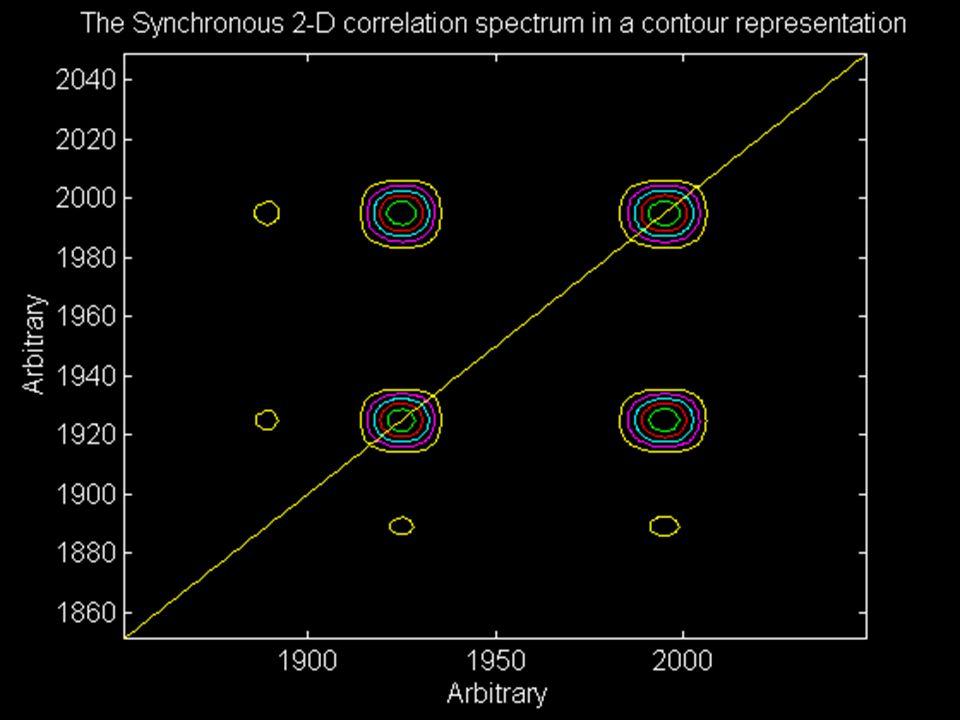
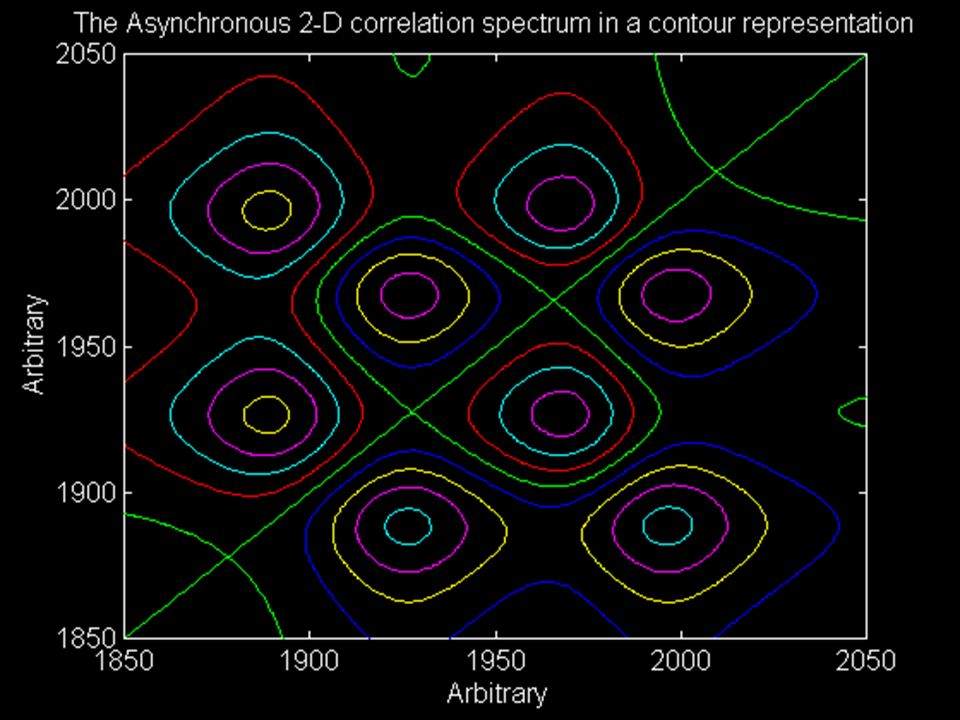
Noda (1995) proved that the synchronous 2D correlation spectrum can be computed without Fourier transforming dynamic spectral data ( 1, 2 ) = y( 1,t). y( 2,t) dt
 dt.")
9
Advantages: Simplify complex spectra consisting of many overlapped peaks. Enhances spectral resolution by spreading peaks over the second dimension. Enables us to show the infrared bands that change together in time. Simplify complex spectra consisting of many overlapped peaks. Enhances spectral resolution by spreading peaks over the second dimension. Enables us to show the infrared bands that change together in time.

16
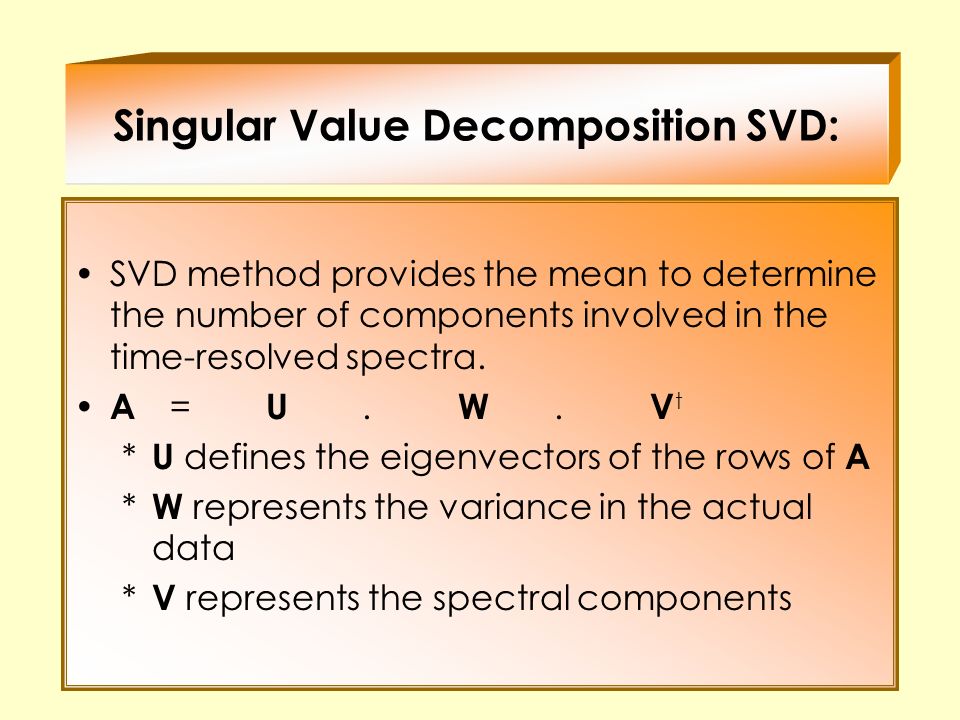
SVD method provides the mean to determine the number of components involved in the time-resolved spectra. A = U. W. V t * U defines the eigenvectors of the rows of A * W represents the variance in the actual data * V represents the spectral components Singular Value Decomposition SVD:

21
Thank U

Similar presentations


 School.>")


![Fourier transform infrared spectroscopy[FTIR]](/19/5905005/big_thumb.jpg "Fourier transform infrared spectroscopy[FTIR]>")
 Analysis One Dimensional NMRs 1 H NMR 13 C NMR.>")


