Download presentation
Presentation is loading. Please wait.

1
Nonlinear Spectroscopy: Characterizing Fluctuations Andrei Tokmakoff MIT Department of Chemistry 2009

2
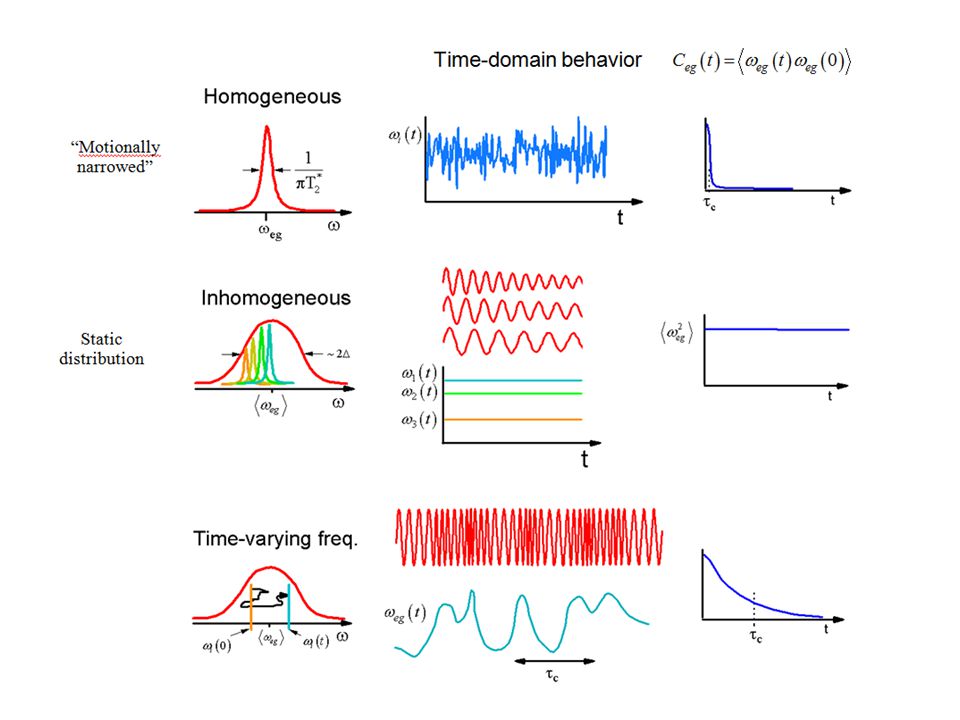
Fluctuations in lineshapes

3
System-Bath Interactions System: Spectroscopically Bright States Bath: Dark States → Energy Gap Fluctuations In spectroscopy … (Condon Approx.)
")
4
Energy Gap Fluctuations Energy Gap Correlation Function Dipole Correlation Function → Absorption lineshape Second Cumulant approx.

6
A bath of arbitrary form Spectral Density Brownian Oscillator Model

7
Nonlinear response for fluctuating system Following earlier approach: Cumulant approximation:

8
Two pulse echo ~1/

9
Two pulse echo

10
Lens analogy

11
Three pulse echoes: Peak shift

12
2D Lineshapes

13
Spectral Diffusion and Waiting Time

14
Time-domain 2D Spectroscopy

15
Time-Domain: Echo shape

16
2D IR Relaxation Experiment Probes Spectral Diffusion

17
Ellipticity

18
Correlation of Spectral Broadening

19
Correlation Effects in 2D IR Spectra

20
Correlated Energy Fluctuations Frequency Auto- and Cross-Correlation Functions:

Similar presentations
 and He + I 35 Cl( ,v † =0-2) Intermolecular Potential Energy Surfaces Joshua P. Darr and.>")


