Download presentation
Presentation is loading. Please wait.

1
Carbon-Climate Futures Coupled climate—vegetation models project dramatically different futures (CO 2, vegetation, T) using different ecosystem models. ~ 2º K in 2100 T=5 T=3 Coupled simulations of climate and the carbon cycle Slide: A.S. Denning CO 2 => 700 => 500

2
30S-30N 30N-60N 60N-90N CCSM3 coupled: Changes in land uptake of CO 2 All models show loss of C from tropical ecosystems in climate warming (E/P ). Some show increased uptake at mid- and high-latitudes. These results imply huge geopolitical impacts as well as climatic feedbacks. I. Fung

3
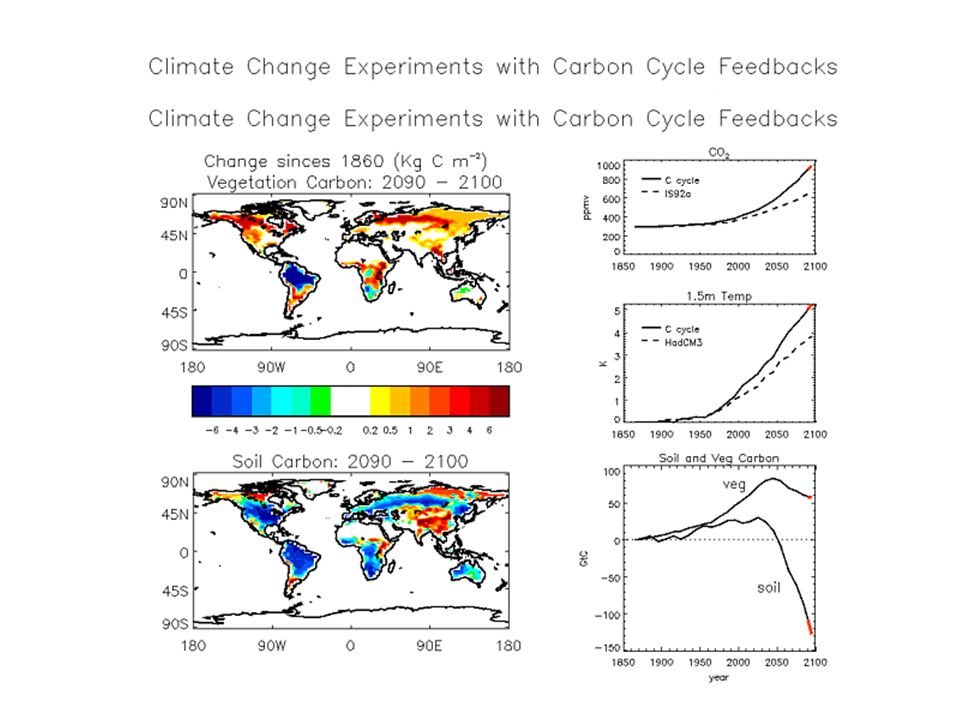
Betts et al. 2004 Cox et al. 2004 “Cox et al. (2000) describes this [accelerated warming ] as due to climate-driven dieback of the rainforest, resulting from a regional drying in Amazonia. Such a loss of rainforest would have catastrophic impacts on the biodiversity and 'ecosystem services' of Amazonia, similar to those anticipated under the most extreme scenarios of direct human deforestation (Nepstad et al.1999). It is therefore vital that we estimate the risk of climate-driven forest dieback, and identify any relevant thresholds in the climate-carbon cycle system.” [Cox et al. 2004]
 describes this [accelerated warming ] as due to climate-driven dieback of the rainforest, resulting from a regional drying in Amazonia. Such a loss of rainforest would have catastrophic impacts on the biodiversity and ecosystem services of Amazonia, similar to those anticipated under the most extreme scenarios of direct human deforestation (Nepstad et al.1999). It is therefore vital that we estimate the risk of climate-driven forest dieback, and identify any relevant thresholds in the climate-carbon cycle system. [Cox et al. 2004].")
4
Modelled Change in Vegetation Carbon 2100 - 1860

6
Simulation of the Current Climate and Vegetation State in the Hadley Climate-Carbon Cycle Model Observed Modelled

7
Correlation: { T, soil moisture index} CCSM1-Carbon Control Simulation DJFJJA Positive correlation warmer-wetter; or cooler-drier Negative correlation warmer-drier; or cooler-wetter slide courtesy Inez Fung [ I. Fung, S. Doney, K. Lindsay, J. John, P. Friedlingstein, 2005]

8
Figure 3. (b) Regression (in kg C/m 2 /K) of annual mean δNPP against annual mean δT air. δ is defined as the difference between experiments A2_ROL and A2_OL for the 21 st century. Fung et al. 2005.

Similar presentations


 Robert.>")


