Download presentation
Presentation is loading. Please wait.

1
Hierarchical statistical analysis of fMRI data across runs/sessions/subjects/studies using BRAINSTAT / FMRISTAT Jonathan Taylor, Stanford Keith Worsley, McGill

2
What is BRAINSTAT / FMRISTAT ? FMRISTAT is a Matlab fMRI stats analysis package BRAINSTAT is a Python version Main components: FMRILM: Linear model for %BOLD, AR(p) errors, bias correction, smoothing of autocorrelation to boost degrees of freedom (df)* MULTISTAT: Mixed effects linear model for contrasts from previous level in hierarchy, using ReML estimation, EM algorithm, smoothing of random/fixed effects sd to boost df* Key idea: IN: effect, sd, df, (fwhm) OUT: effect, sd, df, (fwhm) STAT_SUMMARY: best of Bonferroni, non-isotropic random field theory, DLM (Discrete Local Maxima)* *new theoretical results (T, W, et al., 2002, 2005, 2006) Treats magnitudes (%BOLD) and delays (sec) identically
 errors, bias correction, smoothing of autocorrelation to boost degrees of freedom (df)* MULTISTAT: Mixed effects linear model for contrasts from previous level in hierarchy, using ReML estimation, EM algorithm, smoothing of random/fixed effects sd to boost df* Key idea: IN: effect, sd, df, (fwhm) OUT: effect, sd, df, (fwhm) STAT_SUMMARY: best of Bonferroni, non-isotropic random field theory, DLM (Discrete Local Maxima)* *new theoretical results (T, W, et al., 2002, 2005, 2006) Treats magnitudes (%BOLD) and delays (sec) identically.")
3
0102030 0 50 100 FWHM acor 0102030 0 50 100 FWHM acor FMRILM: smoothing of temporal autocorrelation Hot stimulus Hot-warm stimulus Target = 100 df Residual df = 110 Target = 100 df Residual df = 110 FWHM = 10.3mmFWHM = 12.4mm df acor = df residual ( 2 + 1 ) 1 1 2 acor(contrast of data) 2 df eff df residual df acor FWHM acor 2 3/2 FWHM data 2 = + Variability in acor lowers df Df depends on contrast Smoothing acor brings df back up: Contrast of data, acor = 0.79 Contrast of data, acor = 0.61 FWHM data = 8.79 df eff
 acor(contrast of data) 2 df eff df residual df acor FWHM acor 2 3/2 FWHM data 2 = + Variability in acor lowers df Df depends on contrast Smoothing acor brings df back up: Contrast of data, acor = 0.79 Contrast of data, acor = 0.61 FWHM data = 8.79 df eff")
4
df ratio = df random ( 2 + 1 ) 1 1 1 df eff df ratio df fixed MULTISTAT: smoothing of random/fixed FX sd FWHM ratio 2 3/2 FWHM data 2 = + e.g. df random = 3, df fixed = 4 110 = 440, FWHM data = 8mm: 02040Infinity 0 100 200 300 400 FWHM ratio df eff random effects analysis, df eff = 3 fixed effects analysis, df eff = 440 Target = 100 df FWHM = 19mm

5
012345678910 0 0.02 0.04 0.06 0.08 0.1 0.12 GaussianT, 20 dfT, 10 df Bonferroni, N=Resels P-value FWHM of smoothing kernel (voxels) True Bonferroni Random Field Theory Discrete Local Maxima In between: use Discrete Local Maxima (DLM) STAT_SUMMARY High FWHM: use Random Field Theory Low FWHM: use Bonferroni DLM can ½ P-value when FWHM ~3 voxels
 True Bonferroni Random Field Theory Discrete Local Maxima In between: use Discrete Local Maxima (DLM) STAT_SUMMARY High FWHM: use Random Field Theory Low FWHM: use Bonferroni DLM can ½ P-value when FWHM ~3 voxels")
6
In between: use Discrete Local Maxima (DLM) 012345678910 3.7 3.8 3.9 4 4.1 4.2 4.3 4.4 4.5 4.6 4.7 Bonferroni, N=Resels Gaussian T, 20 df T, 10 df Gaussianized threshold FWHM of smoothing kernel (voxels) True Bonferroni Random Field Theory Discrete Local Maxima (DLM) STAT_SUMMARY High FWHM: use Random Field Theory Low FWHM: use Bonferroni
 Bonferroni, N=Resels Gaussian T, 20 df T, 10 df Gaussianized threshold FWHM of smoothing kernel (voxels) True Bonferroni Random Field Theory Discrete Local Maxima (DLM) STAT_SUMMARY High FWHM: use Random Field Theory Low FWHM: use Bonferroni")
8
STAT_SUMMARY example: single run, hot-warm Detected by DLM, but not by BON or RFT Detected by BON and DLM but not by RFT

9
-50510152025 -0.4 -0.2 0 0.2 0.4 0.6 t (seconds) Estimating the delay of the response Delay or latency to the peak of the HRF is approximated by a linear combination of two optimally chosen basis functions: HRF(t + shift) ~ basis 1 (t) w 1 (shift) + basis 2 (t) w 2 (shift) Convolve bases with the stimulus, then add to the linear model basis 1 basis 2 HRF shift delay
 Estimating the delay of the response Delay or latency to the peak of the HRF is approximated by a linear combination of two optimally chosen basis functions: HRF(t + shift) ~ basis 1 (t) w 1 (shift) + basis 2 (t) w 2 (shift) Convolve bases with the stimulus, then add to the linear model basis 1 basis 2 HRF shift delay")
10
Example: FIAC data 16 subjects 4 runs per subject 2 runs: event design 2 runs: block design 4 conditions Same sentence, same speaker Same sentence, different speaker Different sentence, same speaker Different sentence, different speaker 3T, 200 frames, TR=2.5s

11
Events Blocks Response Beginning of block/run

12
Design matrix for block expt B1, B2 are basis functions for magnitude and delay:

13
Motion and slice time correction (using FSL) 5 conditions Smoothing of temporal autocorrelation to control the effective df (new!) 1 st level analysis 3 contrasts Beginning of block/run Same sent, same speak Same sent, diff speak Diff sent, same speak Diff sent, diff speak Sentence0-0.5 0.5 Speaker0-0.50.5-0.50.5 Interaction01 1
 5 conditions Smoothing of temporal autocorrelation to control the effective df (new!) 1 st level analysis 3 contrasts Beginning of block/run Same sent, same speak Same sent, diff speak Diff sent, same speak Diff sent, diff speak Sentence Speaker Interaction01 1")
14
Sd of contrasts (lower is better) for a single run, assuming additivity of responses For the magnitudes, event and block have similar efficiency For the delays, event is much better. Efficiency

15
2 nd level analysis Analyse events and blocks separately Register contrasts to Talairach (using FSL) Bad registration on 2 subjects - dropped Combine 2 runs using fixed FX Combine remaining 14 subjects using random FX 3 contrasts × event/block × magnitude/delay = 12 Threshold using best of Bonferroni, random field theory, and discrete local maxima (new!) 3 rd level analysis
 Bad registration on 2 subjects - dropped Combine 2 runs using fixed FX Combine remaining 14 subjects using random FX 3 contrasts × event/block × magnitude/delay = 12 Threshold using best of Bonferroni, random field theory, and discrete local maxima (new!) 3 rd level analysis")
16
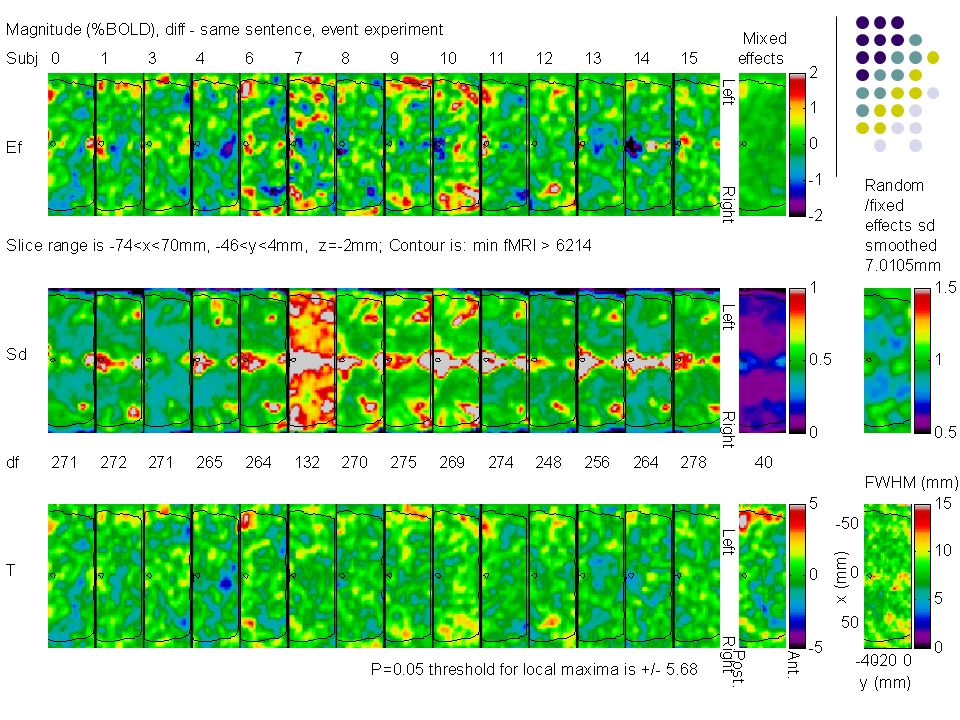
Part of slice z = -2 mm

21
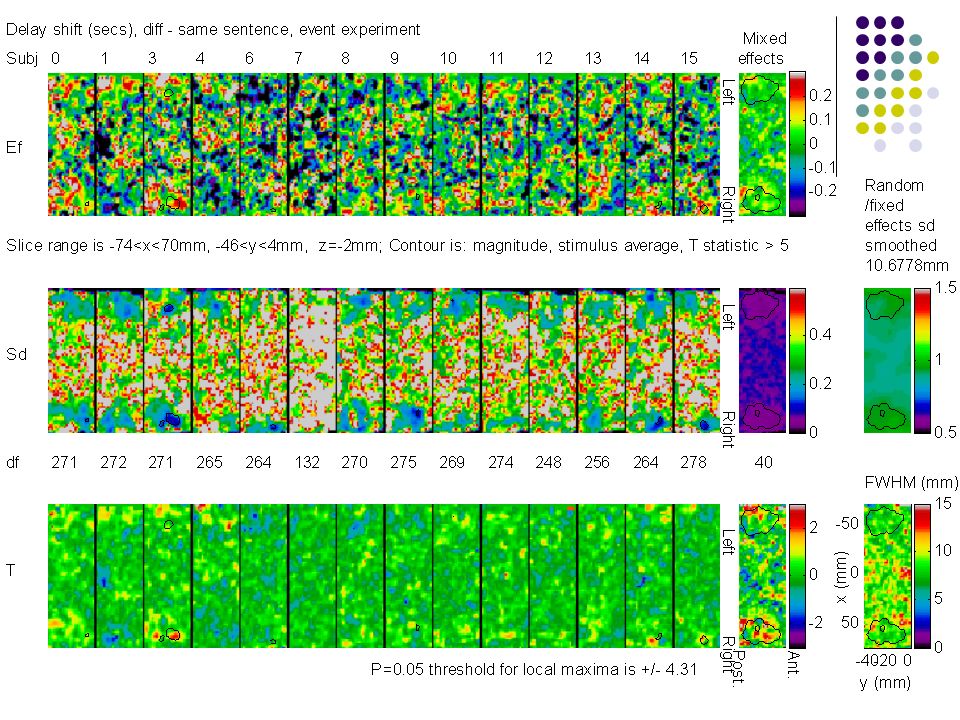
Magnitude EventBlock Delay

22
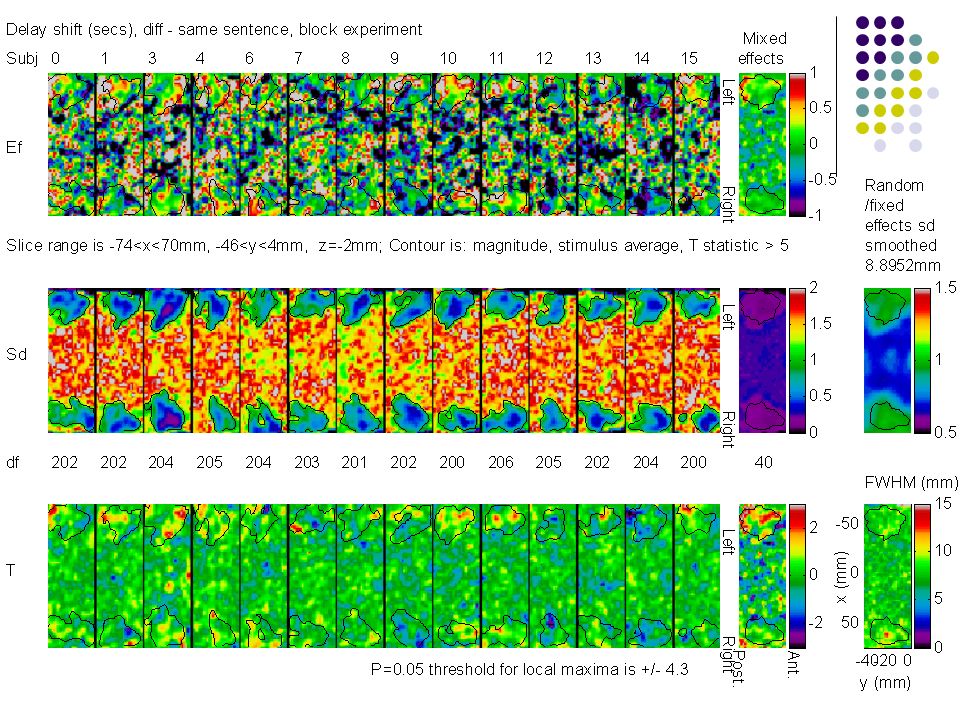
Events: 0.14±0.04s; Blocks: 1.19±0.23s Both significant, P<0.05 (corrected) (!?!) Answer: take a look at blocks: Events vs blocks for delays in different – same sentence Different sentence (sustained interest) Same sentence (lose interest) Best fitting block Greater magnitude Greater delay
 (! !) Answer: take a look at blocks: Events vs blocks for delays in different – same sentence Different sentence (sustained interest) Same sentence (lose interest) Best fitting block Greater magnitude Greater delay")
23
SPM BRAINSTAT

24
Magnitude increase for Sentence, Event Sentence, Block Sentence, Combined Speaker, Combined at (-54,-14,-2)
")
25
Magnitude decrease for Sentence, Block Sentence, Combined at (-54,-54,40)
")
26
Delay increase for Sentence, Event at (58,-18,2) inside the region where all conditions are activated
 inside the region where all conditions are activated")
27
Conclusions Greater %BOLD response for different – same sentences (1.08±0.16%) different – same speaker (0.47±0.0.8%) Greater latency for different – same sentences (0.148±0.035 secs)
 different – same speaker (0.47±0.0.8%) Greater latency for different – same sentences (0.148±0.035 secs)")
28
z=-12z=2z=5 3 1,4 2 1 3 3 3 1 3 The main effects of sentence repetition (in red) and of speaker repetition (in blue). 1: Meriaux et al, Madic; 2: Goebel et al, Brain voyager; 3: Beckman et al, FSL; 4: Dehaene-Lambertz et al, SPM2. Brainstat: combined block and event, threshold at T>5.67, P<0.05.

Similar presentations


 forms a basis according to which.>")


>")


 Calculates P=0.05 (corrected) threshold t for the T statistic using the minimum given by a Bonferroni correction and.>")


