Download presentation
Presentation is loading. Please wait.

1
Laura Bahorich, Zoey Benally, Crystal Bennett & James Nance Mentors: Graham Hickling, PhD, Suzanne Lenhart, PhD, http://www.ag.auburn.edu/aaes/ communications/highlights/fall00 /images/tickone.gif Modeling a Lone Star Tick (Amblyomma americanum) population for effective disease management Crystal Bennett NC A&T State University
 population for effective disease management Crystal Bennett NC A&T State University")
2
Outline Goals Background Methods Model Conclusion

3
What’s the Problem? Lone Star Ticks are the most common tick species in TN Aggressive – actively seek out & bite hosts All life stages can transmit diseases to humans http://farm1.static.flickr.com/78/197572898_ddccb25d15.jpg?v=0

4
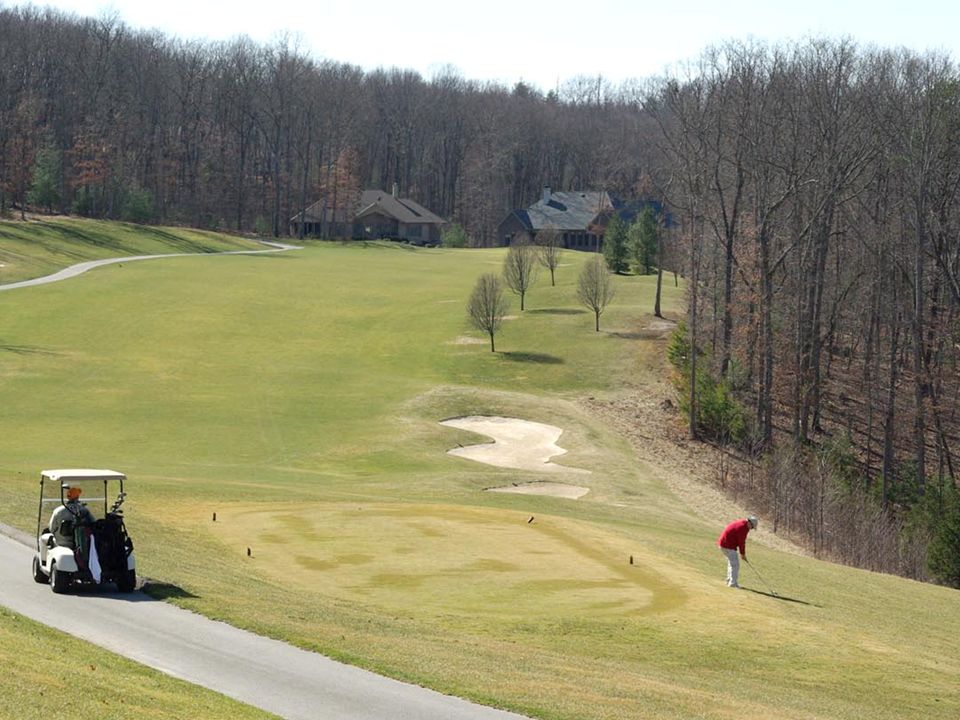
Goals To model the lifecycle of the Lone Star Tick within the Fairfield Glade (FFG) retirement community To determine a cost- effective layout of 4- poster feeders to reduce disease caused by Lone Star Ticks http://www.sciencedaily.com/releases/2009/03/090328152625.htm
 retirement community To determine a cost- effective layout of 4- poster feeders to reduce disease caused by Lone Star Ticks")
5
Background Lone Star Ticks vector disease 10 pathogens isolated, Ehrlichia chaffeensis is the most important White-Tailed Deer are the ticks’ natural host Egg Larva Nymph Adult Egg 3 blood meals during life cycle, usually on deer Spend 95% of time off host http://www.umass.edu/umhome/images/upload/83388/tularemia_lone_star_tick-sm.jpg

6
Background http://entomology.unl.edu/images/ticks/lonestar_stages.jpg

7
Deer Infested by Ticks http://deeralliance.com/FCKeditor/UserFiles/Image/Tick%20Deer%20ears%20.jpg

8
4-Poster System Management strategy targets ticks on deer Bait feeder plus acaricide Systemic vs. topical 7 - 9 feeders in use at FFG Cost is ~$16,000 annually Feeders have achieved close to 100% reduction in tick numbers at other locations Tick numbers remain high around FFG feeders http://www.sciencedaily.com/releases/2009/03/090328152625.htm

9
Ehrlichiosis Ehrlichia chaffeensis – Human monocytic ehrlichiosis (HME) Bacteria enter blood when tick feeds Symptoms – fever, malaise, leukopenia, thrombocytopenia Median age 55 Disease we’re focusing on… Actually w/in WBCs. Bacteria enters host blood when the tick is feeding. Explain WBCs Older & immuno-compromised have fewer WBC, therefore see a more severe disease in the end. Very generic symptoms. Antibiotics are used to manage the disease. More prevalent in older populations. More important in Fairfield Glade because a majority of the residents are w/in age group. http://www.nature.com/modpathol/journal/v17/n5/thumbs/3800075f1th.jpg

10
Average annual incidence of Ehrlichiosis (caused by Ehrlichia chaffeensis) by state, 2001--2002 http://www.cdc.gov/ticks/diseases/ehrlichiosis/statistics.html
 by state,")
11
Number of Ehrlichiosis cases in US (caused by Ehrlichia chaffeensis), 1999-2006 http://www.cdc.gov/ticks/diseases/ehrlichiosis/statistics.html
,")
13
Fairfield Glade Outbreak

14
Crossville Fairfield Glade Catoosa WMA

16
Spring Fall Summer Winter 16

17
Monthly Lone Star Tick Rates

18
Methods Discrete Time Model of A. americanum in FFG Based on 7 life stages Using MATLAB to run a simulation model for 4 years Monthly time step begins in April Overwintering of unfed nymphs & unfed adults Eggs laid by overwintering fed adult population Compare to field data collected at FFG

19
Model Coefficients and Rates Obtained from Haile and Mount (1987) “Computer Simulation of Population Dynamics of the Lone Star Tick, Amblyomma americanum” – some were adjusted to fit the Fairfield Glade data. Mortality and host-finding rates based on temperature and humidity Sex ratio of 1:1 Females lay 5,000 eggs

20
Temporal Component of Model Assumptions: Eggs, unfed adults, and unfed nymphs start each year 52% of laid eggs hatch in 2 months Disease risk is assumed to be correlated with tick numbers Constant deer population Features: Host Finding and Mortality Rates Seven stages: eggs, unfed larvae, fed larvae, unfed nymphs, fed nymphs, unfed adults, fed adults Initial Conditions: 25,000 eggs, 150 unfed nymphs, 60 unfed adults Less if the area is residential

21
Sample Equations Fed Nymphs fn(k+1) = ohsr n * hfr n (p) * un(k) Unfed Adults ua(k+1) = ua(k) * (1-.14) - hfr a (p) * ua(k) +.85 * fn(k)
 = ohsr n * hfr n (p) * un(k) Unfed Adults ua(k+1) = ua(k) * (1-.14) - hfr a (p) * ua(k) +.85 * fn(k)")
22
Sample Output Eggs & Larvae Adults Time in months Nymphs

23
Preliminary Spatial Model Divide FFG into a 10 x 8 grid Categorize grid squares as ‘Developed’ or ‘Undeveloped’ A tick model runs in each grid square A specified number of feeders, with a specified layout, are added to the grid

24
Feeder position affects on-host tick survival In each grid square position (i,j): Area Type affects initial conditions, Developed and Undeveloped. Feeder proximity affects on-host survival rate (nearby, in square, or none). (i,j) D D 0% U DU 50% U UU 95% U RESULT:
. (i,j) D D 0% U DU 50% U UU 95% U RESULT:.")
25
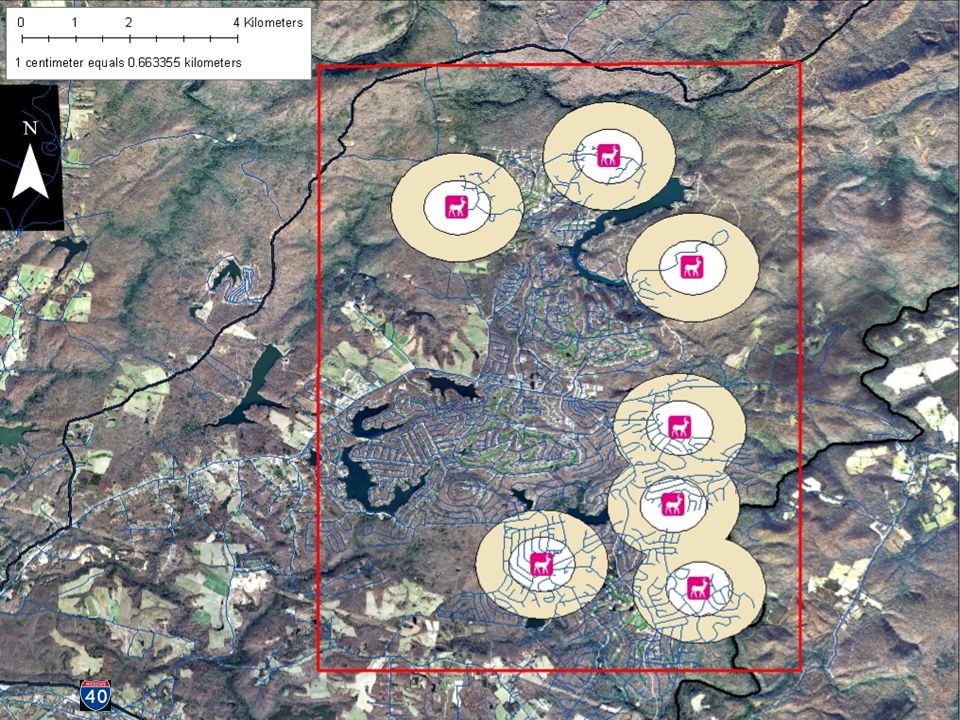
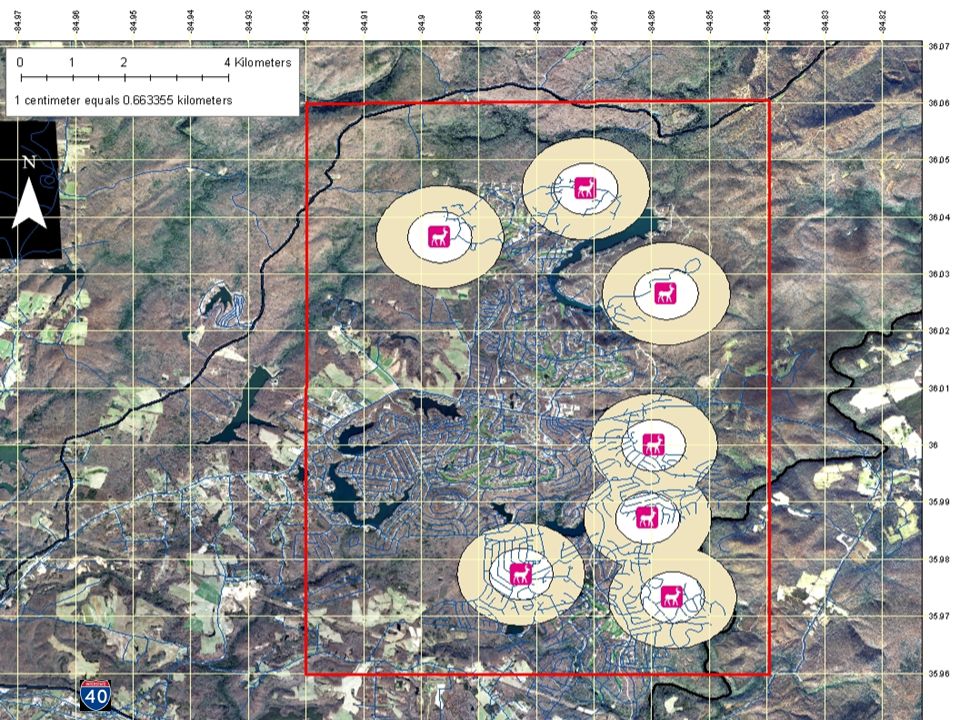
Current Feeder Locations

28
Feeder position affects on-host tick survival CODE:

29
Economic Component AIM: Choose feeder layout to minimize the expected total cost of disease cases plus the feeder program Ehrlichia Treatment = $10,000/case Feeder Maintenance = $2,000/year Example: if 12 feeders reduced ticks by 40% then: (Base number of cases is 10 per year) TOTAL COST = (6 cases x $10,000) + (12 feeders x $2000) = $60,000 disease + $24,000 feeders = $84,000
 TOTAL COST = (6 cases x $10,000) + (12 feeders x $2000) = $60,000 disease + $24,000 feeders = $84,000")
30
Economic Component Compare the reduction in tick population achieved in year 4 with current Feeder arrangement to the reduction achieved with a more strategic layout Year 4 without feeders Year 4 with feeders

31
Four Scenarios - Modeled Effect of Feeder Number on %Tick Population

32
Scenario Analysis

33
Conclusions (continued)
")
34
Conclusions Practical objective of making tick management suggestions to FFG First goal was to understand the biology to build a discrete time model Second goal was to construct a spatial & temporal model to assist with assessing cost-effective efficient layouts for the 4-posters Reducing tick numbers may help to prevent future Ehrlichiosis outbreaks Completed a small number of scenario analyses Aim to investigate the full optimization problem

35
Conclusions (continued) Reducing tick numbers may help to prevent future Ehrlichiosis outbreaks Completed a small number of scenario analyses Aim to investigate the full optimization problem
 Reducing tick numbers may help to prevent future Ehrlichiosis outbreaks Completed a small number of scenario analyses Aim to investigate the full optimization problem")
36
Acknowledgements Dr. Graham Hickling and Suzanne Lenhart NIMBioS Dr. Greg Goins and Thomas Redd NC A&T U. NSF UBM Grant # 634598

Similar presentations