Download presentation
Presentation is loading. Please wait.

1
1 Why do we need better European information on water availability and water abstraction? Thematic Eionet Workshop 'Water Quantity and Use‘ Tuesday & Wednesday 10-11 June 2008 Peter Kristensen, EEA

2
2 More focus on water scarcity and drought In recent years, a growing concern has been expressed throughout the EU regarding water scarcity and drought events. For an increasing number of EU Member States the occurrence of seasonal or longer term droughts and water scarcity situations have become a noticeable reality in recent years. European Commission carried out an assessment of water scarcity and drought in 2006 and early 2007 Commission adopted a Communication: Addressing the challenge of water scarcity and droughts in the European Unio on 18 July 2007. High data gaps and data uncertainty in estimating water availability, and water abstraction at European level.

3
3 Water scarcity and drought communication 18 July Communication from the Commission to the European Parliament and the Council - Addressing the challenge of water scarcity and droughts in the European Union {SEC(2007) 993} {SEC(2007) 996} 2.7. Improve knowledge and data collection 2.7.1. A water scarcity and drought information system throughout Europe The issue: Reliable information on the extent and impacts of water scarcity and droughts is indispensable for decision-making at all levels. Shared definitions are necessary to ensure data consistency at EU level. The recently published Water Information System for Europe (WISE) provides the ideal platform to integrate and disseminate such information. Way forward: Present an annual European assessment, based on agreed indicators and data provided by Member States and stakeholders to the Commission or the European Environment Agency on a yearly basis. Fully exploit the Global Monitoring for Environment and Security (GMES) services for the delivery of space-based data and monitoring tools in support to water policies, land use planning and improved irrigation practices.
 provides the ideal platform to integrate and disseminate such information. Way forward: Present an annual European assessment, based on agreed indicators and data provided by Member States and stakeholders to the Commission or the European Environment Agency on a yearly basis. Fully exploit the Global Monitoring for Environment and Security (GMES) services for the delivery of space-based data and monitoring tools in support to water policies, land use planning and improved irrigation practices..")
4
4 Droughts in Europe Source: Tallaksen L. 2007: http://www.geo.uio.no/for_skolen/lena-torke.pdfhttp://www.geo.uio.no/for_skolen/lena-torke.pdf

5
5 Drought in Denmark Source: http://www.dmi.dk/dmi/index/danmark/torkeindex.htm http://www.dmi.dk/dmi/index/danmark/torkeindex.htm

6
6 European information needed in relation to water scarcity and drought should describe: How much is there? (Runoff, availability, demands, water stress.........) Getting better or worse? Pressures on the environment (abstraction and water use by sectors) Are they working towards targets? such as are water- pricing policies used to provide adequate incentives for users to use water resources efficiently In addition, information on how climate change may affect water availability and change in run-off and flow regimes, and the demand for water are also relevant. Without countries and regional authorities there would be no data at European scale ….
 Getting better or worse. Pressures on the environment (abstraction and water use by sectors) Are they working towards targets. such as are water- pricing policies used to provide adequate incentives for users to use water resources efficiently In addition, information on how climate change may affect water availability and change in run-off and flow regimes, and the demand for water are also relevant. Without countries and regional authorities there would be no data at European scale …..")
7
7 The quality of European water scarcity data collections and assessments are affected by the following issues: Problems with timeliness of the data used at European level Current data flows are only covering part of the information needed for European assessments (country aggregated averages on an annual time scale). European assessments are not taking enough stock of results and analysis at national and RBD level Lack of harmonization in estimation and quality assurance methodologies.

8
8 Problems with timeliness of the data Eurostat data table

9
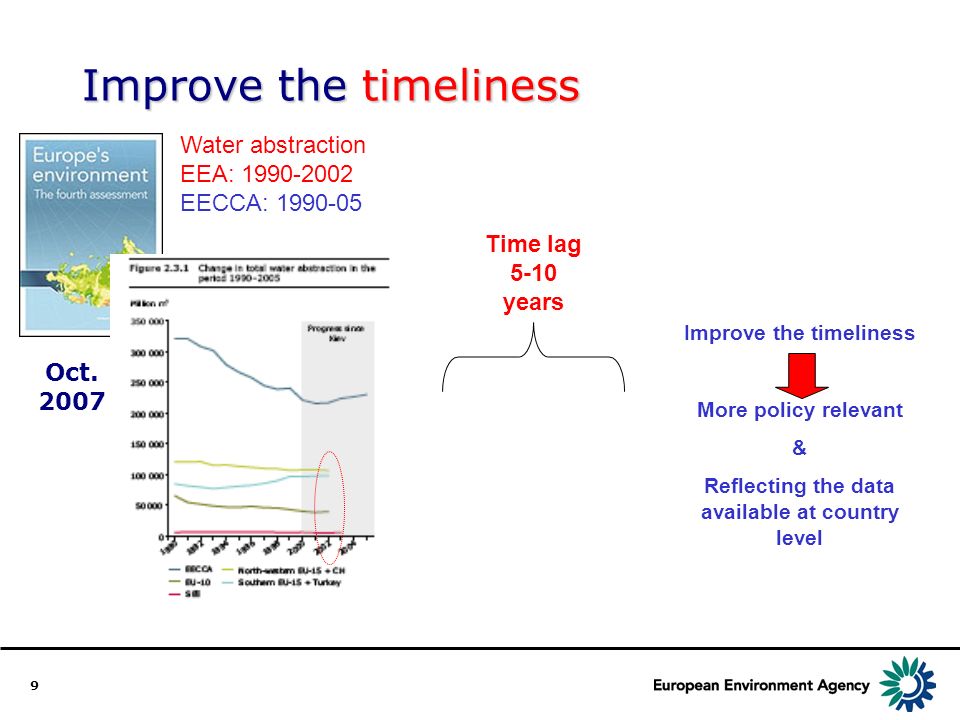
9 Improve the timeliness Time lag 5-10 years Water abstraction EEA: 1990-2002 EECCA: 1990-05 Improve the timeliness More policy relevant & Reflecting the data available at country level Oct. 2007
10
10 In most cases data are more up-to- date at national sites Bulgaria Eurostat 2005 – BG 2006BG 2006 Denmark Eurostat 2002/04 – DK 2005DK 2005 Germany Eurostat 2001 – DE 2004DE 2004 Estonia Eurostat 2002 – EE 2006EE 2006 France Eurostat 2002 – FR 2004FR 2004 Spain Eurostat 2004 – ES 2005ES 2005 Latvia Eurostat 2005 – LV 2006LV 2006 Lithuania Eurostat 2005 – LT 2006LT 2006 The Netherlands Eurostat 1996/01 – NL 2005NL 2005

11
11 Many data gaps

12
12 Lack of harmonization in methodologies

13
13 Lack of harmonization in methodologies Fish farms Irrigation

14
14 Only country data are available in European data sets Source: Eurostat 2003 Water resources, abstraction and use in European countries Country raster Water use intensity = Water exploitation index Pie charts Abstractions from surface and groundwater

15
15 – but much regional information is already available National water statistics Data available for administrative regions Data available for hydrological units Water Framework Directive Data being produced at RBD level

16
16 National water statistics Data available for administrative regions Data available for hydrological units France – Ifen Données régionales– Ifen Données régionales Spain – INES Autonomous communities – INES Sweden – Statistics Sweden RBD districtsStatistics Sweden Poland – Env. Stat.07 Hydrographic regionsEnv. Stat.07 Germany – Statistisches Bundesamt – PWS by RBDs Eurostats presentation tomorrow

17
17

18
18 Need for regional data – Example specific water abstraction for irrigation (m3/ha ) Source: RNDE 2004: Les prélèvements d’eau en France en 2001 Version 3
 Source: RNDE 2004: Les prélèvements d’eau en France en 2001 Version 3")
19
19 Seasonality Weser Jucar

20
20 Seasonality in precipitation, runoff etc. Total fresh water resources are unevenly distributed across Europe. Europe has three types of climates: The extreme north (Iceland, northern Sweden and Finland) which has a subarctic climate (cold and relatively dry), the temperate oceanic, with rainfall throughout the year, with a transition to a more continental climate with wider contrasts in temperature and rainfall, and with more marked seasons in central Europe, at altitude (the Alps) and in northern Europe. Mediterranean, with dry summers and rainfall in autumn and spring. Therefore, with the triple influences of latitude, topography and distance from the sea, the distribution of run-off in the region is very diverse 50-65 % of precipitation in summer half year 18-38 % of precipitation in summer half year
 which has a subarctic climate (cold and relatively dry), the temperate oceanic, with rainfall throughout the year, with a transition to a more continental climate with wider contrasts in temperature and rainfall, and with more marked seasons in central Europe, at altitude (the Alps) and in northern Europe. Mediterranean, with dry summers and rainfall in autumn and spring. Therefore, with the triple influences of latitude, topography and distance from the sea, the distribution of run-off in the region is very diverse % of precipitation in summer half year % of precipitation in summer half year.")
21
21 Data being produced at RBD/RB level RBD Article 5 Reports RBMP Water balance Water abstraction Danube

22
22 Data being produced at RBD/RB level Danube Elbe Oder Czech Republic Article 5 report 4. Economic analysis Water abstraction per RBD

23
23 From RBD information to European overview RBD/RB information RBD/RB information RBD/RB information

24
24 From RBD information to European overview RBD/RB information RBD/RB information RBD/RB information MS: Sensitive catchments – EEA calculated WEI Source: CEC 200: 2nd interim report

25
25 From RBD information to European overview Adm. reg. information RBD/RB information Current: Country data on water abstraction distributed by regional/nuts02 irrigated area – in the future data provided on disaggregated spatial scale

26
26 Reservoir capacity To ensure water supply for a variety of purposes most European countries have built reservoirs with a total capacity of about 1400 km3 or 20% of LTAA.

27
27 Over-exploited aquifers and saltwater intrussion RBD/RB information RBD/RB information Source: EEA & Plan Bleu 2005: A Sustainable Future for the Mediterranean

28
28 Water transfers RBD information RBD information Source: Plan Bleu 2005: A Sustainable Future for the Mediterranean

29
29 Summary High data gaps and data uncertainty in estimating water availability, and water abstraction at European level Problems with timeliness of the data used at European level Current data flows are only covering part of the information needed for European assessments (country aggregated averages on an annual time scale). European assessments are not taking enough stock of results and analysis at national and RBD level Lack of harmonization in estimation and quality assurance methodologies. Better reporting (more timely, disaggregated in spatial and temporal scale) will give more reliable European data and assessments and they will be more policy relvant.
 will give more reliable European data and assessments and they will be more policy relvant..")
Similar presentations


