Download presentation
Presentation is loading. Please wait.

1
J. Peter Rosenfeld, John Meixner, Michael Winograd, Elena Labkovsky, Alex Haynes, Northwestern University

3
http://images.google.com/images?s ourceid=navclient&rlz=1T4SUNA_e nUS225US225&q=event+related+po tentials&um=1&ie=UTF- 8&ei=KCFySszOII7UMsijgLEM&sa= X&oi=image_result_group&ct=title& resnum=4

4
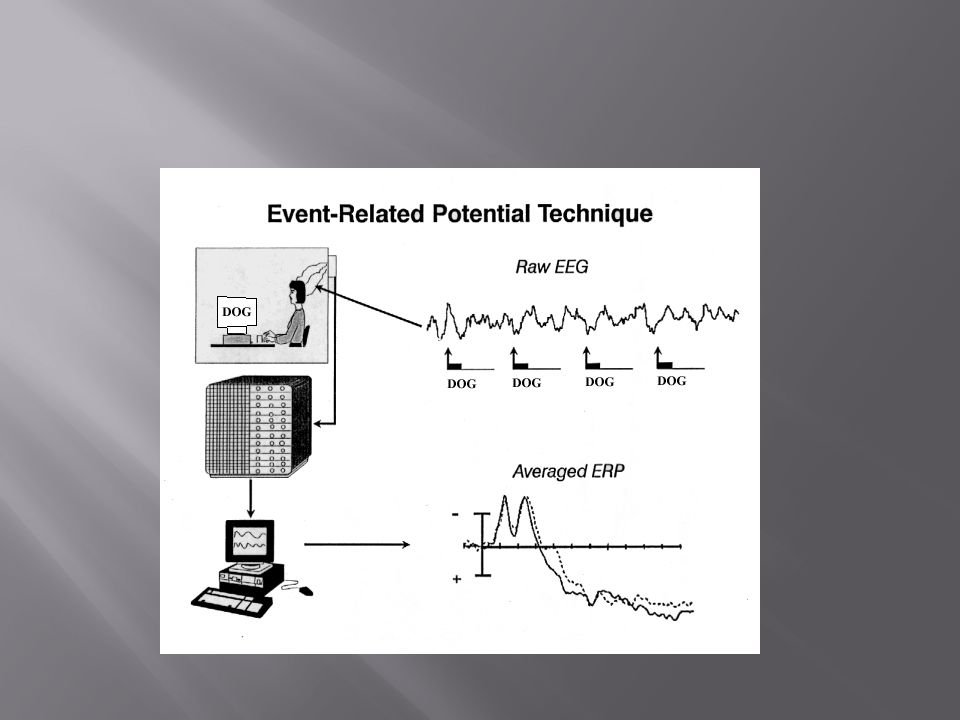
Each is called a component. The earliest waves represent the sensory information reaching specific sensory cortex from lateral pathways. Each wave/component represents the discharge of a certain synaptic organization. The next set of waves represents the sensory information mediated via medial reticular pathways. Both kinds of components are “exogenous” ERPs, because they represent external, sensory info. These exogenous ERPs are also called (stimulus-) evoked potentials. People used that term to describe all time-locked EEG events, but then when the endogenous and motor potentials were encountered, Herbert Vaughn coined the more general ERP term.
 evoked potentials. People used that term to describe all time-locked EEG events, but then when the endogenous and motor potentials were encountered, Herbert Vaughn coined the more general ERP term..")
5
These are the latest (in msec) set of waves or components in the ERP, and are of most interest to PSYCHOphysiologists, because they represent psychological reactions to externally presented but meaningful stimuli. There are not that many, maybe 5 or 6 discovered to date, though folks argue about the number.

6
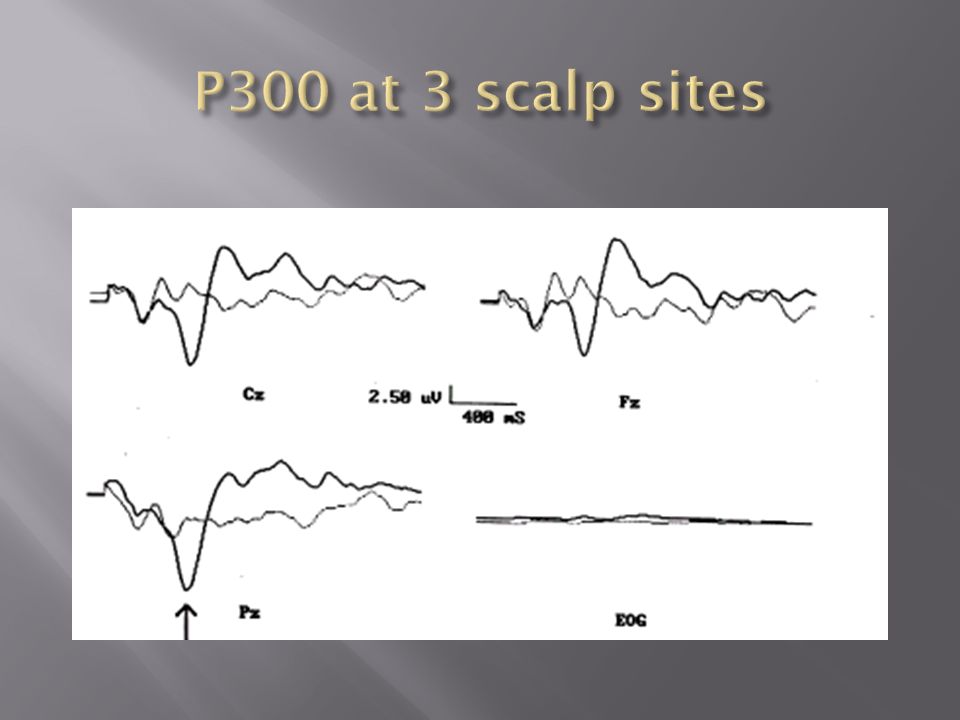
An Endogenous, Event-Related Potential (ERP) Positive polarity (down in Illinois). Latency range: 300-1000 msec varies with stimulus complexity/evaluation time Typical Scalp Amplitude(Amp) Map Pz > Cz > Fz Amp = f(stim. probability, meaningfulness)
 Map Pz > Cz > Fz Amp = f(stim. probability, meaningfulness).")
8
PROBE: GUILTY KNOWLEDGE ITEM: $5000 Press non-target button. IRRELEVANT: OTHER AMOUNT: $200 Press non-target button. TARGET: OTHER AMOUNT: $3000 Press target button.

9
80% to 95% correct detection rates….but…. *Rosenfeld et al. (2004) and Mertens, Allen et al. (2008):These methods are vulnerable to Counter-measures (CMs) via turning I’s into covert T’s.
 and Mertens, Allen et al. (2008):These methods are vulnerable to Counter-measures (CMs) via turning I’s into covert T’s..")
10
1 of 3 Stimuli on each trial: Probe (P), or Irrelevant(I), or Target (T). Subject presses either Target or Non-Target (NT) button. Both P and I can be Non-Targets. Special I is defined T. This leads to 2 tasks for each stimulus: 1. implicit probe recognition vs. 2. explicit Target/Non-Target discrimination Possible Result: Mutual Interference more task demand reduced P300 to P. CMs hurt Old test. A CM is an attempt to defeat the test by converting irrelevants into covert targets
 button. Both P and I can be Non-Targets. Special I is defined T. This leads to 2 tasks for each stimulus: 1. implicit probe recognition vs. 2. explicit Target/Non-Target discrimination Possible Result: Mutual Interference more task demand reduced P300 to P. CMs hurt Old test. A CM is an attempt to defeat the test by converting irrelevants into covert targets.")
11
Results from Rosenfeld et al. (2004): Farwell-Donchin paradigm (BAD and BCAD are 2 analysis methods.) Diagnoses of Guilty Guilty Group Innocent Group CM Group 9/11(82 %) 1/11(9%) 2/11(18%) Amplitude Difference (BAD) method,p=.1 Cross-Correlation(BC-AD ) Method, p=.1 6/11(54 %) 0/11(0%) 6/11(54 %)
: Farwell-Donchin paradigm (BAD and BCAD are 2 analysis methods.) Diagnoses of Guilty Guilty Group Innocent Group CM Group 9/11(82 %) 1/11(9%) 2/11(18%) Amplitude Difference (BAD) method,p=.1 Cross-Correlation(BC-AD ) Method, p=.1 6/11(54 %) 0/11(0%) 6/11(54 %).")
12
Week BAD* BC-AD* 1: no CM 12/13(.92) 9/13(.69) 2: CM 6/12(.50) 3/12(.25) 3: no CM 7/12(.58) 3/12(.25) *Note: BCD and BAD are 2 kinds of analytic bootstrap procedures.
 9/13(.69) 2: CM 6/12(.50) 3/12(.25) 3: no CM 7/12(.58) 3/12(.25) *Note: BCD and BAD are 2 kinds of analytic bootstrap procedures.")
15
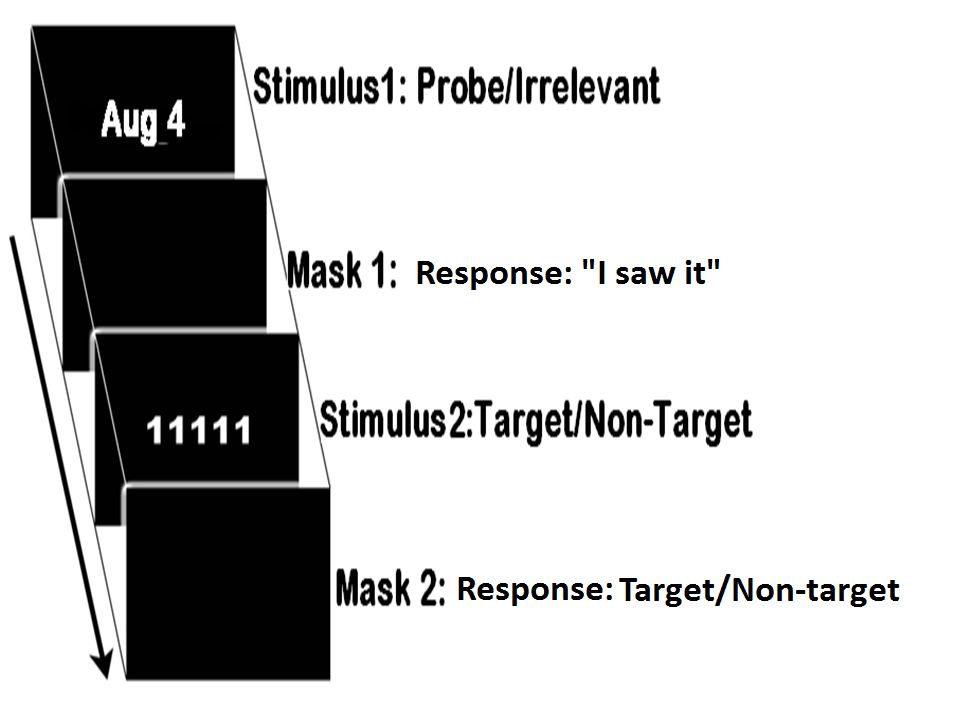
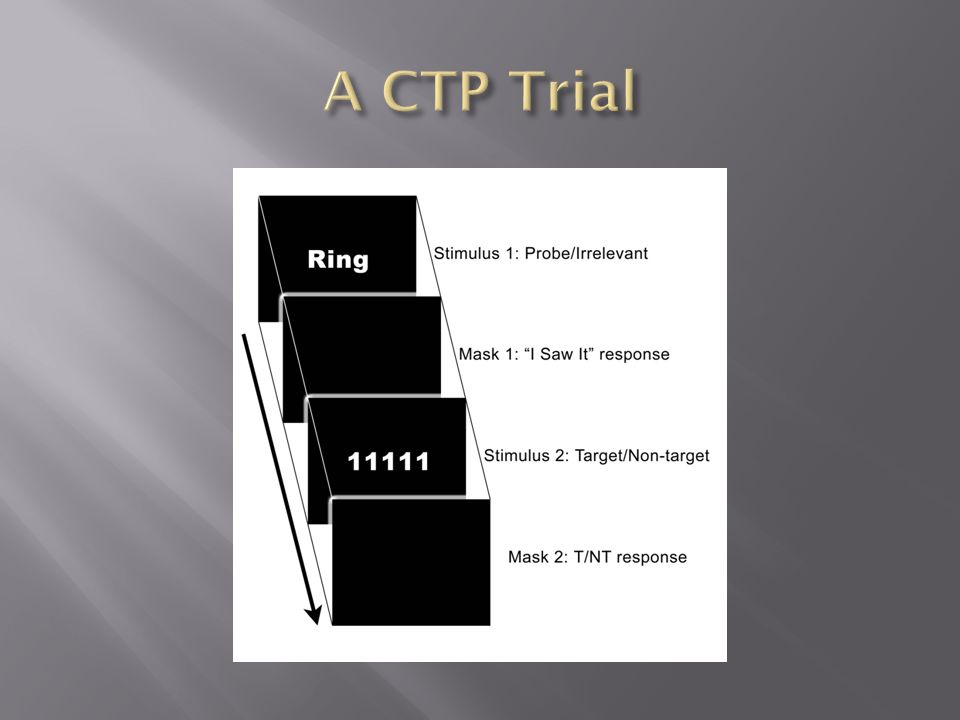
2 stimuli, separated by about 1 s, per trial, S1; Either P or I…..then…..S2 ; either T or NT. *There is no conflicting discrimination task when P is presented, so P300 to probe is expected to be as large as possible due to P’s salience, which should lead to good detection; 90-100 % in Rosenfeld et al.(2008) with autobiographical information. It is also CM resistant. (Delayed T/NT still holds attention.) * “I saw it” response to S1. RT indexes CM use.
 with autobiographical information. It is also CM resistant. (Delayed T/NT still holds attention.) * I saw it response to S1. RT indexes CM use..")
16
WEEK Hit Rate [Hit Rate] Week 1 (no CM): 11/12 (92%) [12/12*( 100%)] Week 2 (CM): 10/11 (91%) [11/12* (92%)] Week 3 (no CM): 11/12 (92%) [12/12* (100%)] Main Study: With false positive(FP) group. Confidence=.9 Confidence=.95 Test FPs Hits A’ FPs Hits A’ Iall.08.92.95 0.92.98 Imax 0.92.98 0.92.98
![ WEEK Hit Rate [Hit Rate] Week 1 (no CM): 11/12 (92%) [12/12*( 100%)] Week 2 (CM): 10/11 (91%) [11/12* (92%)] Week 3 (no CM): 11/12 (92%) [12/12* (100%)] Main Study: With false positive(FP) group.](http://images.slideplayer.com/32/10042753/slides/slide_16.jpg " Confidence=.9 Confidence=.95 Test FPs Hits A’ FPs Hits A’ Iall Imax .")
17
Subjects were divided into three groups (n=12) Simple Guilty (SG), Countermeasure (CM), and Innocent Control (IC) All subjects first participated in a baseline reaction time (RT) test in which they chose a playing card and then completed the CTP using cards as stimuli. SG and CM subjects then committed a mock crime. Subjects stole a ring out of an envelope in a professor’s mailbox. Subjects were never told what the item would be, to ensure any knowledge would be incidentally acquired through the commission of the mock crime. All subjects were then tested for knowledge of the item that was stolen. There were 1 P (the ring) and 6 I( necklace,watch,etc). CM subjects executed covert assigned responses to irrelevant stimuli in an attempt to evoke P300s to these stimuli to try and beat the Probe vs. Irrelevant P300 comparison.
 and 6 I( necklace,watch,etc). CM subjects executed covert assigned responses to irrelevant stimuli in an attempt to evoke P300s to these stimuli to try and beat the Probe vs. Irrelevant P300 comparison..")
20
Condition Detections Percentage SG 10/12 83 CM 12/12 100 IC 1/12 8

23
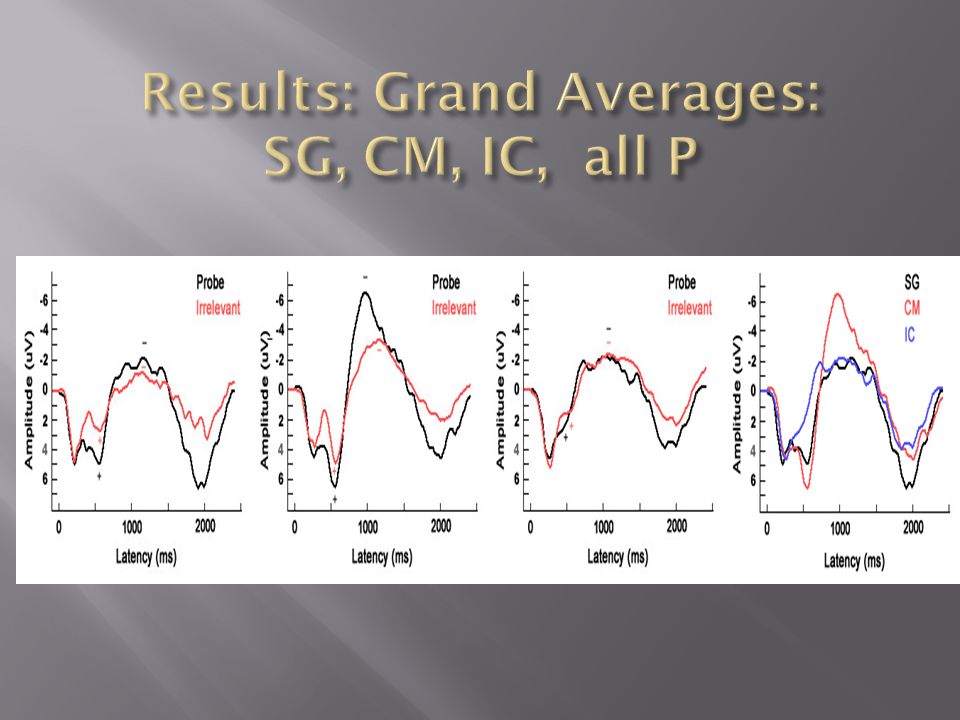
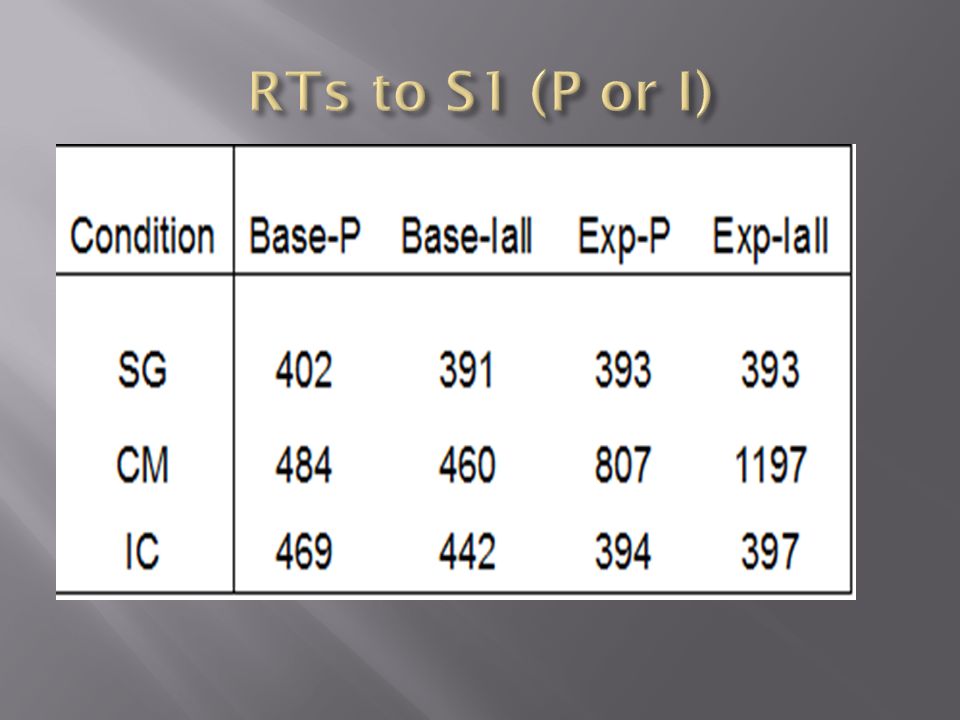
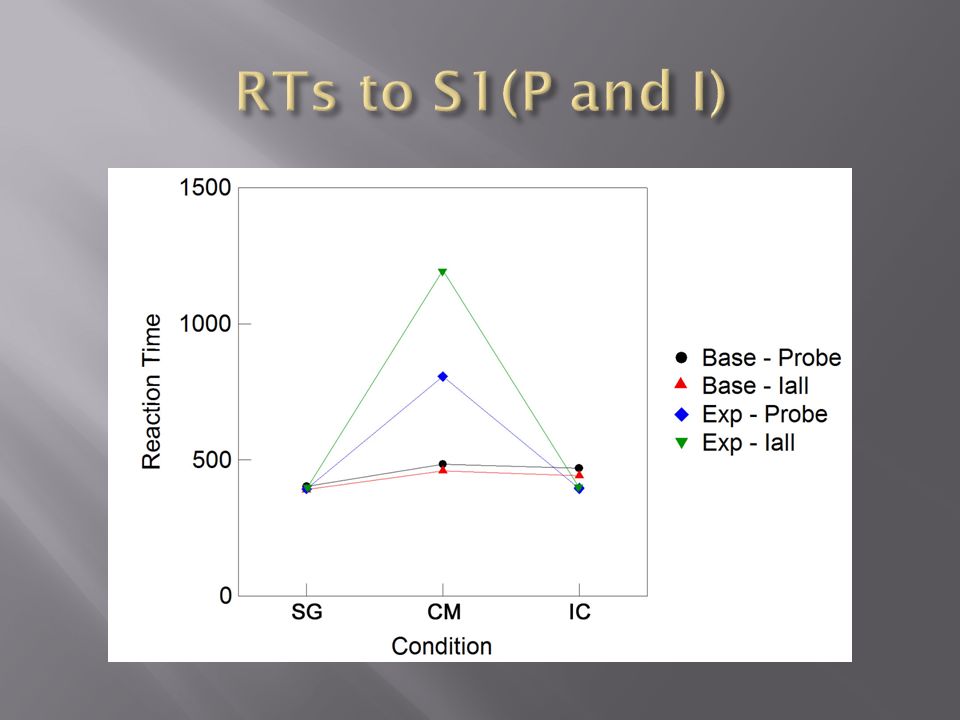
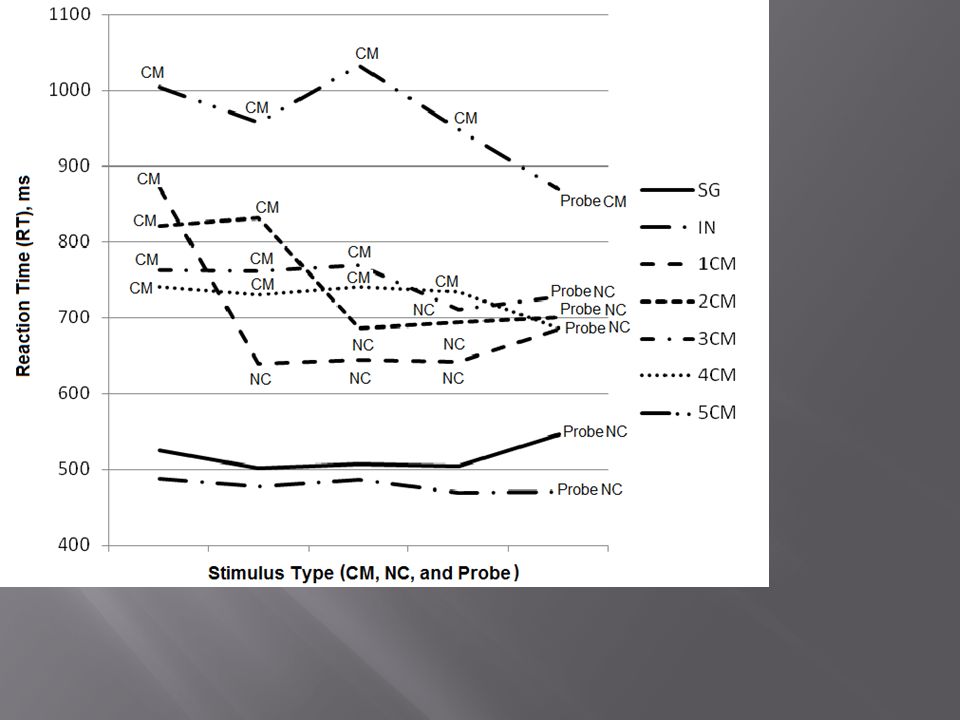
A 3x2 (Condition x Stimulus Type) repeated measures ANOVA in the experimental block showed a main effect of condition, F(2,33) = 58.3, p <.001, stimulus type, F(1,33) = 16.4, p <.001, and a condition x stimulus type interaction, F(2,33) = 15.9, p <.001. An identical ANOVA in the baseline block yielded only an interaction of condition x stimulus type, F(2,33) = 22.0, p <.001. All CM subjects showed an increase in both Probe and Iall RT from the baseline to the experimental block, meaning CM use can be easily be detected. The average change in RT from the baseline to experimental block was much significantly higher in the CM group. A 3x2 (Condition x Stimulus Type RT Change) repeated measures ANOVA yielded strong main effects of condition, F(2,33) = 45.5, p <.01, stim type RT change, F(1,33) = 23.7, p <.001, and an interaction, F(2,33) = 17.7, p <.001).
 = 22.0, p <.001. All CM subjects showed an increase in both Probe and Iall RT from the baseline to the experimental block, meaning CM use can be easily be detected. The average change in RT from the baseline to experimental block was much significantly higher in the CM group. A 3x2 (Condition x Stimulus Type RT Change) repeated measures ANOVA yielded strong main effects of condition, F(2,33) = 45.5, p <.01, stim type RT change, F(1,33) = 23.7, p <.001, and an interaction, F(2,33) = 17.7, p <.001)..")
24
As with autobiographical information, the CTP was found to be highly sensitive at detecting incidentally acquired concealed knowledge in a mock-crime scenario. Detection rates using the CTP compare favorably to similar polygraph CITs. The main advantage of the CTP over the old P300 or polygraph CIT is its resistance to CM use. The traditional covert-response CMs used to defeat past P300 CITs were found to be ineffective against the CTP, and actually led to larger Probe-Irrelevant amplitude differences and detection rates. CM use was also easily identified by a large increase in RT between the baseline and experimental blocks.

25
Since we saw in the previous experiment, and in Rosenfeld et al. (2008) that CMs actually lead to better detection, we thought we would incorporate explicit CM-like responses into the CTP protocol, in place of the “I saw it” S1 response. So now we have a 5-button box for the left hand. The subject is instructed to press, at random *, one of the 5 buttons as the “I saw it” response to S1 on each trial with no repeats. T and NT (S2) stimuli and responses are as previously. We also hoped that this would make CMs harder to do. It didn’t, but we caught the CM users anyway. * We have done other studies with non-random, explicitly assigned responses also.
 that CMs actually lead to better detection, we thought we would incorporate explicit CM-like responses into the CTP protocol, in place of the I saw it S1 response. So now we have a 5-button box for the left hand. The subject is instructed to press, at random *, one of the 5 buttons as the I saw it response to S1 on each trial with no repeats. T and NT (S2) stimuli and responses are as previously. We also hoped that this would make CMs harder to do. It didn’t, but we caught the CM users anyway. * We have done other studies with non-random, explicitly assigned responses also..")
26
Autobiographical information (birthdates): One P and 4 I (other, non-meaningful dates). 3 Groups as before: SG,CM, IC. NEW: mental CMs to only 2 of the Irrelevants: Say to yourself your first name the CM1, your last name as CM2. These are assigned prior to run. Only one block per group (no baseline).
..")
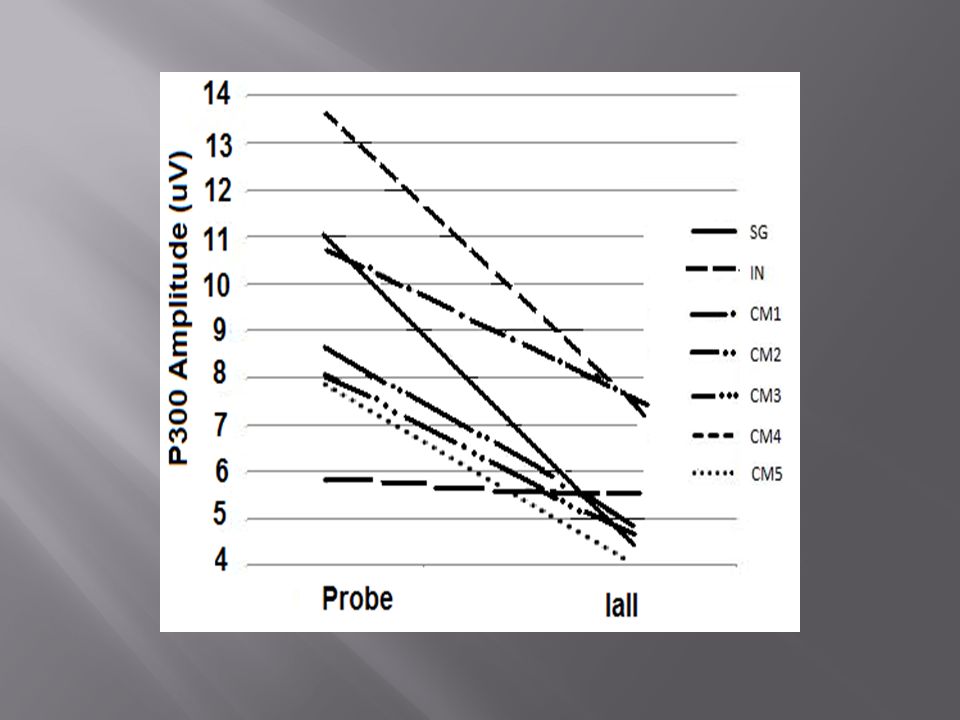
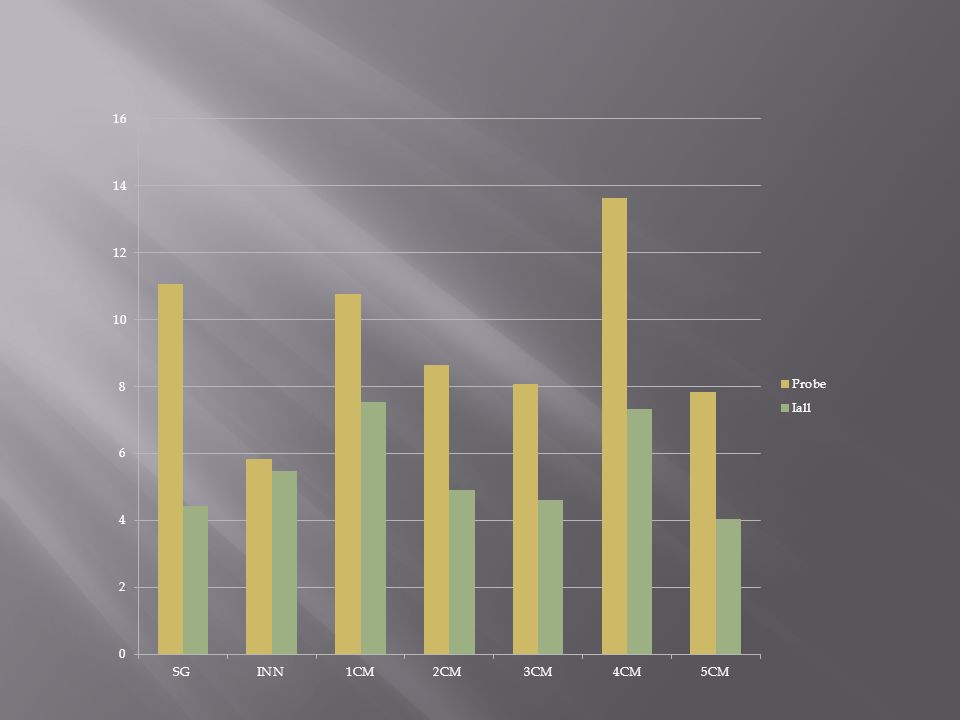
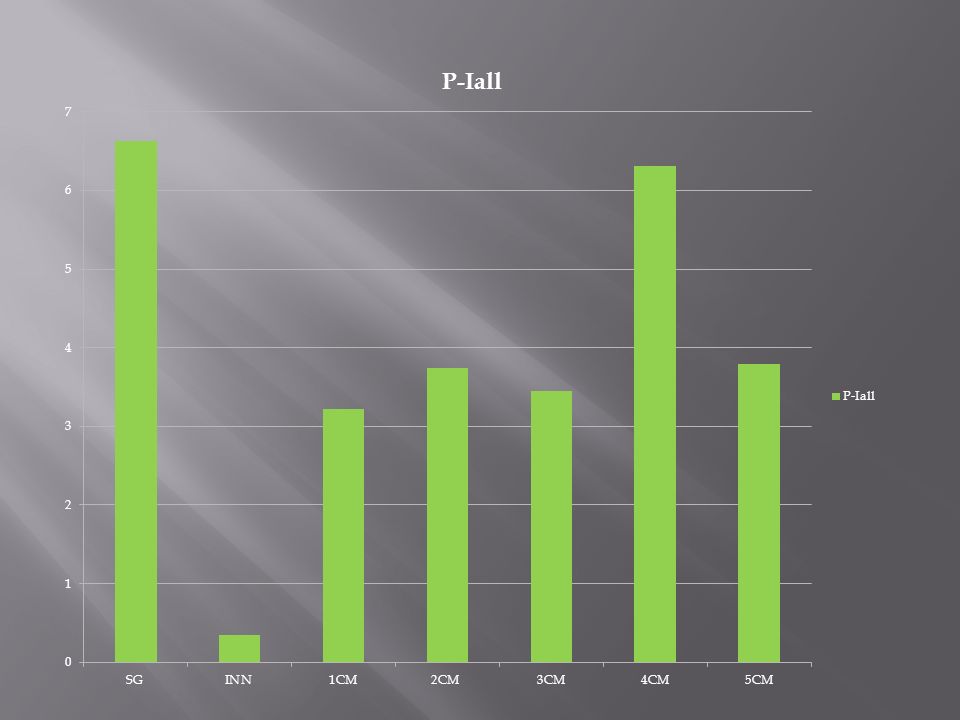
28
Group BT/Iall.9 BT/Imax.9 SG 13/13 (100%) 13/13 (100%) IC 1/13 (7.6%) 1/13 (7.6%) CM 12/12 (100%) 10/12 (83%)* * These are screened via RT, which still nicely represents CM use within a block.
 13/13 (100%) IC 1/13 (7.6%) 1/13 (7.6%) CM 12/12 (100%) 10/12 (83%)* * These are screened via RT, which still nicely represents CM use within a block.")
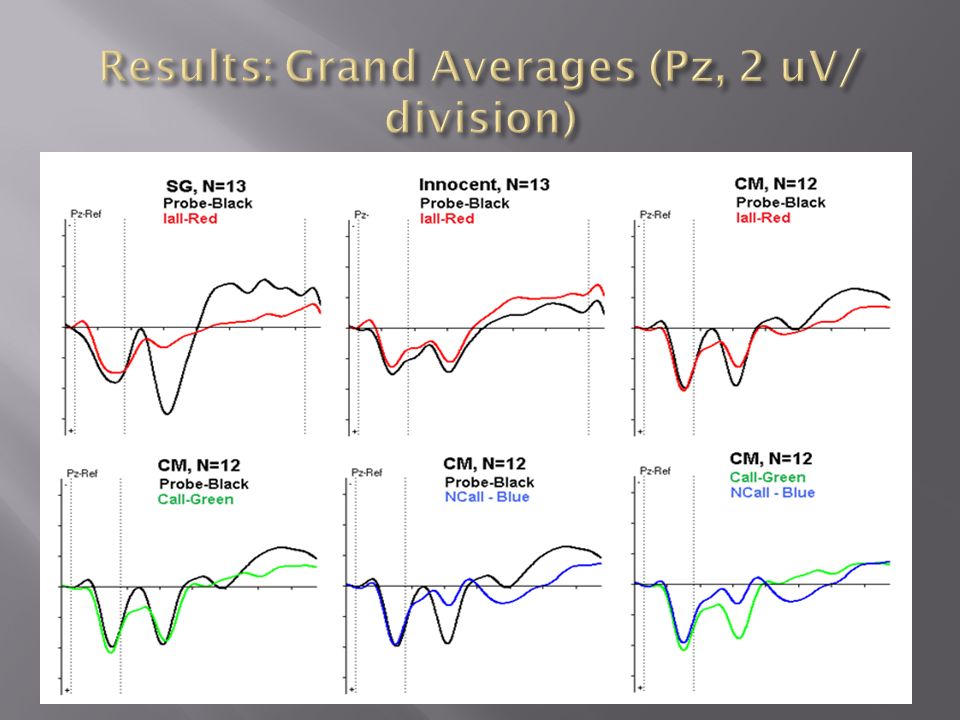
30
Elena Labkovsky & Peter Rosenfeld

31
SG 1CM 2CM 3CM 4CM 5CM

36
John Meixner & Peter Rosenfeld How do you catch bad guys before crimes are committed, and before you know what was done, where, when?

38
A Mock Terrorism Application of the P300-based Concealed Information Test Department of Psychology, Northwestern University, Evanston, IL 60208-2700

39
IallImaxBlind Imax GuiltyInnocentGuiltyInnocentGuiltyInnocent 1000648985287985603 1000610999416998602 955598889476892649 996611898430893605 99415094617943689 909475698284761547 945600677365702536 997555959250961569 999586908217907565 985 690 888 382886706 912390 667 129698650 903644 837 215842702 966546863289872619 12/120/1212/120/1210/120/12 AUC = 1.0 AUC =.979 Table 1. Individual bootstrap detection rates. Numbers indicate the average number of iterations (across all three blocks) of the bootstrap process in which probe was greater than Iall or Imax. Blind Imax numbers indicate the average number of iterations in which the largest single item (probe or irrelevant) was greater than the second largest single item. Mean values for each column are displayed in bold above detection rates.
 of the bootstrap process in which probe was greater than Iall or Imax. Blind Imax numbers indicate the average number of iterations in which the largest single item (probe or irrelevant) was greater than the second largest single item. Mean values for each column are displayed in bold above detection rates..")
40
CTP is a promising, powerful paradigm, against any number of CMs, mental and/or physical and RT reliably indicates CM use. The new “P900” might also. jp-rosenfeld@northwestern.edu

Similar presentations


 Isato.>")


