Download presentation
Presentation is loading. Please wait.

1
Chapter 13

2
Not always desirable Populations increase geometrically(1, 2, 4, 8, 16) Food supply increases arithmetically (1, 2, 3, 4, 5)
 Food supply increases arithmetically (1, 2, 3, 4, 5)")
3
Humans out growing resources Leading to famine, war

4
Small, grew slowly Starvation, predation and disease prevent long lives – 35 old High infant mortality rate

5
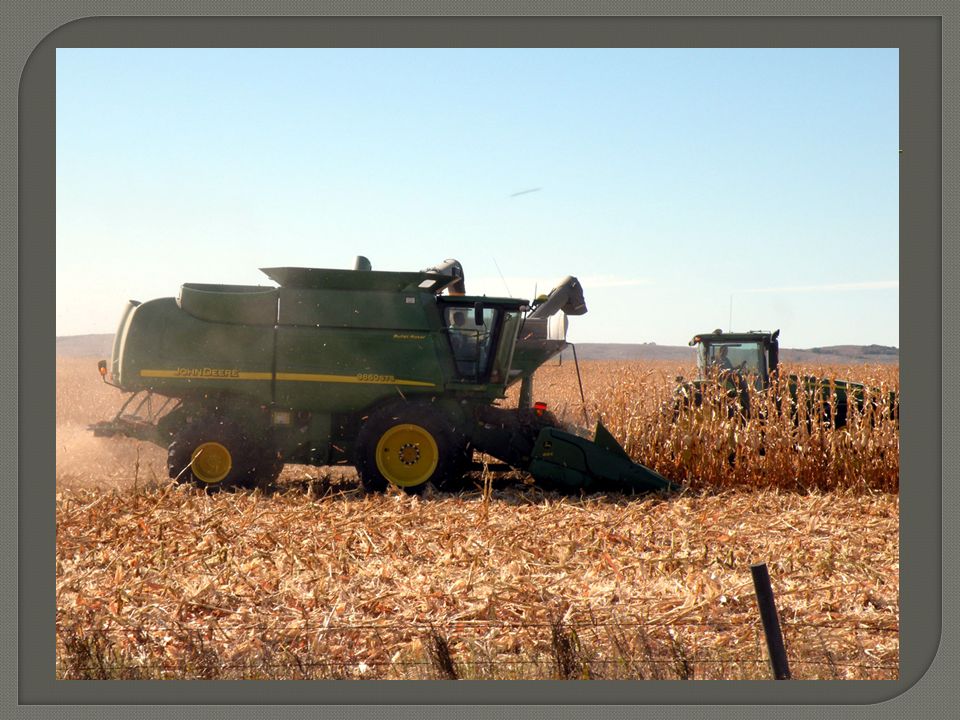
Major growth Increase food supply = more people Higher standard of living, increase life expectancy AGRICULTURAL REVOLUTION – the shift from harvesting wild food sources to producing food through the techniques of farming and herding

7
3 rd period of major growth Increase # of people due to – technology advances in food production and distribution and health care

8
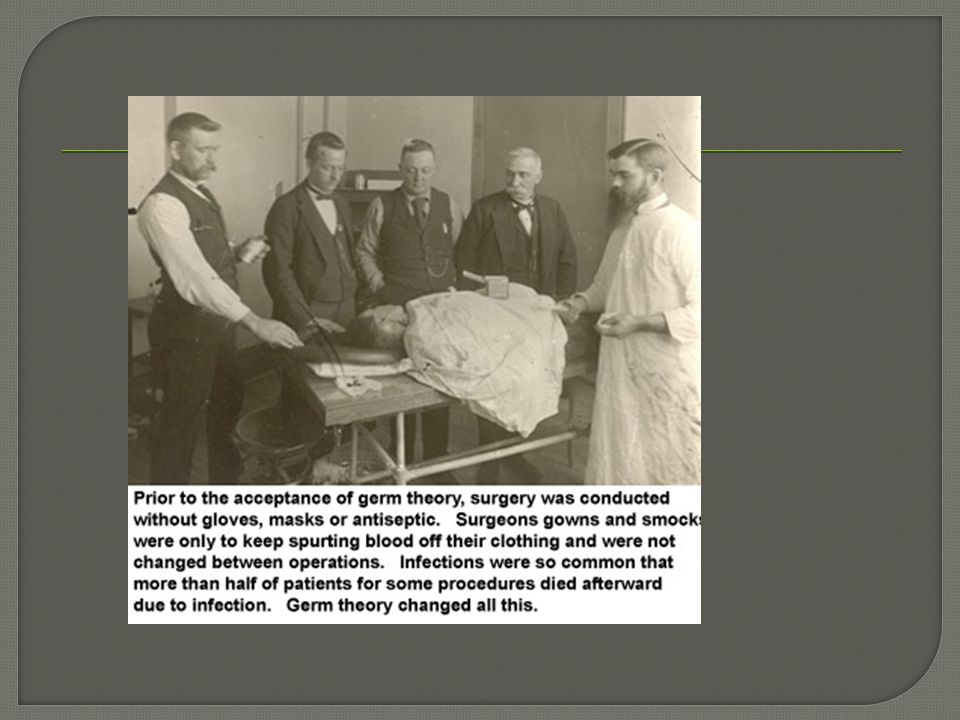
Identified bacteria and other microorganisms as agents responsible for many diseases Before health was not associated with hygiene

10
Improved hygiene, sterile surgery, better methods of waste disposal, and water treatment Reduced death rate, increased population growth

11
Bubonic plague, Black Death, Europe and Asia. Claimed 25% of adult population of Central Europe and Asia 50% of England’s Population reduced between 1348-1379

12
Cholera, typhus, malaria, yellow fever and small pox all claimed many lives throughout human history

13
Famine – 1840s – Irish Potato Famine. More than 1 million died 1877-1888, China, 9 million deaths

14
War – Thirty Years’ War (1618-1648), 1/3 of inhabitants of Germany and Bohemia killed WWI – 21.5 million lives WWII – 35-60 million
, 1/3 of inhabitants of Germany and Bohemia killed WWI – 21.5 million lives WWII – million")
15
Subtracting death rate (number of deaths per thousand) from the birth rate (number of births per thousand) Birth rate = 28. Death rate = 8. What is rate of growth or decline in population?

16
How long it will take for the population, at its current rate of growth, to double in size Some populations double quick some slowly

17
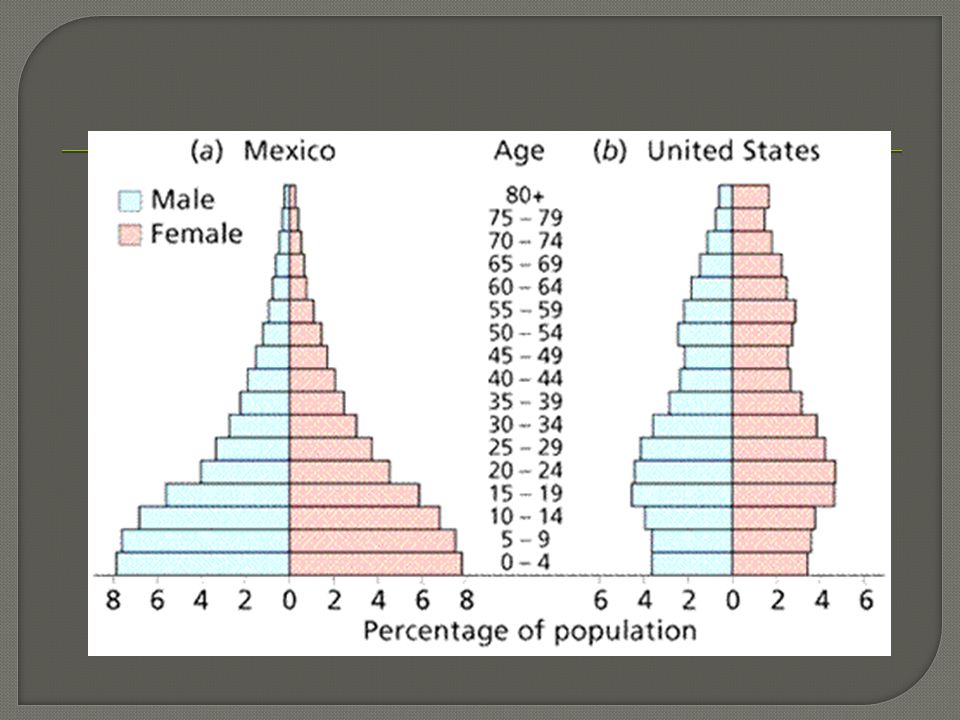
Science of the changing vital statistics in a human population See fig 13.3

19
Countries rely on other countries to support their growth Pollution of one country may affect a neighboring country

20
Human health problems Malnutrition, poor hygiene, lack of medical facilities Destruction of Ecosystems

21
Control birth rate – China, incentives for having only one child Educate – proper birth control (no sex before marriage)
")
Similar presentations


>")


 describe his ideal state? Describe his idea. “Utopia”>")


