Download presentation
Presentation is loading. Please wait.

1
May 20, 20081 Understanding New Hampshire’s 2008 AYP Status and Growth Reports

2
May 20, 20082 NH Department of Education Agenda AYP Status Reports Background AYP Summary Reports (Did we make AYP?) AYP Data Reports (Where does the data come from?) AYP Index Reports (How are we doing?) Combined Reports (NECAP and NH-Alternate Assessment Results) Growth Model Growth Target Report Growth Roster Report Answering Your Questions
 AYP Data Reports (Where does the data come from ) AYP Index Reports (How are we doing ) Combined Reports (NECAP and NH-Alternate Assessment Results) Growth Model Growth Target Report Growth Roster Report Answering Your Questions")
3
May 20, 20083 What is an Accountability System? State Standards - Curriculum Frameworks - Standards for School Approval Valid & Reliable Assessment System - state assessment - local formative, benchmark & competency based assessments Data Analysis Tools - Performance Pathways Accountability Reporting - Assessment Reports - NCLB AYP Status Reports - NH Growth Reports - Combined Reports Statewide System of Support - School Improvement Coaches (content, data, special education, leadership, NH-Alt) - Leadership Institute - Literacy Action Plan - Numeracy Plan - Ongoing PD - DINI support - High School Vision Statement - High School Redesign - PD Master Plans - Special Education Focused Monitoring - Root Cause Analysis program
 - Leadership Institute - Literacy Action Plan - Numeracy Plan - Ongoing PD - DINI support - High School Vision Statement - High School Redesign - PD Master Plans - Special Education Focused Monitoring - Root Cause Analysis program.")
4
May 20, 20084 Adequate Yearly Progress (AYP) What does it mean? Both NCLB (20 USC 6311 §1111(b)(2)(b) (2001)) and NH Statute (RSA 193-H-2) require that the state establish a process of determining if districts and schools have met statewide performance targets (Annual Measurable Objectives- AMOs) which measure the progress of elementary and secondary students on mastery of the state standards as defined in the frameworks and statewide assessment.
(2)(b) (2001)) and NH Statute (RSA 193-H-2) require that the state establish a process of determining if districts and schools have met statewide performance targets (Annual Measurable Objectives- AMOs) which measure the progress of elementary and secondary students on mastery of the state standards as defined in the frameworks and statewide assessment..")
5
May 20, 20085 2008 AYP Status Results – (impacts school year 2008-2009) AYP DefinitionGradesTesting Data with dates Elementary /Middle School and District Reports Index based on NECAP and NH-Alternate Assessment Grades 3-8Gr. 3-8 NECAP (October 2007) Gr. 2-7 NH-Alt (2006-2007 school year – submitted May 2007) Secondary School and District Reports Index based on NECAP and NH-Alternate Assessment High SchoolGr. 11 NECAP (October 2007) Gr. 10 NH-Alt (2006-2007 school year – submitted May 2007) State Report Index based on NECAP and NH-Alternate Assessment Grades 3-8 & 11 October 2007 & May 2007
 Gr. 2-7 NH-Alt ( school year – submitted May 2007) Secondary School and District Reports Index based on NECAP and NH-Alternate Assessment High SchoolGr. 11 NECAP (October 2007) Gr. 10 NH-Alt ( school year – submitted May 2007) State Report Index based on NECAP and NH-Alternate Assessment Grades 3-8 & 11 October 2007 & May")
6
May 20, 20086 2008 AYP Status Results Timeline NCLB and the state statute require that a timeline be established to ensure that all students are performing at proficient or above by the 2013-2014 school year.

7
May 20, 20087 AYP Status Results Starting Points Starting Point calculations For each content area separately, a baseline was created via the 20% method outlined in NCLB: –Determine index for each school –Rank schools by each index –Identify at “20 th percentile” school “20 th percentile” school: the school where 20% of the students in the whole list attend that school or a school with a lower index. –That school’s index is the starting point 2008 Starting points for grade 11: Reading 84 Mathematics 58

8
May 20, 20088 NH Department of Education AYP Status Results Annual Measurable Objectives ( AMOs) Grades 3-8 2 year intervals, equally spaced to 100% Grades 3-8Index ReadingMathematics Starting Point (2005-2006)8276 2006 – 20078276 2007 – 20088682 2008 – 20098682 2009 – 20109188 2010 – 20119188 2011 – 20129594 2012 – 20139594 2013 – 2014100 http://www.ed.state.nh.us/education/doe/organization/curriculum/Assessment/AYP/2006/NECAP%20Index%20Targets.htm
 Grades year intervals, equally spaced to 100% Grades 3-8Index ReadingMathematics Starting Point ( ) – – – – – – – –")
9
May 20, 20089 NH Department of Education AYP Status Results Annual Measurable Objectives (AMOs) Grade 11 2 year intervals, equally spaced to 100
 Grade 11 2 year intervals, equally spaced to 100")
10
May 20, 200810 2008 AYP Status Results 2007/2008 Comparison What’s the Same? Factors included (participation, other indicator, performance) Index values (20, 40, 60, 80, 100) Report shell (mostly) Safe Harbor for grades 3-8 Time to clean up data What’s Different? New AMOs for grades 3-8 Starting points (index targets) for grade 11 F/R data now comes from teaching year Report Shell (no 2% calculation) Safe Harbor for grade 11
 Index values (20, 40, 60, 80, 100) Report shell (mostly) Safe Harbor for grades 3-8 Time to clean up data What’s Different. New AMOs for grades 3-8 Starting points (index targets) for grade 11 F/R data now comes from teaching year Report Shell (no 2% calculation) Safe Harbor for grade 11.")
11
May 20, 200811 Question #1 Did we make AYP? Use the AYP Summary Report Check the list: Preliminary AYP status for NH Schools

12
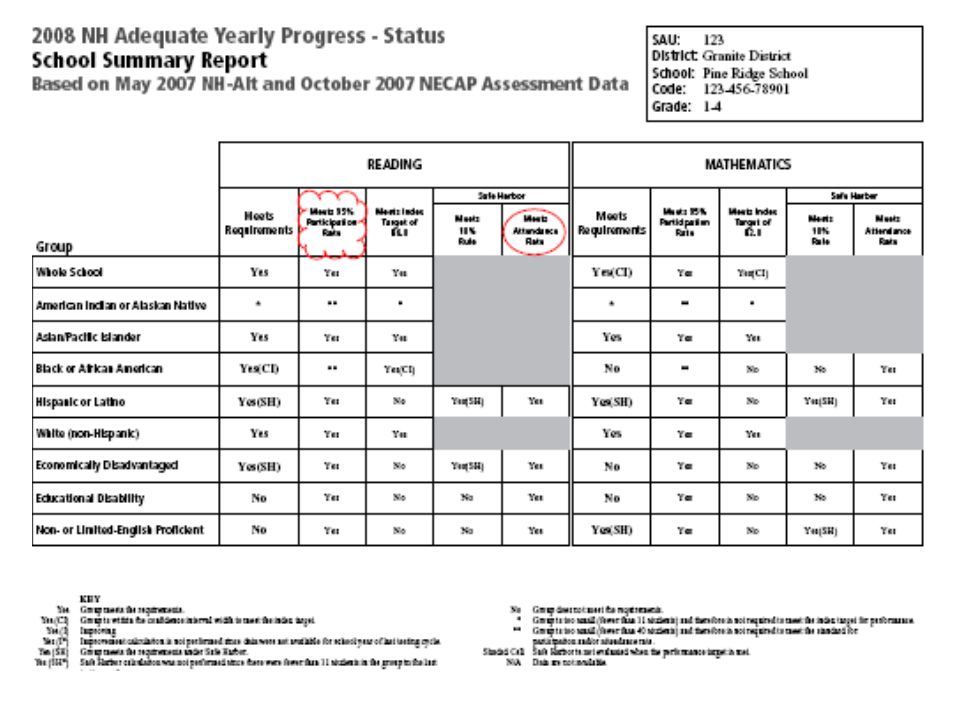
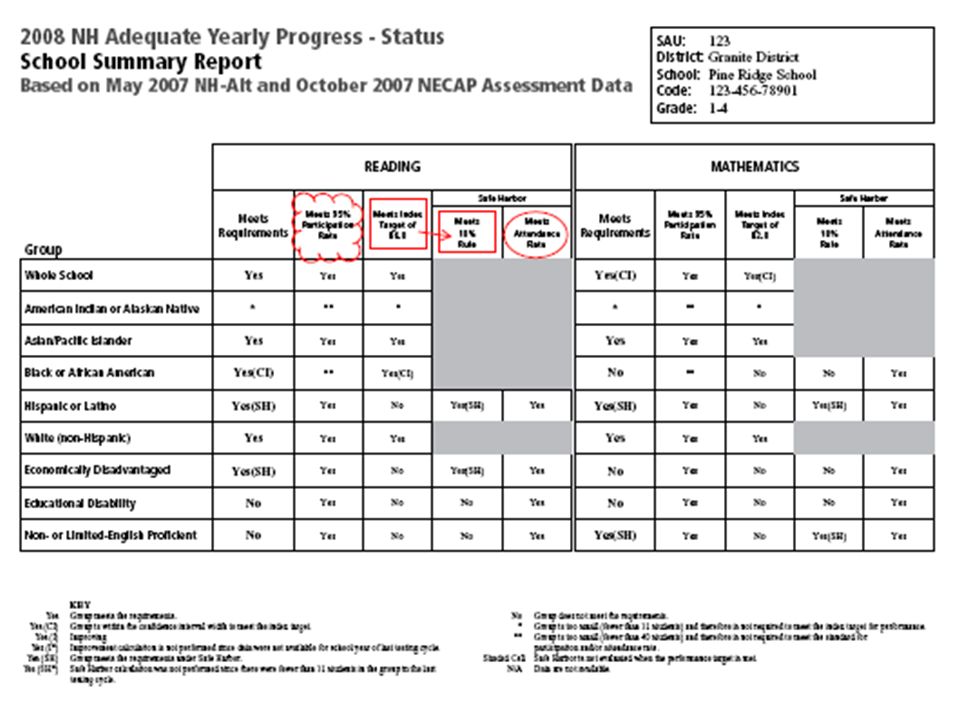
AYP Summary Report

13
May 20, 200813 2008 AYP Status Results Basic Calculation Calculate “Other Indicator” for the school (Attendance rate for grades 3- 8; Graduation rate for high school) Used in safe harbor and also for whole school
 Used in safe harbor and also for whole school")
14
May 7, 2008 NH Department of Education 14

15
May 20, 200815 2008 AYP Status Results Basic Calculation Calculate Participation rate for the school and each subgroup (Based on Testing Year) Calculated first in each content area
 Calculated first in each content area")
17
May 20, 200817 NH Department of Education Calculate Performance for the school and each subgroup (Based on students continuously enrolled in your school for the teaching year – aka FAY) –Calculate Index (Compare to AMO target) –If not OK, check confidence interval (99%) –If still not OK, check safe harbor 2008 AYP Status Results Basic Calculation
 –Calculate Index (Compare to AMO target) –If not OK, check confidence interval (99%) –If still not OK, check safe harbor 2008 AYP Status Results Basic Calculation")
18
May 20, 200818 NH Department of Education 2008 AYP Status Results Confidence Interval

20
May 20, 200820 NH Department of Education 2008 AYP Status Results Minimum “n” definition (Minimum number of students in a group required in order to perform calculation) 95% Participation rate: 40 for each group within testing grades in school or district 75% Graduation rate or improvement: 40 within school or district 90% Attendance rate or improvement: 40 within school or district –Includes all grades 1-8 in the school or district Performance targets:11 for each group within testing grades in school or district
 95% Participation rate: 40 for each group within testing grades in school or district 75% Graduation rate or improvement: 40 within school or district 90% Attendance rate or improvement: 40 within school or district –Includes all grades 1-8 in the school or district Performance targets:11 for each group within testing grades in school or district")
21
May 20, 200821 Question #2 How Do I Check My Data? Use the AYP Data Report Consult the Blue Sheet Verify with the i4see NECAP AYP Student Lists

22
May 20, 200822 May 7, 2008 NH Department of Education 22

23
May 20, 200823 May 7, 2008 NH Department of Education 23 www.ed.state.nh.us/education/AYP/2007

24
May 20, 200824 How to Use the NH NECAP AYP Student List to Check Your AYP Data How do I find the student-level data used to determine our AYP status? The Department has posted the student level data files that were submitted and certified by each district as accurate for AYP reporting in February 2008. These files are located in your password-protected i4see data site. You will need to have your i4see authorized staff access these files. Once on the site, however, you can download and use the Excel file as needed to review your data. Navigating the i4see Website: After logging into the i4see site, Select: “SASID NECAP and Other i4see Submissions” then click “Next”. Now Choose: Your district, and once there, Select: “District Review”. On the District Review page, Select from the menu: “General Reports”. On the General Reports page, Choose either: 11th Gr NH NECAP AYP Student List or Grades 3-8 NH NECAP AYP Students, as appropriate to the grades you have. How do I find the student-level data used to determine our AYP status? The Department has posted the student level data files that were submitted and certified by each district as accurate for AYP reporting in February 2008. These files are located in your password-protected i4see data site. You will need to have your i4see authorized staff access these files. Once on the site, however, you can download and use the Excel file as needed to review your data. Navigating the i4see Website: After logging into the i4see site, Select: “SASID NECAP and Other i4see Submissions” then click “Next”. Now Choose: Your district, and once there, Select: “District Review”. On the District Review page, Select from the menu: “General Reports”. On the General Reports page, Choose either: 11th Gr NH NECAP AYP Student List or Grades 3-8 NH NECAP AYP Students, as appropriate to the grades you have.

25
May 20, 200825 May 7, 2008 NH Department of Education 25

26
May 20, 200826 NH Department of Education Grades 3-8 and Grade 11 NECAP Achievement Levels NECAP Cut points Commissioners from VT, RI, and NH adopted cut points for Grades 3-8 in January, 2006 and for Grade 11 in January, 2008. Proficiency at the student level includes performance at achievement levels 3 and 4. Achievement Levels: Level 1: Substantially Below Proficient Level 2: Partially Proficient Level 3: Proficient Level 4: Proficient with Distinction Scaled Scores are reported as a 3-digit number where the first digit is the grade level and the other part will be a score 00 to 80 (reported as whole numbers at the student level). X40 is the reported cut point for Proficient. Grade 3: 300-380 Grade 4: 400-480 Grade 5: 500-580 Grade 6: 600-680 Grade 7: 700-780 Grade 8: 800-880 Grade 11: 1100-1180
. X40 is the reported cut point for Proficient. Grade 3: Grade 4: Grade 5: Grade 6: Grade 7: Grade 8: Grade 11:")
27
May 20, 200827 NH Department of Education 2008 AYP Status Results Index Definition Index System provides partial credit for scores below Proficient. A school’s index score will be the average of all student index points assigned to the school. Proficiency LevelIndex Points Level 1: Substantially below Proficient X000 1a20 1b40 Level 2: Partially Proficient 2a60 2b80 Level 3: Proficient Level 4: Proficient with Distinction 100

28
May 20, 200828 NH Department of Education Scaled NECAP Scores for each Index Level www.ed.state.nh.us\education\AYP www.ed.state.nh.us\education\AYP

29
May 20, 200829 NH Department of Education Raw Score to Performance Index Conversion table for NH-Alt * The lowest score any scoreable portfolio can earn is 13 raw score points. ** A raw score of 0 is only possible if the portfolio submitted was judged to be unscoreable by two trained and independent scorers. Portfolio Raw Score Points Earned Proficiency LevelPerformance Index Level Performance Index Points Assigned 47-52Proficient with Distinction4100 38-46Proficient3100 34-37Partially Proficient2b80 29-33Partially Proficient2a60 21-28Substantially Below Proficient1b40 13*-20Substantially Below Proficient1a20 0**Un-scoreable (SBP)00 http://www.ed.state.nh.us/education/doe/rganization/curriculum/Assessment/AYP/2006/documents/Alt-INDEXPointTable.pdf
00")
30
May 20, 200830 NH Department of Education An Index Example: Two schools Two schools, both with 180 students tested and 61.1% of their students scoring proficient or better in reading. READINGMaple Street CSPine Street MS Levelpoints# of studentstotal# of studentstotal X00030050 Level 1a20 4005100 Level 1b401040010400 Level 2a605300201200 Level 2b805400302400 Level 3100606000606000 Level 4100505000505000 Sum1801250018015100 Index69.483.9

31
May 20, 200831 NH Department of Education

32
May 20, 200832 NH Department of Education

33
May 20, 200833 NH Department of Education Safe Harbor Calculation- (Elem/MS example) Even though a group does not make performance expectations, it may have improved enough to be okay. To make Safe Harbor a group must meet the 10% rule and the additional indicator. The 10% rule requires that the “complement” of the group’s Index (100-Index) be at least 10% lower than the previous year. In addition, the percent of students scoring proficient or better must increase. October 2006 NECAP & May 06 NH-Alt October 2007 NECAP & May 07 NH-Alt ReductionSH Goal (’06 100-Index) x (.10) Safe Harbor? Is reduction > or = (SH Goal)? Index100-IndexIndex100-Index Maple Street ES 613969.430.639-30.6 = 8.4 39 x.10 = 3.9 Is 8.4>3.9 Yes Gould School 6139633739-37 = 239 x.10 = 3.9 Is 2>3.9 No Maple St. ES improved enough to meet performance expectations by meeting safe harbor requirements. Gould School’s improvement was not sufficient to meet safe harbor requirements.
 be at least 10% lower than the previous year. In addition, the percent of students scoring proficient or better must increase. October 2006 NECAP & May 06 NH-Alt October 2007 NECAP & May 07 NH-Alt ReductionSH Goal (’ Index) x (.10) Safe Harbor. Is reduction > or = (SH Goal). Index100-IndexIndex100-Index Maple Street ES = x.10 = 3.9 Is 8.4>3.9 Yes Gould School = 239 x.10 = 3.9 Is 2>3.9 No Maple St. ES improved enough to meet performance expectations by meeting safe harbor requirements. Gould School’s improvement was not sufficient to meet safe harbor requirements..")
34
May 20, 200834 NH Department of Education Safe Harbor Calculation- Grade 11 “Equi-percentile” comparison 200240300 The general question is: What score on 2007 NECAP corresponds to 240 on 2006 NHEIAP? Percent of students in Grade 11 scoring Basic or above in Reading on May 2006 NHEIAP = 83% (Math: 76%) X00X80X?? Answer: 83% of students in Grade 11 score at or above 1134 in Reading and 1128 in Mathematics on Oct. 2007 NECAP
 X00X80X . Answer: 83% of students in Grade 11 score at or above 1134 in Reading and 1128 in Mathematics on Oct NECAP.")
35
May 20, 200835 NH Department of Education 2008 AYP Status Results and Resources www.ed.state.nh.us Scroll down page to open NH School District Profile –AYP Summary, Data, & Index Reports for Elem/Middle and Secondary schools and districts –AYP CI Look-up Table (pdf and xls)AYP CI Look-up Table –AYP CI Look-up Table Explained (pdf)AYP CI Look-up Table Explained –AYP Data File Layouts (xls)AYP Data File Layouts –AYP Report Data for Data/Summary Pages (csv)AYP Report Data for Data/Summary Pages –AYP Report Data for Index Pages (csv)AYP Report Data for Index Pages –AYP Summary Report Explained (pdf)AYP Summary Report Explained –Understanding New Hampshire’s AYP & Follow The Child Growth Reports (ppt) –Links to AYP Status lists for Schools and Districts, SINI and DINI lists –Link to www.ed.state.nh.us\education\AYPwww.ed.state.nh.us\education\AYP
AYP CI Look-up Table –AYP CI Look-up Table Explained (pdf)AYP CI Look-up Table Explained –AYP Data File Layouts (xls)AYP Data File Layouts –AYP Report Data for Data/Summary Pages (csv)AYP Report Data for Data/Summary Pages –AYP Report Data for Index Pages (csv)AYP Report Data for Index Pages –AYP Summary Report Explained (pdf)AYP Summary Report Explained –Understanding New Hampshire’s AYP & Follow The Child Growth Reports (ppt) –Links to AYP Status lists for Schools and Districts, SINI and DINI lists –Link to")
36
May 20, 200836

37
May 20, 200837 NH Department of Education What is the NH Follow The Child Growth Model? www.ed.state.nh.us/education/FTC/growth.htm www.ed.state.nh.us/education/FTC/growth.htm We calculate growth targets for EVERY student, and tally the number of students meeting or exceeding their target The targets are based on the previous year’s NECAP score – and if no NECAP score is available, the target is proficiency Targets are based on the distance to proficiency – closing the gap (as measured by the number of standard deviations below proficiency) This ensures comparability between grades If students are already proficient, the target is designed to encourage a level that exceeds proficiency
 This ensures comparability between grades If students are already proficient, the target is designed to encourage a level that exceeds proficiency.")
38
May 20, 200838 NH Department of Education NH Follow The Child Growth Expectations >1 SD below ½ to 1 SD below 0 to ½ SD below 0 to ¼ SD above ¼ to 1¼ SD above > 1 ¼ SD above Narrow gap to prof. by one third of the # of SD below Narrow gap to prof. by one half of the # of SD below Proficiency Drop by no more than ¼ SD Stay at least 1 SD above prof. Previous NECAP scaled score. Targets for next testing cycle.

39
May 20, 200839 NH Department of Education Growth Groups by NECAP Scaled Score Group 12345 Math >1SD below 1SD – ½SD Below Proficient-½SD to Proficient + ¼SD ¼SD – 1¼SD above >1¼SD above Grade 3300-329330-334335-342343-353354-380 Grade 4400-428429-434435-442443-454455-480 Grade 5500-528529-534535-542543-554555-580 Grade 6600-628629-634635-642643-654655-680 Grade 7700-729730-734735-742743-753754-780

40
May 20, 200840 May 7, 2008 NH Department of Education 40

41
May 20, 200841 NH Department of Education Reading Growth Targets Grades 3 to 4Grades 4 to 5Grades 5 to 6Grades 6 to 7Grades 7 to 8 ScoreTargetScoreTargetScoreTargetScoreTargetScoreTarget 300416400513500612600713700814 301416401514501612601714701814 302417402514502613602714702815 303417403515503614603715703816 304418404516504614604716704816 305419405516505615605716705817 306419406517506616606717706818 307420407518507617607718707818 308420408518508617608718708819 309421409519509618609719709820 310422410520510619610720710820 Complete reading and mathematics growth targets charts available at: www.ed.state.nh.us\education\FTC\growth\reading_growth_targets.pdf www.ed.state.nh.us\education\FTC\growth\math_growth_targets.pdf

42
May 20, 200842 May 7, 2008 NH Department of Education 42

43
May 20, 200843 NH Department of Education Why Use Two Models? The FTC growth model encourages schools to focus on all students, not just the students that scored just below the performance level cuts. In contrast, the status/index model rewards schools for improvement that crosses achievement levels, regardless of the amount of growth. New Hampshire feels that a valid accountability system should incorporate both status and growth and public reporting of other local assessments throughout the year.

44
May 20, 200844 NH Department of Education So What Does All This Mean? NCLB Accountability is based on the Index The FTC Growth Report is a NH Pilot The school growth reports are for informational purposes to inform teachers, administrators, and the public The student roster information is for teacher instructional use and student goal setting Growth targets give us “one more picture” of student performance

45
May 20, 200845 What is the same or different in this release of NH’s Follow The Child Growth Model ? Accountability Task Force recommended to remove confidence interval calculation as recommended by USED and after reviewing 2007 results AMO Targets will remain the same in order to allow time to collect more longitudinal data Follow The Child Growth Model Reports continue to be for school, district, and state use only and are NOT part of federal accountability calculations

46
May 20, 200846 NH Department of Education Contact Information Deb Wiswell (Assessment & Accountability) dwiswell@ed.state.nh.us 603-271-3828 Gaye Fedorchak (NECAP Data and NH-Alternate) gfedorchak@ed.state.nh.us@ed.state.nh.us Gary Guzouskas (School Improvement and Appeals) gguzouskas@ed.state.nh.us 603-271-5873 Dottie Fair (Title 1 ) dfair@ed.state.nh.us 603-271-3301
 Gaye Fedorchak (NECAP Data and NH-Alternate) Gary Guzouskas (School Improvement and Appeals) Dottie Fair (Title 1 )")
Similar presentations

 Education is a state and local responsibility Insure.>")


 Michigan Department of Education Office of Psychometrics, Accountability, Research, & Evaluation Summer.>")
 Reports 11 1.>")


 2010 Results Leslie Wilson, Assistant State Superintendent Division of Accountability and Assessment July 20, 2010 State.>")