Download presentation
Presentation is loading. Please wait.

1
Energy Conservation Energy Management

2
Role of an energy manager
Assess Current energy demand Energy audit Analyse Energy requirements Advise On technical improvements Advertise Ways to save energy Account For energy consumption

3
Assess energy demand Keep records Consumption Time of readings
Temperature Other factors affecting demand Weekday/weekend Special events Frequency of readings Weekly Daily

4
Energy Audit Feasibility study Aim Process
Establish and quantify energy flows into and within a building or organisation Aim Identify viable and cost effective energy saving measures Enhance operating efficiency and reduce maintenance costs Establish a baseline energy consumption Process Collect data from energy invoices and meters Surveys of plant, equipment and buildings Collect information from managers and other staff

5
Auditing process Identify energy management opportunities
Can be ‘no cost’ or ‘low cost’ measures Change an energy tariff Change an energy supplier Reschedule production activities Preferential tariffs Adjust existing controls to match requirements Implement ‘good housekeeping’ policies Invest in small capital items Thermostats & time switches

6
Who does energy audits? Can be undertaken internally – energy manager
Specialist energy consultants Energy service companies Performance contracts Guarantee organisations energy cost savings in return for a fee Main interest is in installing and managing their recommended plant May arrange finance of projects Vested interest

7
Why is energy wasted? Poorly designed buildings and installations
Insufficient insulation Undersized ventilation ducts Inadequate control systems Poor control settings Inefficient plant operation Out of date technology Poor maintenance Poor operating and working practices

8
Different types of energy audit
According to level of detail and depth of analysis Preliminary Targeted Comprehensive

9
Preliminary audit How much energy is being consumed
What type of energy Performance of facility compared with similar facilities Characteristic performance of building

10
Preliminary energy audit
Identification of potential areas of energy saving Financial energy audits Collect data Establish quantity and cost of each form of energy Data from energy invoices and meters for previous year Analyse data Present data Establish priorities Make recommendations

11
Targeted energy audit Provide data and analysis on specific targeted projects e.g. heating of one building or lighting Detailed survey of target area Analysis of energy flows and costs Recommendations for action

12
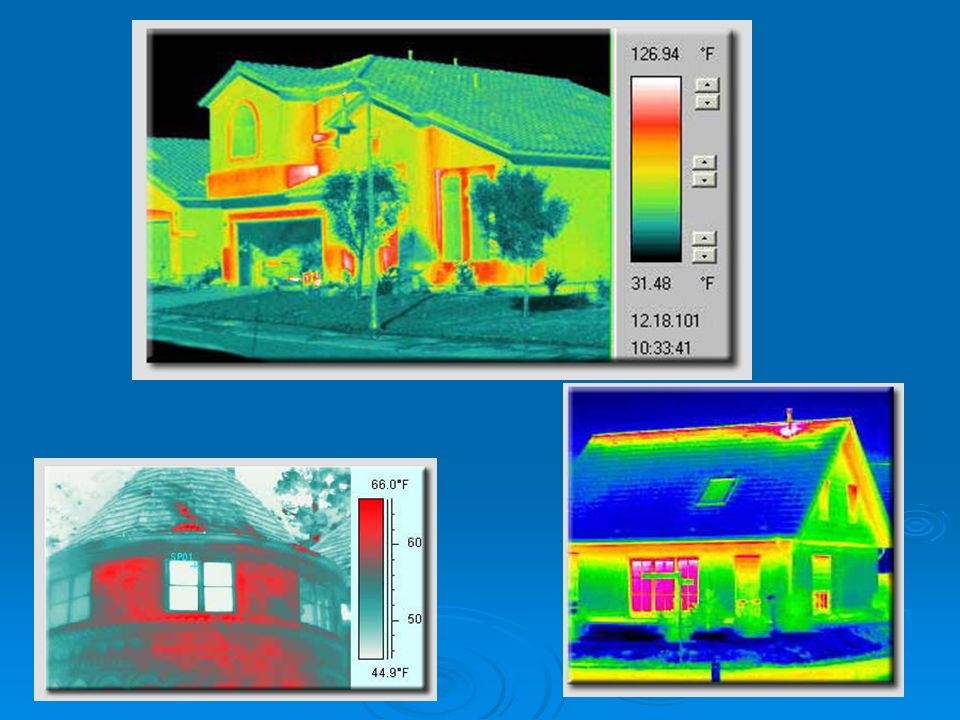
Comprehensive energy audits
Similar to preliminary audits but in far more detail Detailed data on energy flows into and within organisation or facility Often requires use of sub-metering to accurately determine component energy flows Or estimate energy use (Plant power output (kWh)/efficiency of plant) *operating hours per year Use of thermal imaging May use complex energy simulation software Detailed energy survey Energy project implementation plans
/efficiency of plant) *operating hours per year. Use of thermal imaging. May use complex energy simulation software. Detailed energy survey. Energy project implementation plans.")
14
Collect data Build up picture of pattern of energy consumption and cost from energy invoices All invoices for relevant time period Delivery notes for oil, solid fuel, LPG Identify estimated meter readings – check with previous years Inadequate/unavailable invoices – contact utility company/fuel supplier Collect geographic data Location, altitude, orientation Weather data, degree day data Manufacturing data (if appropriate) Production output Check data for anomalies Small building using more energy than larger one High energy use at night when unoccupied
 Production output. Check data for anomalies. Small building using more energy than larger one. High energy use at night when unoccupied.")
15
Understanding invoices: electricity
Date of meter reading Monthly standing charge Present and previous meter reading Daytime – peak rate Night time – off-peak rate Charges for each rate Some tariffs have a higher unit charge for first 1000 kWh Monthly maximum demand charge For every kW of the peak power demand during the month Penalise users make heavy demands during peak periods Supply capacity – annual maximum demand Monthly charge Total cost + VAT

16
Gas invoices Much less complicated than electricity
Date of meter reading or estimate Calorific value of gas Present and previous meter readings Amount of gas used ft3, kWh or therms Unit price per kWh Standing charge Monthly or quarterly Total cost + VAT

17
Other fuels Fuel oil Solid fuel Measured by volume Date of delivery
Varies with temperature corrected to standard condition of 15.50C Date of delivery Unit cost per standard litre Calorific value (?) Total cost + VAT Solid fuel Weight delivered No calorific value
 Total cost + VAT. Solid fuel. Weight delivered. No calorific value.")
18
Analysing energy records
Key variables Heating External temperature - dominant Wind speed ) Humidity ) <=10% variation Solar gain ) Lighting Hours of darkness
 Humidity ) <=10% variation. Solar gain ) Lighting. Hours of darkness.")
19
Data analysis Many different ways of analysing data
Annual energy consumption Analysis of heating requirements Degree day method Mean temperature method Cumulative deviation method (Details in Keith’s lecture notes) Normalised performance indicators (NPI) (Beggs, 2002) Time dependent energy analysis Linear regression analysis CUSUM – cumulative sum deviation method
 Normalised performance indicators (NPI) (Beggs, 2002) Time dependent energy analysis. Linear regression analysis. CUSUM – cumulative sum deviation method.")
20
Annual energy consumption
Simplest analysis Assess overall energy performance of building Produces a percentage breakdown of annual energy consumption and cost data Convert all energy consumption data into standard units (kWh) Standard conversion factors & gross calorific values Percentage breakdowns of total consumption and cost of each energy type Present data Total annual energy consumption Cost Percentage breakdown of each fuel type Historical trends
 Standard conversion factors & gross calorific values. Percentage breakdowns of total consumption and cost of each energy type. Present data. Total annual energy consumption. Cost. Percentage breakdown of each fuel type. Historical trends.")
21
Analysis of heating requirements
Degree day method Quicker Oil & coal heating difficult – general estimates of consumption Mean temperature method More accurate Plot mean consumption against mean external temperature

22
Degree day method Two component parts Temperature related
Independent of temperature Hot water & cooking if by gas E = W + H*degree days*86400 Where E is total energy consumed W energy for hot water + cooking (gas) W approx constant for given house – 7-10 GJ/quarter H is heat loss rate for the home Two unknowns W & H, Know degree days & energy consumption Estimate heat loss & steady energy requirement
 W approx constant for given house – 7-10 GJ/quarter. H is heat loss rate for the home. Two unknowns W & H, Know degree days & energy consumption. Estimate heat loss & steady energy requirement.")
23
Degree day method - example
Energy consumption 2 successive quarters 31.76 & GJ Corresponding degree days 1100 and 500 E = W + H * degree days*86400 1100 * H * W = (1) 500 * H * W = (2) Simultaneous equations (subtract 2 from 1) H = (31.76 – 18.80) * 109 = 250 Watts ( )*86400 Substitute for H in either equation to get W W = * * 250 * 86400 = 8 * 109 = 8GJ H - heat loss W - hot water
 500 * H * W = (2) Simultaneous equations (subtract 2 from 1) H = (31.76 – 18.80) * 109 = 250 Watts. ( )* Substitute for H in either equation to get W. W = * * 250 * = 8 * 109 = 8GJ. H - heat loss. W - hot water.")
24
Degree day method Once H & W have been calculated
Performance for subsequent quarters can be estimated If degree days for 3rd quarter = 400 Consumption predicted to be 400 * 250 * * 109 = GJ If actual consumption is 17.5 GJ then energy has been wasted

25
Mean temperature method (non electrical heating)
Plot the mean consumption over a specific period against mean external temperature For 1 week or 1 day - less time than previous method

26
Analysis of lighting (non-electrically heated house)
Lighting varies throughout the year with hours of darkness Need to assess a realistic time for lighting There is constant load (A) from appliances and refrigeration use and an increasing amount from lighting. Increase in lighting hours is used to obtain L & A in same way for H & W in heating example
 from appliances and refrigeration use and an increasing amount from lighting. Increase in lighting hours is used to obtain L & A in same way for H & W in heating example.")
27
Analysis of heating & lighting in an electrically heated house
More complex as both H & L are unknown Combine A & W to give overall appliance + hot water load (A) E = (degree days * H + lighting hours * L) * A Where E = energy consumption H = heat loss rate L = lighting (units of L are Watts per hour) A = appliance + hot water 3 unknowns – H, L & A If we have data for 3 quarters Estimate values for H, L & A by solving 3 simultaneous equations If appliance load is known calculation is easier
 E = (degree days * H + lighting hours * L) * A. Where E = energy consumption. H = heat loss rate. L = lighting (units of L are Watts per hour) A = appliance + hot water. 3 unknowns – H, L & A. If we have data for 3 quarters. Estimate values for H, L & A by solving 3 simultaneous equations. If appliance load is known calculation is easier.")
28
Cumulative deviation method
No energy conservation – horizontal line Winter following improved insulation Summer – no savings – heat conservation only Winter – parallel to 2 Summer - improved management of hot water Should be (4) + (5) but less - energy conservation performance is reduced
 + (5) but less - energy conservation performance is reduced.")
29
Normalised Performance Indicators (NPIs)
Provides an indication of the energy performance of a building Compares actual annual energy consumption and costs with those achieved by buildings of a similar type and function Problems Buildings may be different sizes Locations may have different climates Locations may have different levels of exposure Maybe different operating hours Correct the building energy consumption data allow for variables such as occupancy and weather. NPIs developed to address these problems. Used to compare with other buildings of a similar type and function compare with standard energy benchmark for different building types Benchmarks Many countries have national energy benchmarks for different types of buildings Usually kWh/m2 of floor area (volume) Provide guidance, not absolute values to achieve
 Provide guidance, not absolute values to achieve.")
30
How to calculate NPIs Establish total building energy use in standard units Calculate the annual energy use for space heating Sub-metering, or analytical techniques Correct space heating energy data for climate & exposure Weather coefficient = std annual heating degree days/ annual heating degree days experienced by building Exposure coefficients Sheltered (city centre) = 1.1 Normal (urban/rural) = 1.0 Exposed (coastal/hilly site) = 0.9 Non-heating energy consumption + corrected space heating = non-time corrected energy consumption To calculate normalised annual energy consumption need to correct for ‘hours of use’ non-time corrected energy consumption * coefficient Hours of use coefficient = std annual hours of use/actual annual hours of use NPI = normalised annual energy consumption/building floor area
 = 1.1. Normal (urban/rural) = 1.0. Exposed (coastal/hilly site) = 0.9. Non-heating energy consumption + corrected space heating = non-time corrected energy consumption. To calculate normalised annual energy consumption need to correct for ‘hours of use’ non-time corrected energy consumption * coefficient. Hours of use coefficient = std annual hours of use/actual annual hours of use. NPI = normalised annual energy consumption/building floor area.")
31
Energy Surveys Integral part of energy audit
Helps to understand energy flows within a facility/building Helps to identify energy wastage Can be comprehensive or targeted Objectives Determine energy performance of facility/building or specific plant/equipment Identify and quantify the principal energy flows & energy cost savings Produce costed recommendations to achieve energy cost savings Make recommendations on future energy management of facility

32
What to include in an energy survey
Management and operation characteristics of a facility or organisation Energy supply to an organisations various facilities Energy use within an organisations facilities The plant and equipment within a facility The fabric of the organisation’s buildings

33
Management and operating characteristics
Management culture Can have considerable influence on energy consumption Determine management structure and practices relating to energy procurement and consumption Identify cost centres Are the managers accountable for operating costs also responsible for energy consumption? Maintenance procedures Frequency and quality Identify new maintenance measures to improve energy efficiency

34
Operating practices: data collection
Use of particular space or building Mechanical/electrical services in building Number & type of occupants e.g. stationary or active Occupancy patterns Environmental conditions Air temp, humidity, lighting Operating practices of plant/equipment Identify where actual practices deviate from that stated by management Overheated rooms, open windows, computers left on

35
Energy Supply Identify tariffs and supply contracts of organisation
Ensure organisation is using correct electricity tariff to suite its load profile Calculate load profile Regular meter readings – include daytime, night time & weekends For large electrical loads Need to be more accurate Measure every 30 mins, use portable meters if necessary Investigate large peaks in load

36
Building fabric Plant and equipment
Survey major items of plant and equipment to determine their operating efficiency Include pipe distribution networks Boilers ‘tune’ to minimise flue gas heat loss Identify if flue gas heat recovery is feasible Refrigeration Check efficiency Opening practices Is heat recovery feasible Pipework Insulation & leaks Planned replacement of old plant Building fabric Identify using U values areas of greatest heat loss Thermal imaging Excess ventilation – open doors

37
Energy management: recommendations
Recommendations will relate to cost of fuel – more interested in saving money than energy/carbon Technical Insulation, draft exclusion, thermostatic radiator valves, heating control Low energy lighting, efficient refrigeration Power factor corrections Relocation of switches, movement sensors Energy management Checking performance Record keeping Financial Make sub-sections responsible for their own energy budget ‘Carrots’ for those who save energy Other factors Change patterns of working Working practices Use of space

Similar presentations


 January 20, 2012 Presenter: BPU President Robert Hanna.>")


 Limited Hyderabad Presentation on Solapur Textile Cluster Solapur, Maharashtra State.>")


