Download presentation
Presentation is loading. Please wait.

0
Marine Resource Management Hydrographic Module
190203LN(M)AM2435GSDI-P1 End product Marine Resource Management Hydrographic Module Tides Dave Whitcombe
AM2435GSDI-P1 End product Marine Resource Management Hydrographic Module. Tides. Dave Whitcombe.")
1
Learning Outcomes Why do we need to know about Tides Tidal Forces
How/Why are Tides Generated Tide Measurement Methods Tidal Levels and Datums Tidal Prediction Tidal Streams

2
Why do we bother about tides?
Bathymetry Data Produce charts/ Produce Charts/Maps Dredging of channels Save Vessel Navigation etc …….

3
The price of getting it wrong …..

4
Why Do We Need to Observe Tides?
When we measure depth it is from a moving platform A Vessel Mounted Echo Sounder The vessel will move relative to the seabed due to :- Waves Tidal Rise and Fall We need to remove the effect of tide so as to:- Establish a fixed height reference irrespective of:- Time Date Geographical locations Changes in Sea Level

5
Tide Generation Due to Moon/Sun Gravitational Pull
Moon Period 24 hours 50 mins Sun Period 24 hours Days Actual Tides Result from the Resultant Positions of Sun and Moon Complete Tidal Cycle 29 days N Sun/Moon S N Earth S

6
Tidal Variation Springs Neaps Neaps Equinox/Solstice
Give Maximum Tidal Range Highest HW/Lowest LW Neaps Give Minimum Tidal Range Lowest HW/Highest LW Equinox/Solstice Sun/Moon on equal /opposite declination Maximum Range/Minimum Range 21st March/September - 21st June/December

7
Springs and Neaps Cycle
Earth S Moon Sun New Moon Moon N Earth S Sun Full Moon Neaps Sun N Earth S Moon Moon Last Quarter 1st Quarter

8
Real Tides(1) External Influences - Distortions Land/Coastline Weather
Pressure - 10mb = 0.1m change in MSL Wind - Piling up against shore Storm Surges: Long Period/High Amplitude Seiches: Short Period/Low Amplitude Shallow Water Currents

9
Real Tides(1) A storm surge with exceptional waves
 A storm surge with exceptional waves")
10
Resonance Natural Period of Resonance
Combination of Tidal Cycle + Resonance Atlantic - 12 hours = Semi-Diurnal Pacific - 24 hours = Diurnal N/S of 65o Tides are Diurnal but Gulf of Mexico = Diurnal North Cape Norway = Semi-Diurnal Semi-Diurnal 2HW + 2LW per day Diurnal 1HW + 1LW per day

11
Tidal Periods 25 hours HW HW Diurnal Tide LW HW HW LW HW
Semi- Diurnal Tide LW LW HW HW Diurnal Inequality LLW HLW

12
Tide Gauges To measure Rise and Fall of Tide at a Fixed Location
Tide Pole Float Gauge Bubbler Gauge Microwave/Acoustic Gauge For Offshore Tide Measurements U/W Pressure Transducer

13
Tide Gauges UK National Network
The UK national network of sea level gauges was established after violent storms in the North Sea in 1953 resulted in serious flooding in the Thames Estuary.

14
Aberdeen Tide Gauge The tide gauge is located on the south east corner of Waterloo Quay, Aberdeen Docks

15
Tidal Levels and Datums
Tide Datum Related to Land Datum In UK = Ordnance Datum Newlyn Equivalent to MSL Has risen by ~0.15m MSL- Mean Sea Level Basic Reference level for all tidal measurements Obtained by:- Mean of all Tide Readings over a long Period e.g. 30 days to 18.6 years MTL - Mean Tide Level NOT = MSL Mean of all HW and LW - not all tide readings

16
Tidal Levels MHWS/MLWS Mean High/Low Water Springs
Maximum Tidal Range Occurring at Spring Tides MHWN/MLWN Mean High/Low Water Neaps Minimum Tidal Range Occurring at Neap Tides MHHW/MLLW Mean High High Water/Mean Low Low Water Where Tide is Diurnal

17
Tidal Datums LAT - Lowest Astronomical Tide
Lowest Tide Level Predicted to Occur Due only to Astronomical Conditions - Not Weather Sounding Datum Height Level to Which Soundings are Reduced in the Field I.e. during the survey operations Chart Datum Height Level to Which Soundings are Reduced on the Chart I.e. as defined by Hydrographic Dept. Defined as level below which the tide will very seldom fall

18
Datums Along an Open Coast
Above Land Datum MHWS Fixed Land Levelling Datum MLWS Below Land Datum Sounding Datum Distance Along Coast

19
Sounding Datums in an Estuary
River River Mouth Estuary MHWS MHNP MSL Land Datum MLNP MLWS Sounding Datum Below Land Datum

20
Reduction of Soundings
Zero Roll on Echo Sounder( set to seal level Transmission Mark (set at transducer depth Height of Tide Chart Datum Line Raw Sounding Reduced Sounding Corrected Seabed Trace Raw Seabed Trace

21
Tide Levels and Definitions
Charted Height Bench Mark Highest Astronomical Tide (HAT) Datum for Heights Mean High Water Springs MHWS) Mean High Water Neaps (MHWN) Water Level Ordnance Datum (Newlyn) Mean Sea Level (MSL) Mean Neap Range Mean Spring Range Drying Height Mean Low Water Neaps (MLWN) Height of Tide Actual Sounding Mean Low Water Springs MLWS) Charted Depth Chart Datum Chart Datum Lowest Astronomical Tide (LAT)
 Datum for. Heights. Mean High Water Springs MHWS) Mean High Water Neaps (MHWN) Water Level. Ordnance Datum. (Newlyn) Mean Sea Level (MSL) Mean Neap Range. Mean Spring Range. Drying Height. Mean Low Water Neaps (MLWN) Height of Tide. Actual Sounding. Mean Low Water Springs MLWS) Charted Depth. Chart Datum. Chart Datum. Lowest Astronomical Tide (LAT)")
22
Predicting Tides Harmonic Method Rigorous Mathematical Formula
Admiralty Method At Primary Port - from published Admiralty Tide Tables At Secondary Ports - modifications - Simplified Harmonic Tidal Differences and Ratios - Co-Tides Establish Datum for Soundings in Offshore Areas Use Co-Tidal Chart to Predict Tidal Information at Sea Co-Tidal Lines MHWI Equal Time of HW Co-Range Lines MSR Equal Tidal Range Relative to Nearest Standard Port

23
Example of Tide Prediction at Standard Port
HW Heights (m) MEAN RANGES Springs 3.7m Neaps 1.8m 1 2 3 4 5 6 0.9 0.8 0.7 Chart Datum 0.6 0.5 Factor 0.4 0.3 0.2 0.1 1 2 3 LW Heights (m)
 MEAN RANGES. Springs 3.7m. Neaps 1.8m Chart Datum Factor LW Heights (m)")
24
Predicting Co-Tides for Positions at Sea
To Obtain Tides at Location:- Compute Tide Heights/Times for Standard Port Add Time Difference to Standard Port Times Multiply Standard Port Heights by Range Ratio

25
Tidal Streams/Currents
Currents are mainly due to Meteorological Conditions Mainly Wind Tidal Streams result from:- Astronomical Conditions Horizontal Progression/Movement of Water Effects of Coastline - Channels/Seabed Topography Effect of Wind Tidal Stream Published Information :- Admiralty Charts Tidal Stream Atlases Sailing Directions

26
UK Tidal Stream Diagram

27
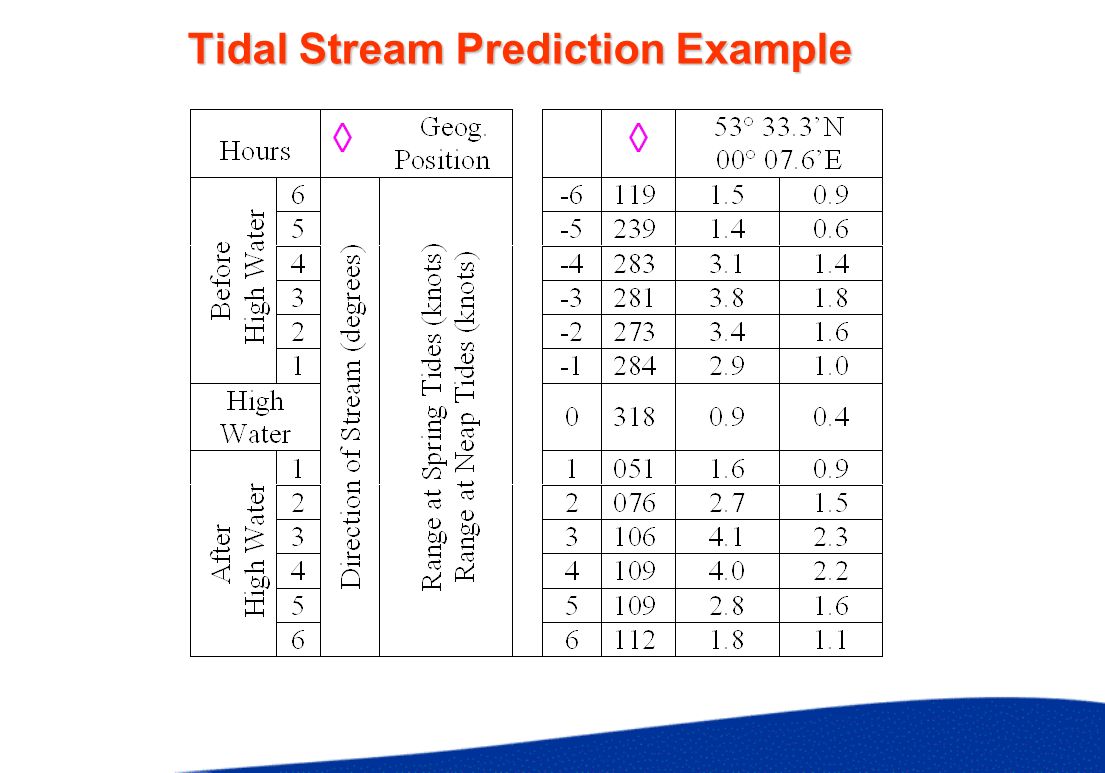
Tidal Stream Prediction
From Admiralty Tide Tables Tide Stream Diamonds Table of Velocities and Directions Related to Time of HW at Local Standard Port

28
Tidal Stream Prediction Example

29
Tides - More information
Similar presentations


 –Amphidromic.>")
>")


