Download presentation
Presentation is loading. Please wait.

2
13 Monopolistic Competition and Oligopoly
CHAPTER Notes and teaching tips: 4, 6, 12, 15, 52, 59, 60, and 64. To view a full-screen figure during a class, click the red “expand” button. To return to the previous slide, click the red “shrink” button. To advance to the next slide, click anywhere on the full screen figure.

3
C H A P T E R C H E C K L I S T When you have completed your study of this chapter, you will be able to 1 Explain how price and quantity are determined in monopolistic competition. 2 Explain why selling costs are high in monopolistic competition. 3 Explain the dilemma faced by firms in oligopoly. 4 Use game theory to explain how price and quantity are determined in oligopoly.

4
13.1 MONOPOLISTIC COMPETITION
Monopolistic competition is a market structure in which A large number of firms compete. Each firm produces a differentiated product. Firms compete on price, product quality, and marketing. Firms are free to enter and exit. Students have no difficulty seeing monopolistic competition in the world all around them. Emphasize that the work they’ve just done understanding the models of perfect competition and monopoly are not wasted because the real-world situation of monopolistic competition, as its name implies, is a mixture of both extremes. Some of what they learned in each of the two previous chapters survives and operates in the middle ground of monopolistic competition.

5
13.1 MONOPOLISTIC COMPETITION
Large Number of Firms Like perfect competition, the market has a large number of firms. Three implications are Small market share No market dominance Collusion impossible

6
13.1 MONOPOLISTIC COMPETITION
Product Differentation Product differentiation is making a product that is slightly different from the products of competing firms. A differentiated product has close substitutes but it does not have perfect substitutes. When the price of one firm’s product rises, the quantity demanded of that firm’s product decreases. Product differentiation is the heart of the space between monopoly and competition. An old ice-cream on the beach analogy really nails down the idea of product differentiation and explains how monopolistic competition fills the space between monopoly and perfect competition. Draw a line on the blackboard and label the two ends A and B. Tell the students that the line represents a long beach along which beachgoers are uniformly spaced. An ice-cream vendor decides to set up shop on the beach—the only one. Where will she locate? The students will quickly see that the center—midway between A and B is the spot that will get most customers because the cost of an ice-cream is the market price plus the walking time to get it (remind them that the beach is very long!) Now a second ice-cream vendor opens up. Where does he locate? With a bit of help, the students will see that the best spot is right next to the first one. With one producer, there is monopoly and no variety—no product differentiation. With two producers, there is still no differentiation— technically, there is minimum differentiation. Now suppose a third and fourth ice-cream vendor come along. Where do they locate? At the ends of the beach at A and B. They differentiate as much as possible from each other and from the first two. Further entry has new ice-cream vendors locating in the middle of the gaps between the existing ones, always going into the widest gap. If the market could stand the competition, eventually, there would be ice-cream vendors so close to each other all along the beach that the members of any adjacent group were indistinguishable to a customer. Product differentiation would have been pushed to the point that there is no “space” for additional variety and the market would look like perfect competition. Real products are like the beach example. Talk about sports shoes, breakfast cereals, and any other goods that interest you and for which there are good locally observable examples and encourage the students to see that they are like the beach example. The variety of products fill the available variety “space.”
 Now a second ice-cream vendor opens up. Where does he locate With a bit of help, the students will see that the best spot is right next to the first one. With one producer, there is monopoly and no variety—no product differentiation. With two producers, there is still no differentiation— technically, there is minimum differentiation. Now suppose a third and fourth ice-cream vendor come along. Where do they locate At the ends of the beach at A and B. They differentiate as much as possible from each other and from the first two. Further entry has new ice-cream vendors locating in the middle of the gaps between the existing ones, always going into the widest gap. If the market could stand the competition, eventually, there would be ice-cream vendors so close to each other all along the beach that the members of any adjacent group were indistinguishable to a customer. Product differentiation would have been pushed to the point that there is no space for additional variety and the market would look like perfect competition. Real products are like the beach example. Talk about sports shoes, breakfast cereals, and any other goods that interest you and for which there are good locally observable examples and encourage the students to see that they are like the beach example. The variety of products fill the available variety space.")
7
13.1 MONOPOLISTIC COMPETITION
Competing on Quality, Price, and Marketing Quality Design, reliability, after-sales service, and buyer’s ease of access to the product. Price Because of product differentiation, the demand curve for the firms’ product is downward sloping. Marketing Advertising and packaging

8
13.1 MONOPOLISTIC COMPETITION
Entry and Exit No barriers to entry. So the firm cannot make economic profit in the long run. Identifying Monopolistic Competition Two indexes: The four-firm concentration ratio The Herfindahl-Hirschman Index

9
13.1 MONOPOLISTIC COMPETITION
The Four-Firm Concentration Ratio The four-firm concentration ratio is the percentage of the value of sales accounted for by the four largest firms in the industry. The range of concentration ratio is from almost zero for perfect competition to 100 percent for monopoly. A ratio that exceeds 60 percent is an indication of oligopoly. A ratio of less than 40 percent is an indication of a competitive market—monopolistic competition.

10
13.1 MONOPOLISTIC COMPETITION
The Herfindahl-Hirschman Index The Herfindahl-Hirschman Index (HHI) is the square of the percentage market share of each firm summed over the largest 50 firms in a market. Example, four firms with market shares as 50 percent, 25 percent, 15 percent, and 10 percent. HHI = = 3,450 A market with an HHI less than 1,000 is regarded as competitive and between 1,000 and 1,800 is moderately competitive.
 is the square of the percentage market share of each firm summed over the largest 50 firms in a market. Example, four firms with market shares as 50 percent, 25 percent, 15 percent, and 10 percent. HHI = = 3,450. A market with an HHI less than 1,000 is regarded as competitive and between 1,000 and 1,800 is moderately competitive.")
11
13.1 MONOPOLISTIC COMPETITION
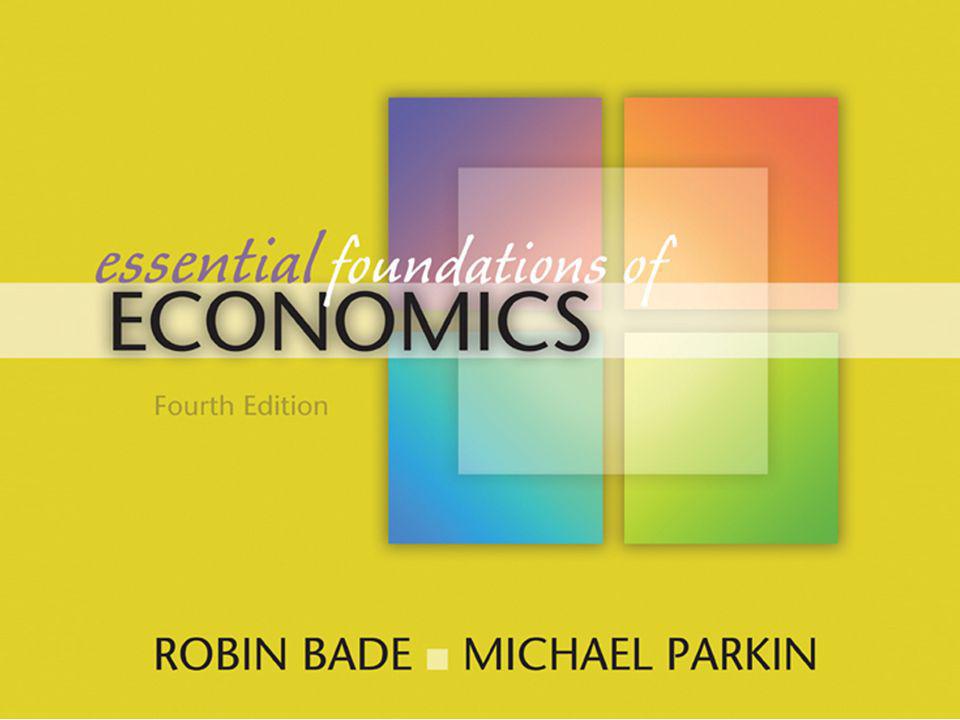
Output and Price in Monopolistic Competition How, given its costs and the demand for its jeans, does Tommy Hilfiger decide the quantity of jeans to produce and the price at which to sell them? The Firm’s Profit-Maximizing Decision The firm in monopolistic competition makes its output and price decision just like a monopoly firm does. Figure 13.1 on the next slide illustrates this decision.

12
13.1 MONOPOLISTIC COMPETITION
1. Profit is maximized when MR = MC. 2. The profit-maximizing output is 125 pairs of Tommy jeans per day. 3. The profit-maximizing price is $75 per pair. While students have gotten familiar with the demand, marginal revenue, and marginal cost curves over the past two chapters, still take the time to point out the curves as you draw them. Use actual numbers for quantity and price Unlike the case of perfect competition, the demand curve for a firm’s differentiated product in monopolistic competition is downward sloping. Remind the students about the ceteris paribus condition that defines a demand curve. Along the demand curve for Nike tennis shoes, the prices of Adidas, Fila, Head, K Swiss, Prince, Reebok, and Wilson tennis shoes are constant. Some people prefer Nike to the other brands and will pay a bit more for Nike. Other people prefer some other brand and will buy Nike only if its price is low enough. Buyers have brand preferences, but they will switch brands if price differences are large enough. So the higher the price of a Nike shoe, the prices of the other brands remaining the same, the smaller is the quantity of Nike shoes demanded. ATC is $25 per pair, so 4. The firm makes an economic profit of $6,250 a day.

14
13.1 MONOPOLISTIC COMPETITION
Long Run: Zero Economic Profit Economic profit induces entry and economic loss induces exit, as in perfect competition. Entry decreases the demand for the product of each firm. Exit increases the demand for the product of each firm. In the long run, economic profit is competed away and firms earn normal profit. Figure 13.2 on the next slide illustrates long-run equilibrium.

15
13.1 MONOPOLISTIC COMPETITION
1. The output that maximizes profit is 75 pairs of Tommy jeans a day. 2. The price is $50 per pair. Average total cost is also $50 per pair. Students seem to have a bit of trouble appreciating that entry and exit change the demand for a firm’s product. Explain this effect by sticking with the tennis shoes example. Explain that the demand for Nike tennis shoes changes and the demand curve for Nike tennis shoes shifts if other firms enter or exit. If Tommy Hilfiger and the Gap started to make tennis shoes, some of Nike’s former customers would switch to these two new brands, and the demand for Nike shoes would decrease. The demand curve for Nike shoes would shift leftward. If Adidas, Fila, and Reebok stopped making tennis shoes, some of their former customers would switch to like, and the demand for Nike shoes would increase. The demand curve for Nike shoes would shift rightward. 3. Economic profit is zero.

17
13.1 MONOPOLISTIC COMPETITION
Monopolistic Competition and Efficiency Efficiency requires that the marginal benefit of the consumer equal the marginal cost of the producer. Price measures marginal benefit, so efficiency requires price to equal marginal cost. In monopolistic competition, price exceeds marginal revenue and marginal revenue equals marginal cost, so price exceeds marginal cost—a sign of inefficiency.

18
13.1 MONOPOLISTIC COMPETITION
But this inefficiency arises from product differentiation—variety—that consumers value and for which they are willing to pay. So the loss that arises because marginal benefit exceeds marginal cost must be weighed against the gain that arises from greater product variety. In a broader view of efficiency, monopolistic competition brings gains for consumers. But firms in monopolistic competition always have excess capacity in long-run equilibrium.

19
13.1 MONOPOLISTIC COMPETITION
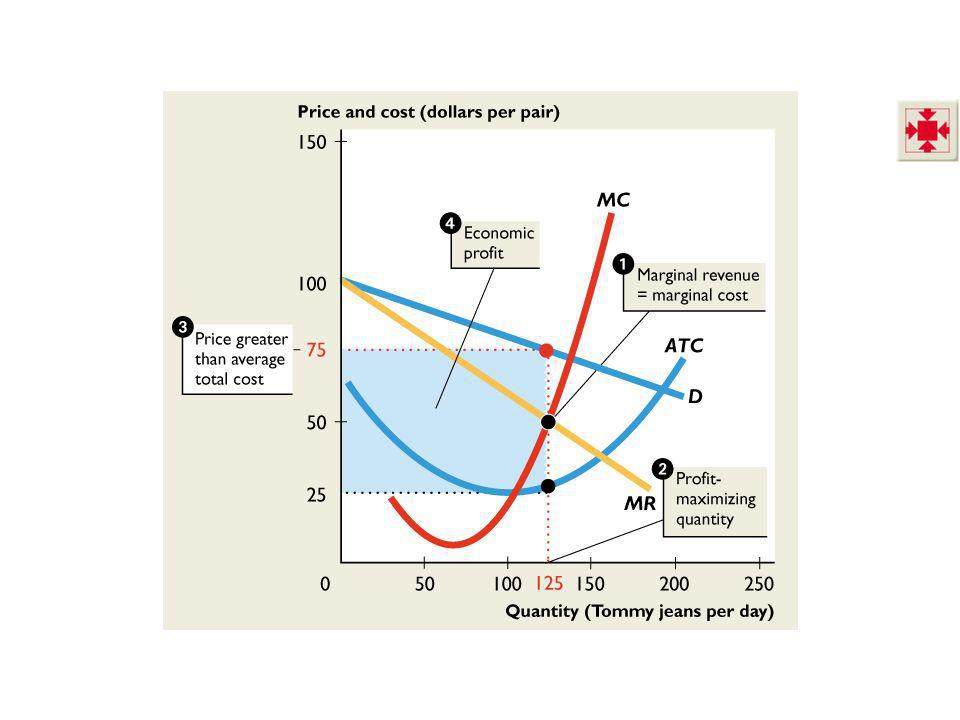
Excess Capacity A firm has excess capacity if the quantity it produces is less that the quantity at which average total cost is a minimum. A firm’s efficient scale is the quantity of production at which average total cost is a minimum. Figure 13.3 on the next slide illustrates excess capacity.

20
13.1 MONOPOLISTIC COMPETITION
1. The efficient scale is 100 pairs of Tommy jeans a day. 2. The firm produces less than the efficient scale and has excess capacity. 3. Price exceeds 4. marginal cost. 5. Deadweight loss arise.

22
13.2 PRODUCT DEVELOPMENT AND MARKETING
Innovation and Product Development Wherever economic profits are earned, imitators emerge. To maintain economic profit, a firm must seek out new products. Cost Versus Benefit of Product Innovation The firm must balance the cost and benefit at the margin.

23
13.2 PRODUCT DEVELOPMENT AND MARKETING
Efficiency and Product Innovation Regardless of whether a product improvement is real or imagined, its value to the consumer is its marginal benefit, which equals the amount the consumer is willing to pay. The marginal benefit to the producer is the marginal revenue, which in equilibrium equals marginal cost. Because price exceeds marginal cost, product improvement is not pushed to its efficient level.

24
13.2 PRODUCT DEVELOPMENT AND MARKETING
Advertising Firms in monopolistic competition spend a large amount on advertising and packaging their products. Advertising Expenditures A large proportion of the prices that we pay cover the cost of selling a good. Eye On the U.S. Economy shows some estimates of marketing expenditures for some familiar markets.

25
13.2 PRODUCT DEVELOPMENT AND MARKETING
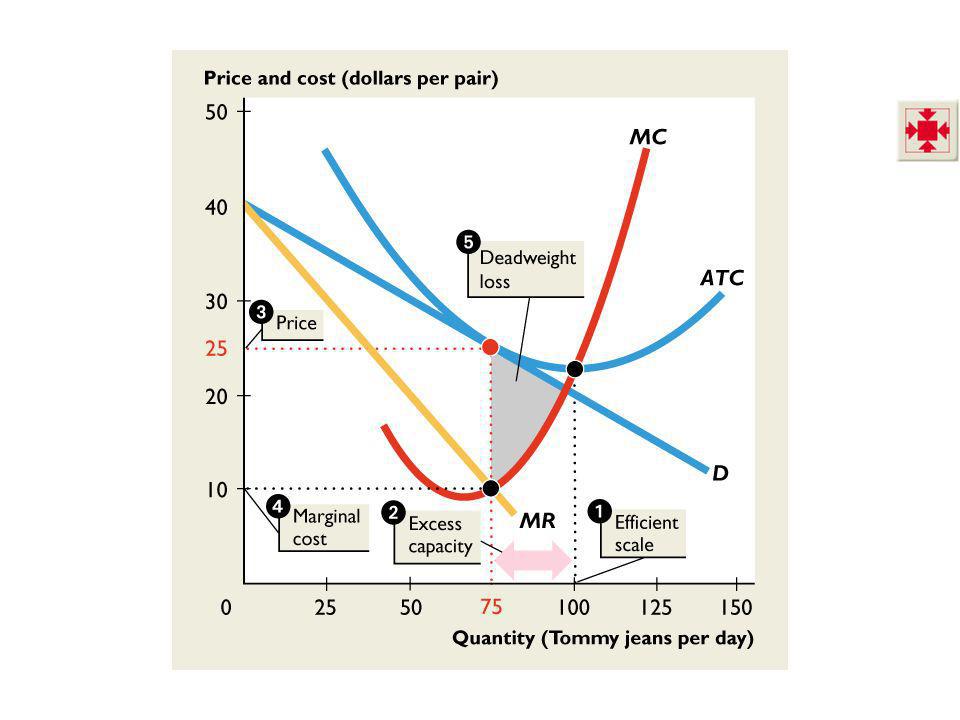
Selling Costs and Total Costs Advertising expenditures increase the costs of a monopolistically competitive firm above those of a perfectly competitive firm or a monopoly. Advertising costs are fixed costs. Advertising costs per unit decrease as production increases. Figure 13.4 on the next slide illustrates the effects of selling costs on total cost.

26
13.2 PRODUCT DEVELOPMENT AND MARKETING
1. When advertising costs are added to 2. The average total cost of production, 3. Average total cost increases by a greater amount at small outputs than at large outputs.

27
13.2 PRODUCT DEVELOPMENT AND MARKETING
4. If advertising enables sales to increase from 25 pairs of jeans a day to 100 pairs a day, and the average total cost falls from $60 a pair to $40 a pair.

29
13.2 PRODUCT DEVELOPMENT AND MARKETING
Selling Costs and Demand Advertising and other selling efforts change the demand for a firm’s product. The effects are complex: A firm’s own advertising increases the demand for its product. Advertising by all firms might decrease the demand for any one firm’s product.

30
13.2 PRODUCT DEVELOPMENT AND MARKETING
Efficiency: The Bottom Line The bottom line on the question of efficiency of monopolistic competition is ambiguous. In some cases, the gains from extra product variety offsets the selling costs and the extra cost arising from excess capacity. It is less easy to see the gains from being able to buy brand-name drugs that have a chemical composition identical to that of a generic alternative. But many people do willingly pay more for the brand-name alternative.

31
13.3 OLIGOPOLY Another market type that stands between perfect competition and monopoly. Oligopoly is a market type in which: A small number of firms compete. Natural or legal barriers prevent the entry of new firms. Oligopoly is a market with a small number of firms, and each firm is large and can influence the market price.

32
13.3 OLIGOPOLY In monopoly, one firm controls the total quantity supplied and so it also controls the price. In perfect competition, no firm is big enough to influence the total quantity supplied, so no firm can influence the price. Oligopoly is unlike both of these cases. More than one firm controls the quantity supplied, so no one firm controls the price. But each firm is large, and the quantity produced by each firm influences the price.

33
13.3 OLIGOPOLY Collusion When a small number of firms share a market, they can increase their profit by forming a cartel and acting like a monopoly. A cartel is a group of firms acting together to limit output, raise price, and increase economic profit. Cartels are illegal but they do operate in some markets. But cartels usually breaks down—as we will explain. A duopoly is a market in which there are only two producers.

34
Duopoly in Airplanes 13.3 OLIGOPOLY
Identifying oligopoly is the flip side of identifying monopolistic competition. The borderline between oligopoly and monopolistic competition is hard to pin down. As a practical matter, we try to identify oligopoly by looking at concentration measures. A market in which HHI exceeds 1,800 is generally regarded as an oligopoly.

35
13.3 OLIGOPOLY Oligopoly might operate like monopoly, like perfect competition, or somewhere between these two extremes. Monopoly Outcome The firm would operate as a single-price monopoly. Figure 13.6 on the next slide shows the monopoly outcome.

36
13.3 OLIGOPOLY

38
13.3 OLIGOPOLY Perfect Competition
Equilibrium occurs where the marginal revenue curve intersects the demand curve. The quantity produced is 12 planes a week and the price would be $1 million a plane. Figure 13.5 shows the perfect competition outcome and the range of possible oligopoly outcomes.

39
13.3 OLIGOPOLY

41
13.3 OLIGOPOLY The Duopolists’ Dilemma
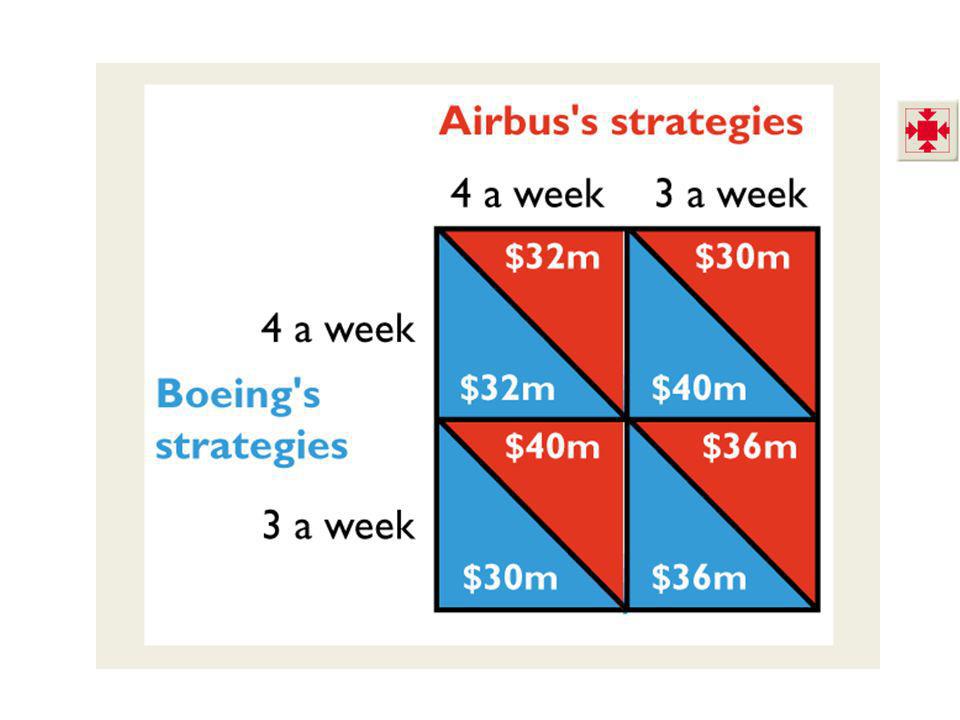
To achieve the monopoly profit Airbus and Boeing might attempt to form a cartel. If the firms can agree to produce the monopoly output of 6 airplanes a week, joint profits will be $72 million .

43
13.3 OLIGOPOLY Would it be in the self-interest of Airbus and Boeing to stick to the agreement and limit production to 3 planes a week each? With price exceeding marginal cost, one firm can an increase its profit by increasing its output. If both firms increased output when price exceeds marginal cost, the end of the process would be the same as perfect competition.

44
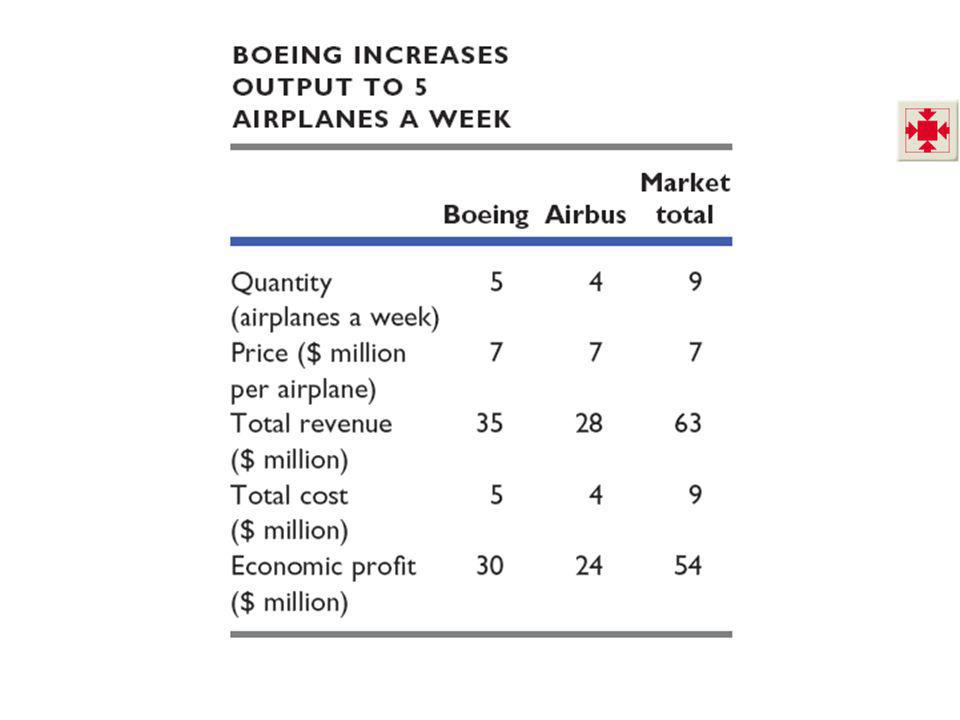
13.3 OLIGOPOLY Boeing Increases Output to 4 Airplanes a Week
Boeing can increase its economic profit by $4 million and cause the economic profit of Airbus to fall by $6 million.

46
13.3 OLIGOPOLY Airbus Increases Output to 4 Airplanes a Week
For Airbus, this outcome is an improvement on the previous one by $2 million a week. For Boeing, the outcome is worse than the previous one by $8 million a week.

48
13.3 OLIGOPOLY Boeing Increases Output to 5 Airplanes a Week
If Boeing increases output to 5 airplanes a week, its economic profit falls. Similarly, if Airbus increases output to 5 airplanes a week, its economic profit falls.

50
13.3 OLIGOPOLY The Oligopoly Cartel Dilemma
If both firms stick to the monopoly output, they each produce 3 airplanes and make $36 million. If they both increase production to 4 airplanes a week, they make $32 million each. If only one firm increases production to 4 airplanes a week, that firm makes $40 million. What do they do? Game theory provides an answer.

51
13.4 GAME THEORY Game theory is the tool used to analyze strategic behavior—behavior that recognizes mutual interdependence and takes account of the expected behavior of others.

52
What Is a Game? 13.4 GAME THEORY
All games involve three features: Rules Strategies Payoffs Prisoners’ dilemma is a game between two prisoners that shows why it is hard to cooperate, even when it would be beneficial to both players to do so. The prisoners’ dilemma is a great way to start this lecture. Tell students they get to play a game and get two students to volunteer to be the “criminals.” Give the entire class the story and rules. Don’t use a payoff matrix at this point, just write the options on the board. Then send one of your volunteers out of the room. Ask the remaining student what strategy he or she will take. Get your class to help. It usually takes a few minutes for everyone to agree that confessing is the best strategy. Send the first student from the room and then call in the second student. Ask this student what he or she will do. Because the class already knows what the first student has done, encourage them not to tell. Aid the students as they move toward choosing the equilibrium. Encourage students to remember this gaming strategy because it is the same material that you’ll use to describe a firm’s behavior. You can actually play the prisoner’s dilemma game online. A good Web version of the game can be found on a site operated by a group called Serendip at Bryn Mawr College in Pennsylvania. The URL for the web site is If you can use the Web in your classroom, open two browsers and go to this site twice. Get two teams trying to beat Serendip.

53
The Prisoners’ Dilemma
13.4 GAME THEORY The Prisoners’ Dilemma Art and Bob been caught stealing a car: sentence is 2 years in jail. DA wants to convict them of a big bank robbery: sentence is 10 years in jail. DA has no evidence and to get the conviction, he makes the prisoners play a game.

54
13.4 GAME THEORY Rules Players cannot communicate with one another.
If both confess to the larger crime, each will receive a sentence of 3 years for both crimes. If one confesses and the accomplice does not, the one who confesses will receive a 1-year sentence, while the accomplice receives a 10-year sentence. If neither confesses, both receive a 2-year sentence.

55
13.4 GAME THEORY Strategies
The strategies of a game are all the possible outcomes of each player. The strategies in the prisoners’ dilemma are Confess to the bank robbery. Deny the bank robbery.

56
13.4 GAME THEORY Payoffs Four outcomes: Both confess. Both deny.
Art confesses and Bob denies. Bob confesses and Art denies. A payoff matrix is a table that shows the payoffs for every possible action by each player given every possible action by the other player.

57
13.4 GAME THEORY Table 13.5 shows the prisoners’ dilemma payoff matrix for Art and Bob.

59
13.4 GAME THEORY Equilibrium Occurs when each player takes the best possible action given the action of the other player. Nash equilibrium is an equilibrium in which each player takes the best possible action given the action of the other player. The Nash equilibrium for Art and Bob is to confess. The equilibrium of the prisoners’ dilemma is not the best outcome for the players. John Nash’s life makes for an interesting anecdote you can tell in class. Some of your students might have seen the movie A Beautiful Mind, which was the somewhat embellished story of Nash’s life. To recapitulate the story, Nash was an incredibly bright graduate student and assistant professor in the early 1950s. During this time he developed the concept of the Nash equilibrium. Tragically, he was taken severely ill with schizophrenia. Princeton, where he was employed, made a supremely human decision and kept him on the faculty even though he was totally disabled. He spent the next three decades riding buses around Princeton and wandering the buildings at night. Nash’s condition has improved in recent years. The Nobel Prize committee heard of his improving condition and called several of his friends to inquire if he would be able to accept the prize. He was and so the Nobel Prize was awarded to him in 1994.

60
The Duopolists’ Dilemma as a Game
13.4 GAME THEORY The Duopolists’ Dilemma as a Game The dilemma of Boeing and Airbus is similar to that of Art and Bob. Each firm has two strategies. It can produce airplanes at the rate of: 3 a week 4 a week The duopolist’s dilemma game on pages and revisited on pages 355–356 has been carefully designed to get the maximum payoff from the knowledge your students have of the perfect competition and monopoly results of the two preceding chapters and to introduce them to game theory in a setting that is as close to the previously studied settings as possible. Instead of asserting a payoff matrix on page 355, the numbers in the matrix come directly from monopoly profit-maximizing and competitive outcomes calculated on the earlier pages. You need to do a bit of work to generate the payoff numbers, but the whole story hangs together so much better when the student can see where the numbers come from and can see the connection between the oligopoly set up and those of competition and monopoly. Start with Figure 13.5 on page 349 and after you’ve explained the cost and demand conditions shown in the figure, ask the students what they think the price and quantity will be in this industry. There will be differences of opinion. This diversity of opinion motivates the need for a model of the choices the firms make.

61
13.4 GAME THEORY Because each firm has two strategies, there are four possible combinations of actions: Both firms produce 3 a week (monopoly outcome). Both firms produce 4 a week. Airbus produces 3 a week and Boeing produces 4 a week. Boeing produces 3 a week and Airbus produces 4 a week.
. Both firms produce 4 a week. Airbus produces 3 a week and Boeing produces 4 a week. Boeing produces 3 a week and Airbus produces 4 a week.")
62
13.4 GAME THEORY The Payoff Matrix
Table 13.6 shows the payoff matrix as the economic profits for each firm in each possible outcome.

64
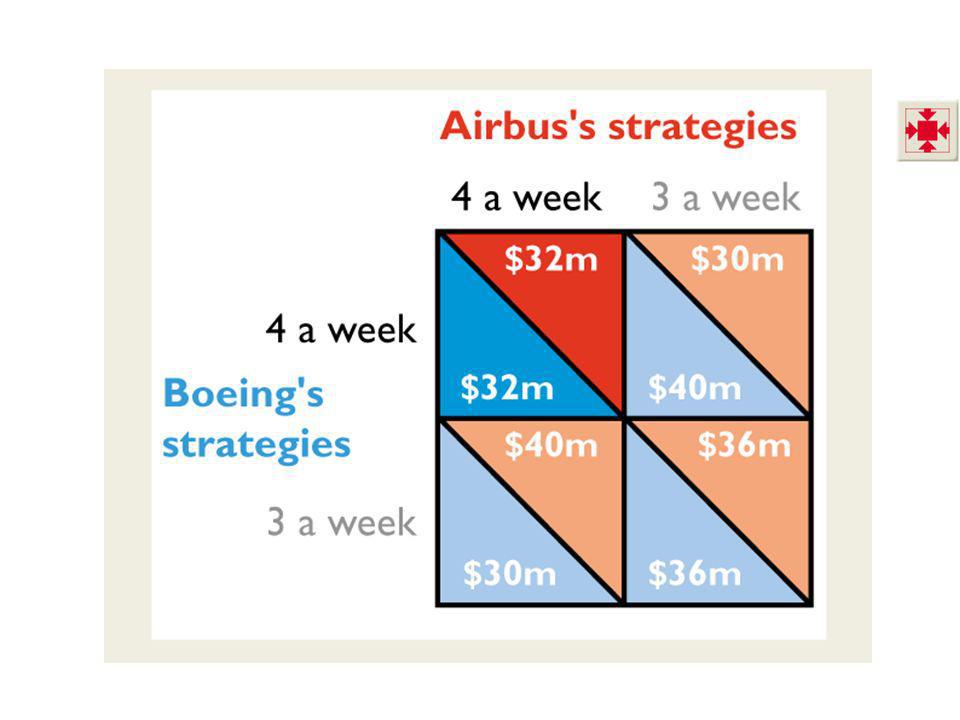
13.4 GAME THEORY Equilibrium of the Duopolists’ Dilemma
Both firms produce 4 a week. Like the prisoners, the duopolists fail to cooperate and get a worse outcome than the one that cooperation would deliver. Determining the Nash equilibrium of a game is often difficult for students. Try to make the game more “practical” by pointing out to the students that in the real world, real firms are almost always doing ”what if” analyses and that game theory is well designed for answering these sorts of “what if” questions. In the Airbus/Boeing game in the text, the two companies are trying to determine how many airplanes they should produce if their competitor produces 3 airplanes or if their competitor produces 4 airplanes. You can illustrate the equilibrium by starting with Airbus and stating that Airbus wants to determine what it should do if Boeing produces 4 airplanes. Then, after determining that Airbus will produce 4 airplanes, do the next “what if” by looking what Airbus should do if Boeing produces 3 airplanes. In this case, Airbus again wants to produce 4 airplanes. Therefore Airbus’s “what if” analysis has led to the conclusion that regardless of Boeing’s decision, Airbus wants to produce 4 airplanes. You can conduct the same “what if” for Boeing’s choices and determine that Boeing, too, will produce 4 airplanes regardless of Airbus’s choice.

66
13.4 GAME THEORY Collusion Is Profitable but Difficult to Achieve
The duopolists’ dilemma explains why it is difficult for firms to collude and achieve the maximum monopoly profit. Even if collusion were legal, it would be individually rational for each firm to cheat on a collusive agreement and increase output. In an international oil cartel, OPEC, countries frequently break the cartel agreement and overproduce.

67
Advertising and Research Games in Oligopoly
13.4 GAME THEORY Advertising and Research Games in Oligopoly Advertising campaigns by Coke and Pepsi, and research and development (R&D) competition between Procter & Gamble and Kimberly-Clark are like the prisoners’ dilemma game.
 competition between Procter & Gamble and Kimberly-Clark are like the prisoners’ dilemma game.")
68
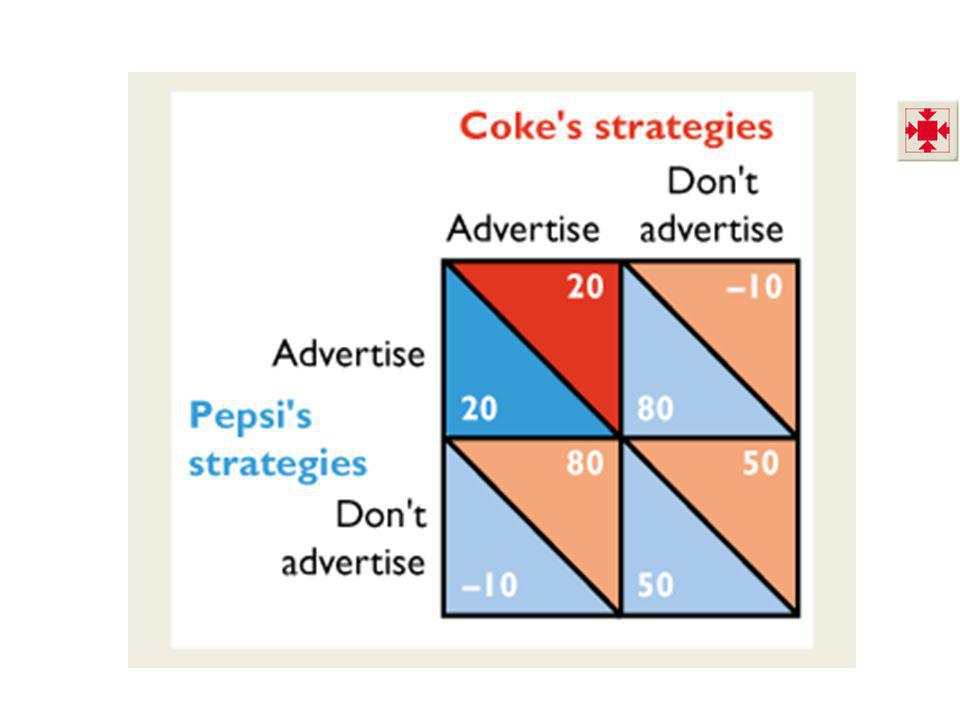
13.4 GAME THEORY Advertising Game
Coke and Pepsi have two strategies: advertise or not advertise. Table 13.8 shows the payoff matrix as the economic profits for each firm in each possible outcome.

70
13.4 GAME THEORY The Nash equilibrium for this game is for both firms advertise. But they could earn a larger joint profit if they could collude and not advertise.

72
13.4 GAME THEORY Research and Development Game
P&G and Kimberly- Clark have two strategies: spend on R&D or do no R&D. Table 13.9 shows the payoff matrix as the economic profits for each firm in each possible outcome.

74
13.4 GAME THEORY The Nash equilibrium for this game is for both firms to undertake R&D. But they could earn a larger joint profit if they could collude and not do R&D.

76
Repeated Games 13.4 GAME THEORY
Most real-world games get played repeatedly. Repeated games have a larger number of strategies because a player can be punished for not cooperating. This suggests that real-world duopolists might find a way of learning to cooperate so they can enjoy monopoly profit. The next slide shows the payoffs with a “tit-for-tat” response.

77
13.4 GAME THEORY Week 1: Suppose Boeing contemplates producing 4 planes instead of the agreed 3 planes. Boeing’s profit will increase from $36 million to $40 million, and Airbus’s profit will decrease from $36 million to $30 million.

78
13.4 GAME THEORY Week 2: Airbus punishes Boeing and produces 4 planes. But Boeing must go back to producing 3 planes to induce Airbus to cooperate in week 3. In week 2, Boeing’s profit falls to $30 million and Airbus’s profit increases to $40 million.

79
13.4 GAME THEORY Over the two-week period, Boeing’s profit would have been $72 million if it cooperated, but it was only $70 million with Airbus’s tit-for-tat response.

81
13.4 GAME THEORY In reality, where a duopoly works like a one-play game or a repeated game depends on the number of players and the ease of detecting and punishing overproduction. The larger the number of players, the harder it is to maintain the monopoly outcome.

82
Is Oligopoly Efficient?
13.4 GAME THEORY Is Oligopoly Efficient? In oligopoly, price usually exceeds marginal cost. So the quantity produced is less than the efficient quantity. Oligopoly suffers from the same source and type of inefficiency as monopoly. Because oligopoly is inefficient, antitrust laws and regulations are used to try to reduce market power and move the outcome closer to that of competition and efficiency.

Similar presentations