Download presentation
Presentation is loading. Please wait.

1
Natural Selection and Adaptations
What’s up with that bird?

2
Vocabulary Adaptation Natural Selection Mutation

3
Scientists believe that the Earth and its inhabitants have changed
a great deal over time. -They have observed species’ fossil records and have noticed changes over time. -Organisms tend to adapt or change over time.

4
2. Adaptation- a change in an organism that helps it live and
reproduce successfully in its environment. -these adaptations can be physical or behavioral long neck or stripes Reproduction, protection, or finding food

5
3. One scientist that observed these kinds of differences in plants
and animals of the same species is Charles Darwin.

6
In 1831 Darwin sailed on board the SS Beagle from his home in England to a small island group off the coast of Ecuador

7
4. Darwin traveled to the Galapagos islands where he saw plants and
4. Darwin traveled to the Galapagos islands where he saw plants and animals that differed from those on other islands and the mainland. Examples: tortoises long neck versus short neck Live in dry climates with cacti Live in damp area with abundant plant life

8
5. Darwin also found different types of finches (birds). He noticed
different beak shapes and sizes from one island to the next. Woodpecker finch Vegetarian finch Large ground finch Cactus finch

9
There are at least 13 species of finches, each with a
different niche. All are said to have come from the same ancestral species, which only got to the islands about 2 million years ago. This is known as adaptive radiation-where one species quickly changes or adapts to fill in the “empty” ecospace.

10
6. When most plants and animals reproduce, they usually produce more
offspring than can survive. Example: salmon -lay 1000’s of eggs, but not all will hatch. Of those that do hatch, only a fraction will survive disease and avoid fish eating predators. Only a small % of these survivors will make it to adulthood, with only a few being able to reproduce successfully.

11
7. From one generation to the next there are always variations.
These genetic variations are passed down. -run now version 8. A change in genetic material is called a mutation. Some mutations make the individual better able to survive.

12
Camouflage an adaptation or a mutation?
-Moths will rest during the day Time: late 18th/early 19th century Place: Pre-industrial England Subject: Biston betularia or the peppered moth -Black moth coloration considered a mutation Before industry-trees had gray trunks-gray moths blended in better. After industry developed-tree trunks turned black due to the pollution from factories-black moth was then able to blend in After many, many generations of this, most moths were then black. In this case coloration is considered to be an adaptation.

13
Moths

14
Peppered Moth Simulation
Objectives: Describe the importance of coloration in avoiding predation Relate environmental change to changes in organisms (adaptation) Explain how natural selection causes populations to change Materials: Sheet of white paper Clock or Watch with Second Hand Newspaper newspaper circles (made with hole punch) Forceps white circles (made with hole punch) Colored Pencils Purpose: In this lab, you will simulate how predators locate prey in different environments. You will analyze how color affects and organism's ability to survive in certain environments.
 Explain how natural selection causes populations to change. Materials: Sheet of white paper Clock or Watch with Second Hand Newspaper 30 newspaper circles (made with hole punch) Forceps 30 white circles (made with hole punch) Colored Pencils. Purpose: In this lab, you will simulate how predators locate prey in different environments. You will analyze how color affects and organism s ability to survive in certain environments.")
15
Peppered Moth Simulation
Copy this data table into your lab notebook Peppered Moth Simulation Starting Population Number Picked up Trial Back ground News paper White 1 white 30 2 3 4

16
Introduction: Industrial Melanism is a term used to describe the adaptation of a population in response to pollution. One example of rapid Industrial Melanism occurred in populations of peppered moths in the area of Manchester, England from 1845 to Before the industrial revolution, the trunks of the trees in the forest around Manchester were light grayish-green due to the presence of lichens. Most of the peppered moths in the area were light colored with dark spots. As the industrial revolution progressed, the tree trunks became covered with soot and turned dark. Over a period of 45 years, the dark variety of the peppered moth became more common.

17
Procedure: Place a sheet of white paper on the table and have one person spread 30 white circles and 30 newspaper circles over the surface while the other person (or “predator”) isn’t looking (eyes closed). 2. The "predator" will then use forceps/tweezers to pick up as many of the circles as he/she can in 30 seconds. 3. Without putting the circles back between trials, repeat with white circles on a newspaper background, newspaper circles on a white background, and newspaper circles on a newspaper background. Record your data in the chart.
 isn’t looking (eyes closed). 2. The predator will then use forceps/tweezers to pick up as many of the circles as he/she can in 30 seconds. 3. Without putting the circles back between trials, repeat with white circles on a newspaper background, newspaper circles on a white background, and newspaper circles on a newspaper background. Record your data in the chart.")
18
Peppered Moth Simulation
Starting Population Number Picked up Trial Back ground News paper White 1 white 30 2 3 4

19
What did the experiment show about how prey are selected by predators?
Analysis What did the experiment show about how prey are selected by predators? 2. What moth coloration is the best adaptation for a dark (newspaper) background? How do you know? 3. What would you expect the next generation of moths to look like after trial 1? What about the next generation after trial 3? 4. How does the simulation model natural selection? 5. Imagine a second mutation (clear or colored circles) caused a third population to arise, what affect do you think it might have on the other two populations of moths?
 background How do you know 3. What would you expect the next generation of moths. to look like after trial 1 What about the next. generation after trial 3 4. How does the simulation model natural selection 5. Imagine a second mutation (clear or colored circles) caused a third population to arise, what affect do you. think it might have on the other two populations of. moths")
20
5. Examine the table and construct a graph. Plot the years of
the study on the X-axis, and the number of moths captured on the Y axis. You should have 2 lines on your graph - one for light moths, and one for dark moths. Year # of Light Moths Captured # of Dark Moths Captured 2 537 112 3 484 198 4 392 210 5 246 281 6 225 337 7 193 412 8 147 503 9 84 550 10 56 599 Use the ½ sheet of graph paper 3rd Period Only 6. Explain in your own words what the graph shows. 7. Describe a situation where this type of selection might occur.

21
9. If this organism is able to survive
and reproduce, the mutation is passed on to future generations. This is called selective breeding Example: Terriers bred to show certain characteristics

22
10. This idea led to the Darwin’s theory on Natural Selection.
11. Natural Selection: the process by which organisms that are best suited to their environment survive and reproduce. Example: small marine iguana on an island with a thin layer of algal growth Voyage to the Galapagos video and questions (~60 minutes)
")
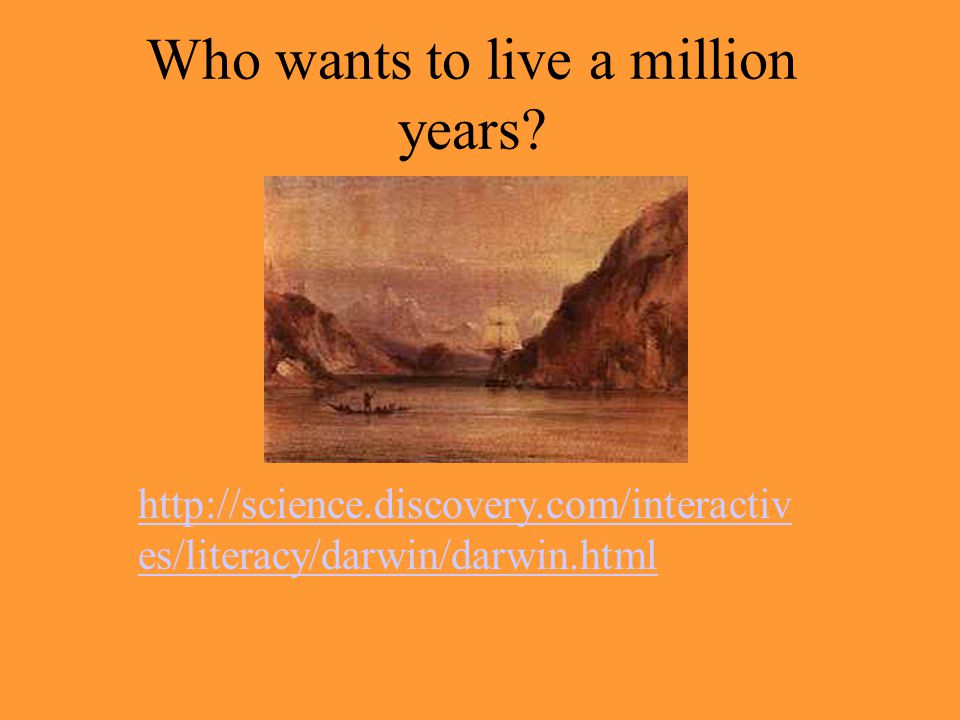
23
Who wants to live a million years?
24
Introduction. Scene - On a distant planet there exists 5 species of a creature called a Woolybooger. Each Woolybooger is similar except their mouth has variations. All woolyboogers eat beans. Some woolyboogers have a clothespin mouth (look at how to use the clothespin to pick up beans). Some woolyboogers have a tweezer mouth (as demonstrated), some have a needle mouth (as demonstrated). One year a new species of woolybooger was discovered, this woolybooger was called the Spoon-Mouthed Woolybooger (as demonstrated). Each of you will play the part of a woolybooger on this planet. The spoon-mouth wooly booger is rare, so only two of you will get to be this type of woolybooger.
, some have a needle mouth (as demonstrated). One year a new species of woolybooger was discovered, this woolybooger was called the Spoon-Mouthed Woolybooger (as demonstrated). Each of you will play the part of a woolybooger on this planet. The spoon-mouth wooly booger is rare, so only two of you will get to be this type of woolybooger.")
25
Survival of the Woolybooger
Overview - Students will model natural selection by using various utensils to "capture food" Materials: 3 bags of beans (northern or lima) tweezers 10 trays clothespins 10 plastic spoons rounded toothpicks
 10 tweezers. 10 trays 10 clothespins. 10 plastic spoons 10 rounded toothpicks.")
26
At this point, I will pass out the utensils and give each group a tray with beans. The entire group will share bean trays but each person should have their own utensil. There is no "cheating", you must use your utensil in the way they are intended to be used (as I demonstrated). We will do several rounds. Each trial will require your Woolybooger to gain at least 20 beans. If 20 beans are not acquired during the time period, your Woolybooger has died. We will start with 1 minute.
. We will do several rounds. Each trial will require your Woolybooger to gain at least 20 beans. If 20 beans are not acquired during the time period, your Woolybooger has died. We will start with 1 minute.")
27
Discussion Questions:
What happens to animals that cannot compete as well with other animals in the wild? 2. Can you think of any real-life examples of the woolybooger, where one species has a definite advantage over another? 3. Sometimes animals that are introduced into an area that they never lived in before, out-compete and endanger resident species, why do you think this happens? 4. If only one species is considered the "fittest", why do we still have so many variations among species. Why do some birds have very long pointy beaks, while other birds have short flat beaks? 5. How do you think diseases can affect natural selection?

28
Darwin’s Finches Adaptation occurs in an ecosystem so that species can
better survive in their habitat. Sometimes these adaptations cause competition between species allowing one species to thrive while the other dies out. A good example of this type of adaptation occurs on the Galapagos Islands with the finches that inhabit the area. Each species of finch has a specific body weight, beak shape and eating habits that allows them to avoid competing for food with the other finches.

29
Birds of a beak activity
In this activity you represent finches with four different beak types. You may only use your beak to gather food to put in your “stomach”. First, we will try to determine what kind of food your beak type would like best. You’ll try each of the different food types one at a time and then record the amounts in lab notebook data table.

30
Record the total number of each food item in your “stomach”
Table 1 Record the total number of each food item in your “stomach” Finch type Number of finches Popcorn Marbles Beans Blocks Paperclips Toothpicks Large Binder Medium Binder Small Binder Spoon

31
1. You will need to have an area that is approximately 2 feet
by 2 feet (one desk top). 2. Each person in the group will have a different type of beak. 3. Scatter the contents of one cup of “food” into the marked territory (this is your island). 4. When the teacher announces, you will have 2 minutes to gather as much food as you can. 5.The food has to make it to and stay in your stomach in order to count. Once in your stomach no one can take it from you.
. 2. Each person in the group will have a different type of. beak. 3. Scatter the contents of one cup of food into the marked. territory (this is your island). 4. When the teacher announces, you will have 2 minutes to. gather as much food as you can. 5.The food has to make it to and stay in your stomach in order. to count. Once in your stomach no one can take it from you.")
32
Calories each food is worth: Marbles – 50 calories Beans - 20 calories
Second, a mixture of food will be placed on your table and you have to see how many of the different beaks survive. You do this by adding up the number of calories you get (use the chart below) and comparing that to the number of calories you need to live. Calories each food is worth: Marbles – 50 calories Beans - 20 calories Paper clips – 15 calories Toothpicks – 10 calories Blocks –30 calories Popcorn - 10 calories Calories each finch needs to live: Large binder clip- 300 calories Spoon- 250 calories Medium binder clips- 150 Small binder clips- 100
 and comparing that to the number of calories you need to live. Calories each food is worth: Marbles – 50 calories. Beans - 20 calories. Paper clips – 15 calories. Toothpicks – 10 calories. Blocks –30 calories. Popcorn - 10 calories. Calories each finch needs to live: Large binder clip- 300 calories. Spoon- 250 calories. Medium binder clips Small binder clips")
33
Record the number of each food item you
Table 2 Record the number of each food item you collect from the food mixture. At the end, calculate the caloric intake of each beak. Did your finch survive? Finch type Popcorn Marbles Beans Blocks Paperclips Toothpicks Calories Did You Live? Large Binder Medium Binder Small Binder Spoon

34
Birds of a Beak Conclusion Questions
From situation 1, which beak was best adapted? Which was least adapted? Which food item could be eliminated and not effect the population of finches? From situation 2, if food was in low supply-which food item could your finch survive off of?

35
http://biologyinmotion.com/evol/index.html Evolution Lab
In this lab, you will use a computer simulation to track a population of organisms as they evolve. You will take data on the number and varieties of the organisms and graph them to show change over time and determine how two factors: MUTATION RATE and SELECTION STRENGTH affect how populations evolve. Instructions 1. Go to and click on the link that says "evolution lab" 2. Read the introduction and the contents to learn about the imaginary creatures you will be studying and how to operate the simulator. You may also want to look at the help link. 3. Open the simulator and practice using the controls before you go on to the real simulation. Be sure to "reset" the simulator when you're finished practicing.

36
Fill out the data table and create a graph for simulation B.
Simulation A - The purpose of this simulation is to determine how the mutation rate affects the evolution of your population. You will need to run 4 trials with varying settings for mutation rate. Fill out the Data Table and create a graph using the graphing program at . You will have 4 lines on your graph. The X-axis will be cycles, and the Y will be mean phenotype. Simulation B - The purpose of this simulation is to determine how selection strength affects the evolution of your population. Run three trials with the selection strength at 0, and three trials with the selection strength at varying ranges. (See data table) Fill out the data table and create a graph for simulation B. Graphing Program located at: Blank Data Tables (doc)
 Fill out the data table and create a graph for simulation B. Graphing Program located at: Blank Data Tables (doc)")
37
Describe how the simulation models natural selection (and evolution).
Analysis Answer the following questions on a separate page, title this page "Evolution Simulation" and make sure your name is on it. You can even type it in Word if you like. Describe how the simulation models natural selection (and evolution). 2. Explain HOW the mutation rate affects the evolution of your populations. --> Explain WHY the mutation rate affects the evolution of your populations. 3. Explain HOW altering the selection rate affects the evolution of your populations. (You may want to include an explanation of what "selection strength" means.) --> Explain WHY altering the selection rate affects the evolution of your populations. At the end of this web activity, you will have turned in the following documents: Data tables 2 Graphs Analysis Questions Credits: Special thanks to Leif Saul, author of Biology in Motion and the creator of the Evolution Lab.
. 2. Explain HOW the mutation rate affects the evolution of your populations. --> Explain WHY the mutation rate affects the evolution of your populations. 3. Explain HOW altering the selection rate affects the evolution of your populations. (You may want to include an explanation of what selection strength means.) --> Explain WHY altering the selection rate affects the evolution of your populations. At the end of this web activity, you will have turned in the following documents: Data tables. 2 Graphs. Analysis Questions. Credits: Special thanks to Leif Saul, author of Biology in Motion and the creator of the Evolution Lab.")
Similar presentations


 can affect the fitness of a.>")


 ► Theory was based on NEED Organs needed if environmental.>")
 who in 1831, sailed on.>")


