Download presentation
Presentation is loading. Please wait.

1
Chapter 1 The Science of biology

2
1-1 What Is Science? What is the goal of science? So what is science?
To understand the world around us. So what is science? An organized way of using evidence to learn about the natural world.

3
Thinking Like a Scientist
Scientists record observations. Information gathered using the senses. Ex: there is a person standing in the front of the room. Data Qualitative data – descriptive ; ex: rough or smooth Quantitative data – numerical; counted or measured ; ex: 12 apples or 52.5 grams. Most experiments contain both types of data. An inference may follow an observation. A logical interpretation based on prior knowledge or experience. Ex: the person is a teacher.

4
Observation and Inference
Section 1-1 Statement Observation Inference Object A is round and orange. X Object A is a basketball. Object A is a basketball. Object B is a table-tennis ball. Object C is a soccer ball. Object C is round and black and white. Object C is larger than Object B. Object B is smooth. Object B is a table-tennis ball. Each object is used in a different sport.

5
Note the differences In laboratory exercises, record observations NOT inferences Inferences may be used when writing the conclusion to your lab. Let’s test your observation skills… You’ll need a piece of paper and a writing utensil

7
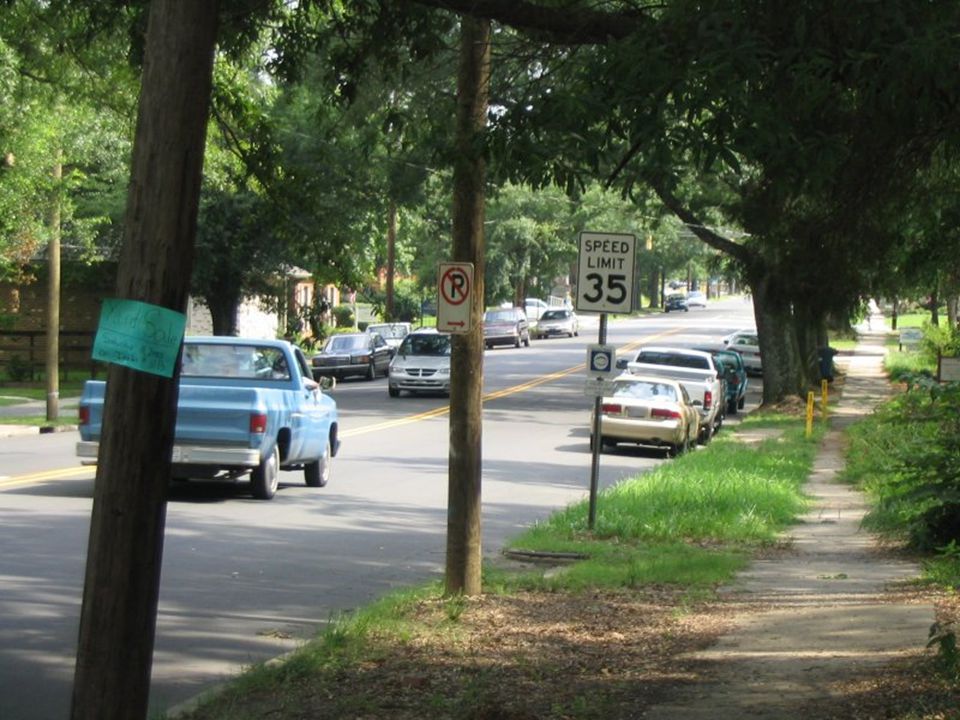
Answer these questions
Are there cars parked on the sides of the road? What color is the pickup truck driving in the road? Any minivans around? What does the green sign say? Were there any pedestrians on the road? What's the speed limit?

8
Question 1 Are there cars parked on the sides of the road?

10
Question 2 What color is the pickup truck driving in the road?

12
Question 3 Any minivans around?

14
Question 4 What does the green sign say?

16
Question 5 What's the speed limit?

18
Question 6 Are there any pedestrians on the road?

20
Observation vs. Inference
On the next slide, state whether the statement is an observation or an inference.

21
1. There is a representation of a face on one side of the coin.
2. The Latin word "Dei" means "God." 3. The coin was made by deeply religious people. 4. The date 1722 is printed on one side of the coin. 5. The coin was made in 1722. 6. The face on the coin is a representation of the nation's president.

22
Try This… Record observations for one minute.

23
Explaining and Interpreting Evidence
What is a hypothesis? A proposed explanation for an observed set of facts. Must be testable by performing controlled experiments and collecting data Some hypotheses may be supported, and others may not be supported.

24
Science as a Way of Knowing
Science is an ongoing process – it continually changes. Good scientists are skeptics; they question new as well as existing ideas.

25
1-2 How Scientists Work About 2000 years ago a Roman poet wrote these directions for producing bees: Kill a bull during the first thaw of winter. Build a shed. Place the dead bull on branches and herbs inside the shed. Wait for summer. The decaying body of the bull will produce bees.

26
Spontaneous Generation
Aristotle proposed 2300 years ago that a “vital force” was present in the air that caused living things to arise from nonliving things. This was called spontaneous generation. In the 1600s, scientists began to question this theory. To test this theory, scientists used the scientific method.

27
Flowchart Designing an Experiment State the Problem Analyze Results
Section 1-2 Designing an Experiment State the Problem Analyze Results Form a Hypothesis Draw a Conclusion Set Up a Controlled Experiment Publish Results Record Results

28
A Different Hypothesis
In the 1600s, people believed rotting meat produced maggots spontaneously. In 1668, Francesco Redi proposed that flies were landing on the meat and laying eggs, which hatched into maggots. He conducted a controlled experiment to test his hypothesis. In a controlled experiment only one variable is tested at a time.

29
Redi’s Experiment on Spontaneous Generation
Section 1-2 OBSERVATIONS: Flies land on meat that is left uncovered. Later, maggots appear on the meat. HYPOTHESIS: Flies produce maggots. PROCEDURE Uncovered jars Covered jars Controlled Variables: jars, type of meat, location, temperature, time Several days pass Independent Variable: gauze covering that keeps flies away from meat Dependent Variable: whether maggots appear Maggots appear No maggots appear CONCLUSION: Maggots form only when flies come in contact with meat. Spontaneous generation of maggots did not occur.

30
Biogenesis Redi concluded that living things could only come from other living things.

31
Repeating Investigations
In the 1700s John Needham, an English scientist, conducted an experiment to test Redi’s idea (skeptic). He said animalcules could arise from gravy, contradicting Redi’s work. He boiled gravy, sealed the flask, and days later microorganisms appeared in the flask thus “supporting” the theory of spontaneous generation.
. He said animalcules could arise from gravy, contradicting Redi’s work. He boiled gravy, sealed the flask, and days later microorganisms appeared in the flask thus supporting the theory of spontaneous generation.")
32
Repeating Investigations
An Italian scholar, Lazzaro Spallanzani, didn’t believe Needham’s results (skeptic). He said Needham didn’t boil the gravy long enough, so he repeated his experiment with modifications…
. He said Needham didn’t boil the gravy long enough, so he repeated his experiment with modifications…")
33
Figure 1-10 Spallanzani’s Experiment
Section 1-2 Gravy is boiled. Flask is open. Gravy is teeming with microorganisms. Flask is sealed. Gravy is free of microorganisms. Gravy is boiled.

34
Biogenesis again… Spallanzani concluded that nonliving gravy did not produce living things. The microorganisms came from the air.

35
Repeating Investigations
By the 1800s, some scientists still supported the theory of spontaneous generation. They felt sealing the flask cut off the “vital life force” in the air. In 1864, Louis Pasteur settled the debate. He designed a flask that could keep airborne microbes out without being sealed.

36
Figure 1-11 Pasteur’s Experiment
Section 1-2 Broth is boiled. Broth is free of microorganisms for a year. Curved neck is removed. Broth is teeming with microorganisms.

37
Figure 1-11 Pasteur’s Experiment
Section 1-2 Broth is boiled. Broth is free of microorganisms for a year. Curved neck is removed. Broth is teeming with microorganisms.

38
Figure 1-11 Pasteur’s Experiment
Section 1-2 Broth is boiled. Broth is free of microorganisms for a year. Curved neck is removed. Broth is teeming with microorganisms.

39
Figure 1-11 Pasteur’s Experiment
Section 1-2 Broth is boiled. Broth is free of microorganisms for a year. Curved neck is removed. Broth is teeming with microorganisms.

40
Pasteur’s Work Louis Pasteur’s work revolutionized the food and wine industry. The process of heating foods until microorganisms are killed before packaging is called “Pasteurization”.

41
Alternative Investigations
Controlled experiments are not always possible. Field studies - animals Medical research – clinical trials Environmental research Scientific methodology is still used: Large study groups Controlled variables

42
Theories The theory of biogenesis developed from many experiments that tested the hypothesis that new organisms come from existing organisms. When a hypothesis becomes very well supported it is considered a theory. A theory is defined as a well tested explanation that unifies a broad range of observations. Can theories change? Can a theory be proven true?

43
1-3 Studying Life Biology –
-bios = life -logy = study of Living things share certain characteristics.

44
Characteristics of Living Things
Section 1-3 Characteristic Examples Living things are made up of units called cells. Many microorganisms consist of only a single cell. Animals and trees are multicellular. Living things reproduce. Maple trees reproduce sexually. A hydra can reproduce asexually by budding. Living things are based on a universal genetic code. Flies produce flies. Dogs produce dogs. Seeds from maple trees produce maple trees. Living things grow and develop. Flies begin life as eggs, then become maggots, and then become adult flies. Living things obtain and use materials and energy. Plants obtain their energy from sunlight. Animals obtain their energy from the food they eat. Living things respond to their environment. Leaves and stems of plants grow toward light. Living things maintain a stable internal environment. Despite changes in the temperature of the environment, a robin maintains a constant body temperature. Taken as a group, living things change over time. Plants that live in the desert survive because they have become adapted to the conditions of the desert.

45
Branches of Biology Zoologists – Botanists – Paleontologists –
animals Botanists – plants Paleontologists – ancient life Microbiologists – microscopic life Immunologists – Disease Ecologists – Organisms and their environment

46
Levels of Organization
Living things may be studied on many different levels. The largest and most complex level is the biosphere. The smallest level is the molecule.

47
Levels of Organization
Section 1-3 Biosphere The part of Earth that contains all ecosystems Biosphere Ecosystem Community and its nonliving surroundings Hawk, snake, bison, prairie dog, grass, stream, rocks, air Community Populations that live together in a defined area Hawk, snake, bison, prairie dog, grass Population Group of organisms of one type that live in the same area Bison herd

48
Levels of Organization continued
Section 1-3 Organism Individual living thing Bison Tissues, organs, and organ systems Groups of Cells Nervous tissue Brain Nervous system Smallest functional unit of life Cells Nerve cell Groups of atoms; smallest unit of most chemical compounds Molecules Water DNA

49
1-4 Tools and Procedures Scientists use a common measurement system:
The metric system, or SI Some standard units of measurement are: Length – Meter Ruler or meter stick Volume – Liter Graduated cylinder or pipet Mass – Gram balance Temperature Celsius thermometer

50
Analyzing Data Data tables are used to stay organized when recording data. Graphs are used to make data easier to interpret and see trends (patterns).
.")
51
Making a Graph From A Data Table
Section 1-4 Making a Graph From A Data Table Water Released and Absorbed by Tree Absorbed by Roots (g/h) Released by Leaves (g/h) 20 Water released by leaves Time 15 8 AM 1 2 Relative Rates (g/h) 10 10 AM 1 5 12 PM 4 12 5 2 PM 6 17 Water absorbed by roots 4 PM 9 16 6 PM 14 10 8 AM 10 AM 12 PM 2 PM 4 PM 6 PM 8 PM 8 PM 10 3 Time
 Released. by Leaves. (g/h) 20. Water released by leaves. Time AM Relative Rates (g/h) AM PM PM Water absorbed by roots. 4 PM PM AM. 10 AM. 12 PM. 2 PM. 4 PM. 6 PM. 8 PM. 8 PM Time.")
52
Microscopes Devices that produce magnified images of structures that are too small to see with the unaided eye. Three common microscopes are: Light microscope Can magnify up to 1000X Useful for viewing cells Electron microscope Can magnify up to 100,000X Useful for seeing parts of cells Dissecting (stereo) microscope Can magnify up to 5X Useful for dissections
 microscope. Can magnify up to 5X. Useful for dissections.")
56
Laboratory Techniques
Two common techniques for studying cells are cell culture and cell fractionation. Cell culture Cells are grown in sterile dishes Especially useful for growing stem cells Cell fractionation Cells are broken apart in a blender Cell parts are separated in a centrifuge

Similar presentations


>")


