Download presentation
Presentation is loading. Please wait.

1
Capital Structure, long term financing Policy, and dividend policy

2
Capital Restructuring
We are going to look at how changes in capital structure affect the value of the firm, all else equal Capital restructuring involves changing the amount of leverage a firm has without changing the firm’s assets The firm can increase leverage by issuing debt and repurchasing outstanding shares The firm can decrease leverage by issuing new shares and retiring outstanding debt

3
Choosing a Capital Structure
What is the primary goal of financial managers? Maximize stockholder wealth We want to choose the capital structure that will maximize stockholder wealth We can maximize stockholder wealth by maximizing the value of the firm or minimizing the WACC Remind students that the WACC is the appropriate discount rate for the risk of the firm’s assets. We can find the value of the firm by discounting the firm’s expected future cash flows at the discount rate – the process is the same as finding the value of anything else. Since value and discount rate move in opposite directions, firm value will be maximized when WACC is minimized.

4
The Effect of Leverage How does leverage affect the EPS and ROE of a firm? When we increase the amount of debt financing, we increase the fixed interest expense If we have a really good year, then we pay our fixed cost and we have more left over for our stockholders If we have a really bad year, we still have to pay our fixed costs and we have less left over for our stockholders Leverage amplifies the variation in both EPS and ROE Remind the students that if we increase the amount of debt in a restructuring, we are decreasing the amount of outstanding shares.

5
Example: Financial Leverage, EPS and ROE – Part I
We will ignore the effect of taxes at this stage What happens to EPS and ROE when we issue debt and buy back shares of stock? Click on the Excel icon to go to a spreadsheet that contains all of the information for the example presented in the instructors manual.

6
Example: Financial Leverage, EPS and ROE – Part II
Variability in ROE Current: ROE ranges from 6% to 20% Proposed: ROE ranges from 2% to 30% Variability in EPS Current: EPS ranges from $0.60 to $2.00 Proposed: EPS ranges from $0.20 to $3.00 The variability in both ROE and EPS increases when financial leverage is increased

7
Break-Even EBIT Find EBIT where EPS is the same under both the current and proposed capital structures If we expect EBIT to be greater than the break-even point, then leverage is beneficial to our stockholders If we expect EBIT to be less than the break-even point, then leverage is detrimental to our stockholders

8
Example: Break-Even EBIT
Click on the Excel icon to see the graph of the break-even analysis

9
Example: Homemade Leverage and ROE
Current Capital Structure Investor borrows $500 and uses $500 of her own to buy 100 shares of stock Payoffs: Recession: 100(0.60) - .1(500) = $10 Expected: 100(1.30) - .1(500) = $80 Expansion: 100(2.00) - .1(500) = $150 Mirrors the payoffs from purchasing 50 shares from the firm under the proposed capital structure Proposed Capital Structure Investor buys $250 worth of stock (25 shares) and $250 worth of bonds paying 10%. Payoffs: Recession: 25(.20) + .1(250) = $30 Expected: 25(1.60) + .1(250) = $65 Expansion: 25(3.00) + .1(250) = $100 Mirrors the payoffs from purchasing 50 shares under the current capital structure The choice of capital structure is irrelevant if the investor can duplicate the cash flows on their own. Note that all of the positions require an investment of $500 of the investors money. We are still ignoring taxes and transaction costs. If we factor in these market imperfections, then homemade leverage will not work quite as easily, but the general idea is the same.
 - .1(500) = $10. Expected: 100(1.30) - .1(500) = $80. Expansion: 100(2.00) - .1(500) = $150. Mirrors the payoffs from purchasing 50 shares from the firm under the proposed capital structure. Proposed Capital Structure. Investor buys $250 worth of stock (25 shares) and $250 worth of bonds paying 10%. Payoffs: Recession: 25(.20) + .1(250) = $30. Expected: 25(1.60) + .1(250) = $65. Expansion: 25(3.00) + .1(250) = $100. Mirrors the payoffs from purchasing 50 shares under the current capital structure. The choice of capital structure is irrelevant if the investor can duplicate the cash flows on their own. Note that all of the positions require an investment of $500 of the investors money. We are still ignoring taxes and transaction costs. If we factor in these market imperfections, then homemade leverage will not work quite as easily, but the general idea is the same.")
10
Capital Structure Theory
Modigliani and Miller Theory of Capital Structure Proposition I – firm value Proposition II – WACC The value of the firm is determined by the cash flows to the firm and the risk of the assets Changing firm value Change the risk of the cash flows Change the cash flows

11
Capital Structure Theory Under Three Special Cases
Case I – Assumptions No corporate or personal taxes No bankruptcy costs Case II – Assumptions Corporate taxes, but no personal taxes Case III – Assumptions Bankruptcy costs

12
Case I – Propositions I and II
Proposition I The value of the firm is NOT affected by changes in the capital structure The cash flows of the firm do not change; therefore, value doesn’t change Proposition II The WACC of the firm is NOT affected by capital structure The main point with case I is that it doesn’t matter how we divide our cash flows between our stockholders and bondholders, the cash flow of the firm doesn’t change. Since the cash flows don’t change; and we haven’t changed the risk of existing cash flows, the value of the firm won’t change.

13
Case I - Equations WACC = RA = (E/V)RE + (D/V)RD
RE = RA + (RA – RD)(D/E) RA is the “cost” of the firm’s business risk, i.e., the risk of the firm’s assets (RA – RD)(D/E) is the “cost” of the firm’s financial risk, i.e., the additional return required by stockholders to compensate for the risk of leverage Remind students that case I is a world without taxes. That is why the term (1 – TC) is not included in the WACC equation.
(D/E) RA is the cost of the firm’s business risk, i.e., the risk of the firm’s assets. (RA – RD)(D/E) is the cost of the firm’s financial risk, i.e., the additional return required by stockholders to compensate for the risk of leverage. Remind students that case I is a world without taxes. That is why the term (1 – TC) is not included in the WACC equation.")
15
Case I - Example Data What is the cost of equity?
Required return on assets = 16%, cost of debt = 10%; percent of debt = 45% What is the cost of equity? RE = 16 + ( )(.45/.55) = 20.91% Suppose instead that the cost of equity is 25%, what is the debt-to-equity ratio? 25 = 16 + ( )(D/E) D/E = ( ) / ( ) = 1.5 Based on this information, what is the percent of equity in the firm? E/V = 1 / 2.5 = 40% Remind students that if the firm is financed with 45% debt, then it is financed with 55% equity. At this point, you may need to remind them that one way to compute the D/E ratio is %debt / (1-%debt) The second question is used to reinforce that RA does not change when the capital structure changes Many students will not immediately see how to get the % of equity from the D/E ratio. Remind them that D+E = V. We are looking at ratios, so the actual $ amount of D and E is not important. All that matters is the relationship between them. So, let E = 1. Then D/1 = 1.5; Solve for D; D = 1.5. Then V = = 2.5 and the percent equity is 1 / 2.5 = 40%. They often don’t understand that the choice of E = 1 is for simplicity. If they are confused about the process, then show them that it doesn’t matter what you set E equal to, as long as you keep the relationships intact. So, let E = 5; then D/5 = 1.5 and D = 5(1.5) = 7.5; V = = 12.5 and E/V = 5 / 12.5 = 40%.
(.45/.55) = 20.91% Suppose instead that the cost of equity is 25%, what is the debt-to-equity ratio 25 = 16 + ( )(D/E) D/E = ( ) / ( ) = 1.5. Based on this information, what is the percent of equity in the firm E/V = 1 / 2.5 = 40% Remind students that if the firm is financed with 45% debt, then it is financed with 55% equity. At this point, you may need to remind them that one way to compute the D/E ratio is %debt / (1-%debt) The second question is used to reinforce that RA does not change when the capital structure changes. Many students will not immediately see how to get the % of equity from the D/E ratio. Remind them that D+E = V. We are looking at ratios, so the actual $ amount of D and E is not important. All that matters is the relationship between them. So, let E = 1. Then D/1 = 1.5; Solve for D; D = 1.5. Then V = = 2.5 and the percent equity is 1 / 2.5 = 40%. They often don’t understand that the choice of E = 1 is for simplicity. If they are confused about the process, then show them that it doesn’t matter what you set E equal to, as long as you keep the relationships intact. So, let E = 5; then D/5 = 1.5 and D = 5(1.5) = 7.5; V = = 12.5 and E/V = 5 / 12.5 = 40%.")
16
The CAPM, the SML and Proposition II
How does financial leverage affect systematic risk? CAPM: RA = Rf + A(RM – Rf) Where A is the firm’s asset beta and measures the systematic risk of the firm’s assets Proposition II Replace RA with the CAPM and assume that the debt is riskless (RD = Rf) RE = Rf + A(1+D/E)(RM – Rf) Intuitively, an increase in financial leverage should increase systematic risk since changes in interest rates are a systematic risk factor and will have more impact the higher the financial leverage. The assumption that debt is riskless is for simplicity and to illustrate that even if debt is default risk-free, it still increases the variability of cash flows to the stockholders, and thus increases the systematic risk.
 Where A is the firm’s asset beta and measures the systematic risk of the firm’s assets. Proposition II. Replace RA with the CAPM and assume that the debt is riskless (RD = Rf) RE = Rf + A(1+D/E)(RM – Rf) Intuitively, an increase in financial leverage should increase systematic risk since changes in interest rates are a systematic risk factor and will have more impact the higher the financial leverage. The assumption that debt is riskless is for simplicity and to illustrate that even if debt is default risk-free, it still increases the variability of cash flows to the stockholders, and thus increases the systematic risk.")
17
Business Risk and Financial Risk
RE = Rf + A(1+D/E)(RM – Rf) CAPM: RE = Rf + E(RM – Rf) E = A(1 + D/E) Therefore, the systematic risk of the stock depends on: Systematic risk of the assets, A, (Business risk) Level of leverage, D/E, (Financial risk) Point out once again that this result assumes that the debt is risk-free. The effect of leverage on financial risk will be even greater if the debt is not default free.
(RM – Rf) CAPM: RE = Rf + E(RM – Rf) E = A(1 + D/E) Therefore, the systematic risk of the stock depends on: Systematic risk of the assets, A, (Business risk) Level of leverage, D/E, (Financial risk) Point out once again that this result assumes that the debt is risk-free. The effect of leverage on financial risk will be even greater if the debt is not default free.")
18
Case II – Cash Flow Interest is tax deductible
Therefore, when a firm adds debt, it reduces taxes, all else equal The reduction in taxes increases the cash flow of the firm How should an increase in cash flows affect the value of the firm? Point out that the government effectively pays part of our interest expense for us; it is subsidizing a portion of the interest payment.

19
Case II - Example Unlevered Firm Levered Firm EBIT 5,000 Interest 500
500 Taxable Income 4,500 Taxes (34%) 1,700 1,530 Net Income 3,300 2,970 CFFA 3,470 The levered firm has 6,250 in 8% debt, so the interest expense = .08(6,250) = 500 CFFA = EBIT – taxes (depreciation expense is the same in either case, so it will not affect CFFA on an incremental basis)
 1,700. 1,530. Net Income. 3,300. 2,970. CFFA. 3,470. The levered firm has 6,250 in 8% debt, so the interest expense = .08(6,250) = 500. CFFA = EBIT – taxes (depreciation expense is the same in either case, so it will not affect CFFA on an incremental basis)")
20
Interest Tax Shield Annual interest tax shield
Tax rate times interest payment 6,250 in 8% debt = 500 in interest expense Annual tax shield = .34(500) = 170 Present value of annual interest tax shield Assume perpetual debt for simplicity PV = 170 / .08 = 2,125 PV = D(RD)(TC) / RD = DTC = 6,250(.34) = 2,125 Point out that the increase in cash flow in the example is exactly equal to the interest tax shield The assumption of perpetual debt makes the equations easier to work with, but it is useful to ask the students what would happen if we did not assume perpetual debt.
 = 170. Present value of annual interest tax shield. Assume perpetual debt for simplicity. PV = 170 / .08 = 2,125. PV = D(RD)(TC) / RD = DTC = 6,250(.34) = 2,125. Point out that the increase in cash flow in the example is exactly equal to the interest tax shield. The assumption of perpetual debt makes the equations easier to work with, but it is useful to ask the students what would happen if we did not assume perpetual debt.")
21
Case II – Proposition I The value of the firm increases by the present value of the annual interest tax shield Value of a levered firm = value of an unlevered firm + PV of interest tax shield Value of equity = Value of the firm – Value of debt Assuming perpetual cash flows VU = EBIT(1-T) / RU VL = VU + DTC RU is the cost of capital for an unlevered firm = RA for an unlevered firm VU is jus the PV of the expected future cash flow from assets for an unlevered firm.
 / RU. VL = VU + DTC. RU is the cost of capital for an unlevered firm = RA for an unlevered firm. VU is jus the PV of the expected future cash flow from assets for an unlevered firm.")
22
Example: Case II – Proposition I
Data EBIT = 25 million; Tax rate = 35%; Debt = $75 million; Cost of debt = 9%; Unlevered cost of capital = 12% VU = 25(1-.35) / .12 = $ million VL = (.35) = $ million E = – 75 = $86.67 million
 / .12 = $ million. VL = (.35) = $ million. E = – 75 = $86.67 million.")
24
Case II – Proposition II
The WACC decreases as D/E increases because of the government subsidy on interest payments RA = (E/V)RE + (D/V)(RD)(1-TC) RE = RU + (RU – RD)(D/E)(1-TC) Example RE = 12 + (12-9)(75/86.67)(1-.35) = 13.69% RA = (86.67/161.67)(13.69) + (75/161.67)(9)(1-.35) RA = 10.05%
RE + (D/V)(RD)(1-TC) RE = RU + (RU – RD)(D/E)(1-TC) Example. RE = 12 + (12-9)(75/86.67)(1-.35) = 13.69% RA = (86.67/161.67)(13.69) + (75/161.67)(9)(1-.35) RA = 10.05%")
25
Example: Case II – Proposition II
Suppose that the firm changes its capital structure so that the debt-to-equity ratio becomes 1. What will happen to the cost of equity under the new capital structure? RE = 12 + (12 - 9)(1)(1-.35) = 13.95% What will happen to the weighted average cost of capital? RA = .5(13.95) + .5(9)(1-.35) = 9.9% Remind students that a D/E ratio = 1 implies 50% equity and 50% debt. The amount of leverage in the firm increased, the cost of equity increased, but the overall cost of capital decreased.
(1)(1-.35) = 13.95% What will happen to the weighted average cost of capital RA = .5(13.95) + .5(9)(1-.35) = 9.9% Remind students that a D/E ratio = 1 implies 50% equity and 50% debt. The amount of leverage in the firm increased, the cost of equity increased, but the overall cost of capital decreased.")
27
Case III Now we add bankruptcy costs
As the D/E ratio increases, the probability of bankruptcy increases This increased probability will increase the expected bankruptcy costs At some point, the additional value of the interest tax shield will be offset by the increase in expected bankruptcy cost At this point, the value of the firm will start to decrease and the WACC will start to increase as more debt is added Note that we are talking about “expected” in a statistical sense. If the firm goes bankrupt – it will have a certain level of costs it will incur. If the firm is all equity, then the expected bankruptcy cost is 0 since the probability of bankruptcy is 0. As the firm adds debt, the probability of incurring the bankruptcy costs increases, and thus the expected bankruptcy cost increases.

28
Bankruptcy Costs Direct costs Financial distress
Legal and administrative costs Ultimately cause bondholders to incur additional losses Disincentive to debt financing Financial distress Significant problems in meeting debt obligations Most firms that experience financial distress do not ultimately file for bankruptcy

29
More Bankruptcy Costs Indirect bankruptcy costs
Larger than direct costs, but more difficult to measure and estimate Stockholders want to avoid a formal bankruptcy filing Bondholders want to keep existing assets intact so they can at least receive that money Assets lose value as management spends time worrying about avoiding bankruptcy instead of running the business The firm may also lose sales, experience interrupted operations and lose valuable employees

32
Conclusions Case I – no taxes or bankruptcy costs
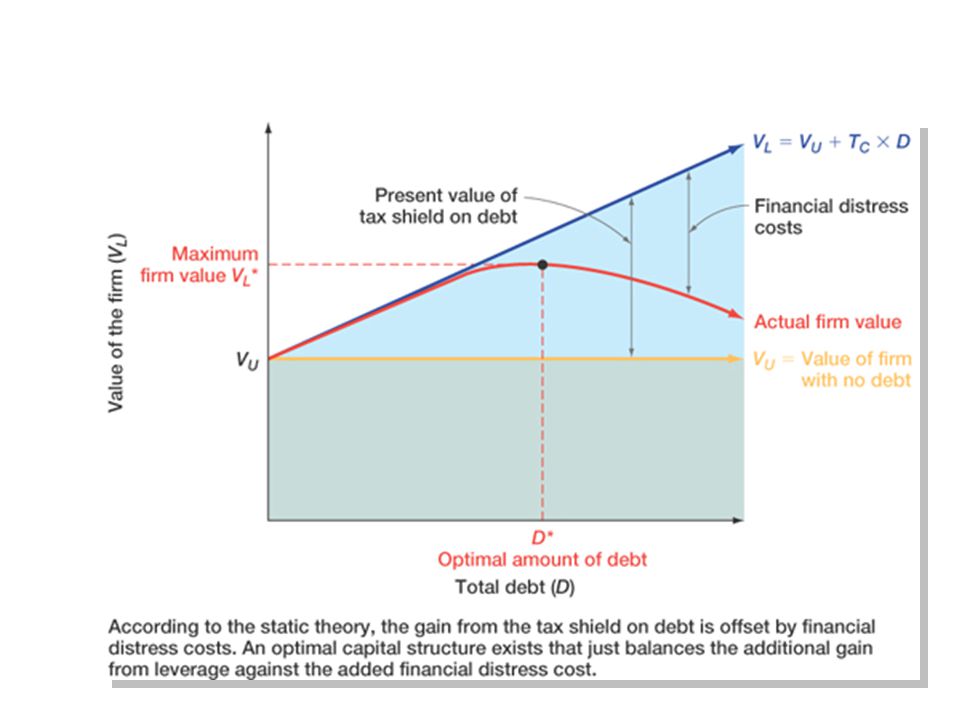
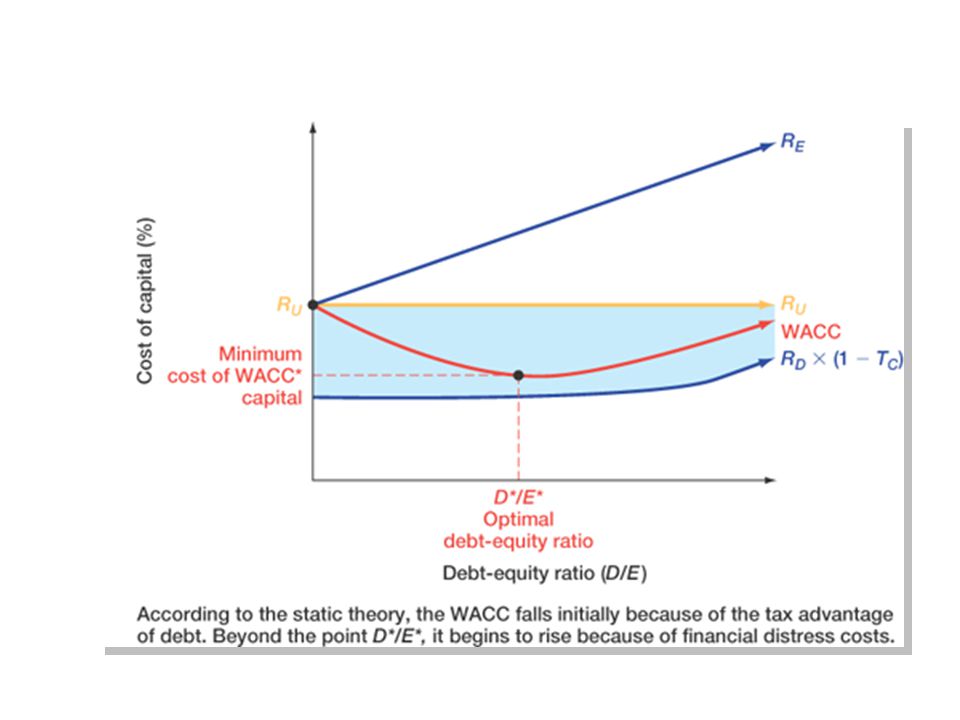
No optimal capital structure Case II – corporate taxes but no bankruptcy costs Optimal capital structure is almost 100% debt Each additional dollar of debt increases the cash flow of the firm Case III – corporate taxes and bankruptcy costs Optimal capital structure is part debt and part equity Occurs where the benefit from an additional dollar of debt is just offset by the increase in expected bankruptcy costs

34
Managerial Recommendations
The tax benefit is only important if the firm has a large tax liability Risk of financial distress The greater the risk of financial distress, the less debt will be optimal for the firm The cost of financial distress varies across firms and industries and as a manager you need to understand the cost for your industry

35
Figure 17.9

36
The Value of the Firm Value of the firm = marketed claims + nonmarketed claims Marketed claims are the claims of stockholders and bondholders Nonmarketed claims are the claims of the government and other potential stakeholders The overall value of the firm is unaffected by changes in capital structure The division of value between marketed claims and nonmarketed claims may be impacted by capital structure decisions

37
Observed Capital Structure
Capital structure does differ by industries Differences according to Cost of Capital 2004 Yearbook by Ibbotson Associates, Inc. Lowest levels of debt Drugs with 6.38% debt Paper and computers with – 10.68% debt Highest levels of debt Airlines with 64.22% debt Electric utilities with 49.03% debt See Table 17.7 in the book for more detail

38
Bankruptcy Process – Part I
Business failure – business has terminated with a loss to creditors Legal bankruptcy – petition federal court for bankruptcy Technical insolvency – firm is unable to meet debt obligations Accounting insolvency – book value of equity is negative

39
Bankruptcy Process – Part II
Liquidation Chapter 7 of the Federal Bankruptcy Reform Act of 1978 Trustee takes over assets, sells them and distributes the proceeds according to the absolute priority rule Reorganization Chapter 11 of the Federal Bankruptcy Reform Act of 1978 Restructure the corporation with a provision to repay creditors

40
Quick Quiz Explain the effect of leverage on EPS and ROE
What is the break-even EBIT and how do we compute it? How do we determine the optimal capital structure? What is the optimal capital structure in the three cases that were discussed in this chapter? What is the difference between liquidation and reorganization?

41
Cash Dividends Regular cash dividend – cash payments made directly to stockholders, usually each quarter Extra cash dividend – indication that the “extra” amount may not be repeated in the future Special cash dividend – similar to extra dividend, but definitely won’t be repeated Liquidating dividend – some or all of the business has been sold Cash dividends reduce cash and retained earnings (and liquidating dividends may also reduce paid-in capital)
")
42
Dividend Payment Declaration Date – Board declares the dividend and it becomes a liability of the firm Ex-dividend Date Occurs two business days before date of record If you buy stock on or after this date, you will not receive the dividend Stock price generally drops by about the amount of the dividend Date of Record – Holders of record are determined and they will receive the dividend payment Date of Payment – checks are mailed

43
Figure 18.2

44
Does Dividend Policy Matter?
Dividends matter – the value of the stock is based on the present value of expected future dividends Dividend policy may not matter Dividend policy is the decision to pay dividends versus retaining funds to reinvest in the firm In theory, if the firm reinvests capital now, it will grow and can pay higher dividends in the future

45
Illustration of Irrelevance
Consider a firm that can either pay out dividends of $10,000 per year for each of the next two years or can pay $9,000 this year, reinvest the other $1,000 into the firm and then pay $11,120 next year. Investors require a 12% return. Market Value with constant dividend = $16,900.51 Market Value with reinvestment = $16,900.51 If the company will earn the required return, then it doesn’t matter when it pays the dividends Assuming that the second dividend is a liquidating dividend and the firm ceases to exist after period 2. PV = 10,000 / ,000 / = 16,900.51 PV = 9,000 / ,120 / = 16,900.51

46
Low Payout Please Why might a low payout be desirable?
Individuals in upper income tax brackets might prefer lower dividend payouts, given the immediate tax liability, in favor of higher capital gains with the deferred tax liability Flotation costs – low payouts can decrease the amount of capital that needs to be raised, thereby lowering flotation costs Dividend restrictions – debt contracts might limit the percentage of income that can be paid out as dividends

47
High Payout Please Why might a high payout be desirable?
Desire for current income Individuals that need current income, i.e. retirees Groups that are prohibited from spending principal (trusts and endowments) Uncertainty resolution – no guarantee that the higher future dividends will materialize Taxes Dividend exclusion for corporations Tax-exempt investors don’t have to worry about differential treatment between dividends and capital gains
 Uncertainty resolution – no guarantee that the higher future dividends will materialize. Taxes. Dividend exclusion for corporations. Tax-exempt investors don’t have to worry about differential treatment between dividends and capital gains.")
48
Dividends and Signals Asymmetric information – managers have more information about the health of the company than investors Changes in dividends convey information Dividend increases Management believes it can be sustained Expectation of higher future dividends, increasing present value Signal of a healthy, growing firm Dividend decreases Management believes it can no longer sustain the current level of dividends Expectation of lower dividends indefinitely; decreasing present value Signal of a firm that is having financial difficulties

49
Clientele Effect Some investors prefer low dividend payouts and will buy stock in those companies that offer low dividend payouts Some investors prefer high dividend payouts and will buy stock in those companies that offer high dividend payouts

50
Implications of the Clientele Effect
What do you think will happen if a firm changes its policy from a high payout to a low payout? What do you think will happen if a firm changes its policy from a low payout to a high payout? If this is the case, does dividend POLICY matter? If a firm changes its policy, it will just have different investors. Consequently, dividend policy won’t affect the value of the stock.

51
Dividend Policy in Practice
Residual dividend policy Constant growth dividend policy – dividends increased at a constant rate each year Constant payout ratio – pay a constant percent of earnings each year Compromise dividend policy We will talk about the residual policy and the compromise policy in more detail Given the information content of dividends, will a constant growth policy be good for the stockholders? Given the information content of dividends – will a constant payout ratio be good for stockholders?

52
Residual Dividend Policy
Determine capital budget Determine target capital structure Finance investments with a combination of debt and equity in line with the target capital structure Remember that retained earnings are equity If additional equity is needed, issue new shares If there are excess earnings, then pay the remainder out in dividends

53
Example – Residual Dividend Policy
Given Need $5 million for new investments Target capital structure: D/E = 2/3 Net Income = $4 million Finding dividend 40% financed with debt (2 million) 60% financed with equity (3 million) NI – equity financing = $1 million, paid out as dividends Remind students how to get % debt and % equity given D/E: If D/E = 2/3, then V = = 5, so D/V = 2/5 = 40% and E/V = 3/5 = 60%
 60% financed with equity (3 million) NI – equity financing = $1 million, paid out as dividends. Remind students how to get % debt and % equity given D/E: If D/E = 2/3, then V = = 5, so D/V = 2/5 = 40% and E/V = 3/5 = 60%")
54
Compromise Dividend Policy
Goals, ranked in order of importance Avoid cutting back on positive NPV projects to pay a dividend Avoid dividend cuts Avoid the need to sell equity Maintain a target debt/equity ratio Maintain a target dividend payout ratio Companies want to accept positive NPV projects, while avoiding negative signals

55
Managements’ View of Dividend Policy
Agree or Strongly Agree 93.8% Try to avoid reducing dividends per share 89.6% Try to maintain a smooth dividend from year to year 41.7% pay dividends to attract investors subject to “prudent man” restrictions Important or Very Important 84.1% Maintaining consistency with historic dividend policy 71.9% Stability of future earnings 9.3% Flotation costs to issue new equity See Tables 18.2 and 18.3

56
Stock Repurchase Company buys back its own shares of stock
Tender offer – company states a purchase price and a desired number of shares Open market – buys stock in the open market Similar to a cash dividend in that it returns cash from the firm to the stockholders This is another argument for dividend policy irrelevance in the absence of taxes or other imperfections

57
Real-World Considerations
Stock repurchase allows investors to decide if they want the current cash flow and associated tax consequences In our current tax structure, repurchases may be more desirable due to the options provided stockholders The IRS recognizes this and will not allow a stock repurchase for the sole purpose of allowing investors to avoid taxes

58
Information Content of Stock Repurchases
Stock repurchases send a positive signal that management believes that the current price is low Tender offers send a more positive signal than open market repurchases because the company is stating a specific price The stock price often increases when repurchases are announced

59
Example: Repurchase Announcement
“America West Airlines announced that its Board of Directors has authorized the purchase of up to 2.5 million shares of its Class B common stock on the open market as circumstances warrant over the next two years … “Following the approval of the stock repurchase program by the company’s Board of Directors earlier today. W. A. Franke, chairman and chief officer said ‘The stock repurchase program reflects our belief that America West stock may be an attractive investment opportunity for the Company, and it underscores our commitment to enhancing long-term shareholder value.’ “The shares will be repurchased with cash on hand, but only if and to the extent the Company holds unrestricted cash in excess of $200 million to ensure that an adequate level of cash and cash equivalents is maintained.”

60
Stock Dividends Pay additional shares of stock instead of cash
Increases the number of outstanding shares Small stock dividend Less than 20 to 25% If you own 100 shares and the company declared a 10% stock dividend, you would receive an additional 10 shares Large stock dividend – more than 20 to 25%

61
Stock Splits Stock splits – essentially the same as a stock dividend except expressed as a ratio For example, a 2 for 1 stock split is the same as a 100% stock dividend Stock price is reduced when the stock splits Common explanation for split is to return price to a “more desirable trading range” www: Click on the web surfer icon to find out about upcoming stock splits and dividends

62
Quick Quiz What are the different types of dividends and how is a dividend paid? What is the clientele effect and how does it affect dividend policy relevance? What is the information content of dividend changes? What is the difference between a residual dividend policy and a compromise dividend policy? What are stock dividends and how do they differ from cash dividends? How are share repurchases an alternative to dividends and why might investors prefer them?

Similar presentations