Download presentation
Presentation is loading. Please wait.

1
Uri Shabi Shiri Chechik
Fast Image Search Presented by: Uri Shabi Shiri Chechik d For the Advanced Topics in Computer Vision course Spring 2007

2
Introduction - The tasks Recognition:
Given a database of images and an input query image, we wish to find an image in the database that represents the same object as in the query image. Classification: Given a database of images, the algorithm: Divides the images into groups Given a query image it returns the group that the image belongs to

3
Introduction - The tasks Database Query Image Results
Here is an example of a database we are giving, where we can see that we have four different images to the same object from different point of view. We also get another image and our goal is to find the images from the database that represents the same object D Nister, H Stewenius. Scalable Recognition with a Vocabulary Tree. CVPR’

4
Introduction - The tasks Database Query Image
Here is an example of a database we are giving, where we can see that we have four different images to the same object from different point of view. We also get another image and our goal is to find the images from the database that represents the same object

5
Introduction - The problem
D Nister, H Stewenius. Scalable Recognition with a Vocabulary Tree. CVPR’

6
Introduction - How many object categories are there? Biederman 1987
Also if we just check how many different categories there are, we will find that there are too many to handle them all Biederman 1987

7
Challenges 1: view point variation
Introduction - The Challenges Challenges 1: view point variation We may encounter a few challenges on our way to solve the problem One of them is that images of the same object can be taken from different point of view Michelangelo Adapted with permission from Fei Fei Li -

8
Challenges 2: illumination
Introduction - The Challenges Challenges 2: illumination We may have the same image under different illumination, under different lighting conditions Adapted with permission from Fei Fei Li -

9
Challenges 3: occlusion
Introduction - The Challenges Challenges 3: occlusion Sometimes part of our object may be occluded, here we can see that part of the horse id hidden behind the tree, for example we can’t see the horse tail Magritte, 1957 Adapted with permission from Fei Fei Li -

10
Introduction - The Challenges Challenges 4: scale
Same object different scales, sometimes the object we are looking for inside an image take only small percentage of the total image size Adapted with permission from Fei Fei Li -

11
Challenges 5: deformation
Introduction - The Challenges Challenges 5: deformation Deformation – Sometimes the object can be distorted or even we might have only painting of our object and not a real image Xu, Beihong 1943 Adapted with permission from Fei Fei Li -

12
Introduction - The Challenges To sum up, we have few challenges:
View point variation Illumination Occlusion Scale Deformation We will show here an approach of how to represents a document If we take a regular document, one way to represent the document is by the words appear in it. Where we might want to ignore very common words like – the, an, be, we call those words stop list. If we wish to characterize a topic (like vision for example) we can do it by the words frequencies (for example we would except the word image to appear a lot on a document That handle the topic vision
 we can do it by the words frequencies (for example we would except the word image to appear a lot on a document. That handle the topic vision.")
13
- Bag of Words (Documents)
Introduction - Bag of Words (Documents) A document can be represented by a collection of words Common words can be ignored (the, an,etc.) – This is called a ‘stop List’ Words are represented by their stems ‘walk’, ‘walking’, ‘walks’ ’walk’ A topic can be recognized by Word frequencies Sivic & Zisserman. Video Google: a text retrieval approach to object matching in videos, Computer Vision, 2003
 A document can be represented by a collection of words. Common words can be ignored (the, an,etc.) – This is called a ‘stop List’ Words are represented by their stems. ‘walk’, ‘walking’, ‘walks’ ’walk’ A topic can be recognized by Word frequencies. Sivic & Zisserman. Video Google: a text retrieval approach to object matching in videos, Computer Vision,")
14
retinal, cerebral cortex,
Introduction - Bag of Words (Documents) Analogy to documents Of all the sensory impressions proceeding to the brain, the visual experiences are the dominant ones. Our perception of the world around us is based essentially on the messages that reach the brain from our eyes. For a long time it was thought that the retinal image was transmitted point by point to visual centers in the brain; the cerebral cortex was a movie screen, so to speak, upon which the image in the eye was projected. Through the discoveries of Hubel and Wiesel we now know that behind the origin of the visual perception in the brain there is a considerably more complicated course of events. By following the visual impulses along their path to the various cell layers of the optical cortex, Hubel and Wiesel have been able to demonstrate that the message about the image falling on the retina undergoes a step-wise analysis in a system of nerve cells stored in columns. In this system each cell has its specific function and is responsible for a specific detail in the pattern of the retinal image. sensory, brain, visual, perception, retinal, cerebral cortex, eye, cell, optical, eye nerve, image, visual, Hubel, Wiesel sensory perception Visual X 2 brain Here is an illustration of how to represent a document as a bag of words. The word brain appear only once so we will save one instance of it, the word visual appear twice to we will save two. retinal cerebral image cell eye X 2
 Analogy to documents. Of all the sensory impressions proceeding to the brain, the visual experiences are the dominant ones. Our perception of the world around us is based essentially on the messages that reach the brain from our eyes. For a long time it was thought that the retinal image was transmitted point by point to visual centers in the brain; the cerebral cortex was a movie screen, so to speak, upon which the image in the eye was projected. Through the discoveries of Hubel and Wiesel we now know that behind the origin of the visual perception in the brain there is a considerably more complicated course of events. By following the visual impulses along their path to the various cell layers of the optical cortex, Hubel and Wiesel have been able to demonstrate that the message about the image falling on the retina undergoes a step-wise analysis in a system of nerve cells stored in columns. In this system each cell has its specific function and is responsible for a specific detail in the pattern of the retinal image. sensory, brain, visual, perception, retinal, cerebral cortex, eye, cell, optical, eye. nerve, image, visual, Hubel, Wiesel. sensory. perception. Visual X 2. brain. Here is an illustration of how to represent a document as a bag of words. The word brain appear only once so we will save one instance of it, the word visual appear twice to we will save two. retinal. cerebral. image. cell. eye X 2.")
15
Introduction - Bag of Words Images can be represented by visual words
An object in an image can be recognized by visual word frequencies The same idea can also apply to images. Image can be represented by its visual words, by visual word we mean a feature. Here we can see examples of visual words, an eye can be thought as visual word. Like topics in documents, an object cab also recognize by visual words, for example it there are 2 eyes, a nose and a human mouth we are very likely to find a face in the image J Sivic, A Zisserman. Video Google: a text retrieval approach to object matching in videos. Computer Vision, 2003.

16
Introduction - Visual word
We could use a feature as a visual word, but Too many features Two features of the same object will never look the same A visual word is a “visual stem” which is represented by a descriptor What is a good code word (visual word)? Invariant to different view points, illumination, scale, shift and transformation The same idea can also apply to images. Image can be represented by its visual words, by visual word we mean a feature. Here we can see examples of visual words, an eye can be thought as visual word. Like topics in documents, an object cab also recognize by visual words, for example it there are 2 eyes, a nose and a human mouth we are very likely to find a face in the image
 Invariant to different view points, illumination, scale, shift and transformation. The same idea can also apply to images. Image can be represented by its visual words, by visual word we mean a feature. Here we can see examples of visual words, an eye can be thought as visual word. Like topics in documents, an object cab also recognize by visual words, for example it there are 2 eyes, a nose and a human mouth we are very likely to find a face in the image.")
17
Object Bag of ‘words’ Introduction - Bag of Words
Here we can see that the image of the lady is represents as a bag of words Adapted with permission from Fei Fei Li -

18
Another way to look at it is as an histogram of words.
We can see that the feature of the eye appear in the face image twice while the skin feature appear more Adapted with permission from Fei Fei Li -

19
Introduction - Bag of Words
The fact that we only use the frequencies of visual words, implies that this method is Translation Invariant. This is why it is called a ‘Bag of Words’, since two images with the same words are identified as the same image The same idea can also apply to images. Image can be represented by its visual words, by visual word we mean a feature. Here we can see examples of visual words, an eye can be thought as visual word. Like topics in documents, an object cab also recognize by visual words, for example it there are 2 eyes, a nose and a human mouth we are very likely to find a face in the image

20
Breaking down the problem
Feature Detection Feature Description Feature Recognition – how to find similar words to a query feature from a database of code words Image Recognition\Classification – how to find similar images to the query image\ how to classify our image We break our problem into four different issues. The first issue is how to detect the features (the visual words). The second one is after we have found the features how to describe them And after we broke our images to feature we would like find an algorithm that given a query feature find the closest features to that feature And finally given an image we would like to find the most close images from the database to that image.
. The second one is after we have found the features how to describe them. And after we broke our images to feature we would like find an algorithm that given a query feature find the closest features to that feature. And finally given an image we would like to find the most close images from the database to that image.")
21
category models (and/or) classifiers
learning recognition Feature detection & representation codewords dictionary image representation Here is an illustration of how to break down our problem into small sections. First we are giving a large number of training data of images, we break them to features and represent the features in some way, that our first and second issue w have mentioned. We also represents the images in some way (like bag of words), we can operate some classification algorithm in order to divide the images or to learn main topics and their visual words frequencies. Then we are giving a query image, we break it down into features, find to most close feature from our database which is our third main issue and using those features and the classification algorithm output we find the most close image Image recognition category models (and/or) classifiers Adapted with permission from Fei Fei Li -
, we can operate some classification algorithm in order to divide the images or to learn main topics and their visual words frequencies. Then we are giving a query image, we break it down into features, find to most close feature from our database which is our third main issue. and using those features and the classification algorithm output we find the most close image. Image. recognition. category models. (and/or) classifiers. Adapted with permission from Fei Fei Li -")
22
Feature Detection We can use any feature detection algorithms
We can use a mixture of feature detections and capture more types of features What is a good detection? Invariant to rotation, illumination, scale, shift and transformation There are many algorithms to detect features, we will focus on three from those that mentioned in the articles

23
Feature Description What is a good descriptor?
Invariant to different view points, illumination, scale, shift and transformation The image recognition is rotation or scale invariant if the detector & descriptor are as well. Since we use the bag approach we care about the word frequencies, it’s enough to make our feature detection and descriptor invarient in order our all method will be

24
Feature Description SIFT descriptor Local Frames of Reference

25
Feature Description - SIFT
We determine a local orientation according to the dominant gradient Define native coordinate system We take a 16×16 window and divide it into 16 4×4 windows We then compute the gradient orientation histogram of 8 main directions for each window A very common descriptor is the Sift descriptor, let recall it’s algorithm. We find the dominant gradient and set our coordinate system according to it. We take a 16×16 window around the feature and divide it into sixteen 4×4 windows. On each small window we define an histogram of main 8 direction, meaning on each point we check the gradient and add a 1 to the relevant direction from the eight. In the end we have 16 histograms of 8 directions in each – totally vector of 128 size We can see in the picture a small window of 8*8 which divided to four 4*4 windows, where we compute the gradient on each point and make an histogram of the 8 directions on each window.

26
Feature Description - SIFT Properties Rotation invariant
We can see that since we set our coordinate system to the main gradient , the descriptor becomes rotation invariant

27
Feature Description Works together with Distinguished Regions detector
- Local Affine Frames of Reference Works together with Distinguished Regions detector Assumption: Two frames of the same objects are related by affine transformation Idea: Find an affine transformation that best normalizes the frame. Two normalized frames of the same object will looks similar Another very nice and important descriptor is local affine frames of reference and in short LAFS. This descriptor works together with the distinguished regions detector, and let recall that this detector detect regions that are lighter or darker than the boundaries. Since we take small features we assume they are so small relative to their distance from the camera that we can treat them as planner scene. That lead us to the assumption that corresponding features are related through affine transformation. This idea is to find affine transformation that normalize the feature. And if we take two corresponding features and normalize them both, the normalized features will look more or less the same. In the picture we can see how the normalization works, here are two corresponding features and after the normalization they look the same. Stˇep´an Obdrˇz´alek,Jirı Matas. Object Recognition using Local Affine Frames on Distinguished Region

28
Feature Description - Local Frames of Reference Properties
Rotation invariant (depending on the shape) Brings different features of the same object to be similar – A great advantage! Could test similarity of features with great efficiency Properties of the descriptor – rotation invariant, since it normalize the rotation, but some features that are symmetric won’t be able to normalize then correctly. A very important advantage is that corresponding features will look the same after normalization and that why we can check only one or few pixels and check equality View point invariant
 Brings different features of the same object to be similar – A great advantage! Could test similarity of features with great efficiency. Properties of the descriptor – rotation invariant, since it normalize the rotation, but some features that are symmetric won’t be able to normalize then correctly. A very important advantage is that corresponding features will look the same after normalization and that why we can check only one or few pixels and check equality. View point invariant.")
29
Feature Description - How to normalize?
In affine transformation we have 6 degrees of freedom, that can enforce 6 constraints An example to the constraints: Rotate the object around the line from the center of gravity to the most extreme point In affine transformation we have 6 degrees of freedom so we can enforce 6 constraints in our way to normalization A small taste of how to normalize is for example how to normalize the rotation – We take the line that connect the center of gravity of the feature, which for simplicity we can refer as the center of the feature and the most extreme point and rotate according to that line. We can see example to it in the picture. Of course that not always works, if we have a symmetric feature it won’t work

30
Fast Feature Recognition
A reminder: Given a database of code words and a query feature, we find the closest code word to the feature Database Query Feature Our third issue is feature recognition. After we found all the features of our training data and the features of the query image, how do we find the features that best corresponds to our features We will see three different approach

31
Fast Feature Recognition
- Inverted File Each (visual) word is associated with a list of (images) documents containing it Small number of words – the idea is to find small number of words that best represents almost all objects. We take a large number of training image from many different categories and for each category we define a codebook and combine then all to one codebook with W words. If we want only 10 words from one category, we can use K-means which we soon explain with K=10 on that category The recognition phase is very simple, since we have only small number of words we can allow to sequentially go over them and find the nearest ones
 word is associated with a list of (images) documents containing it. Small number of words – the idea is to find small number of words that best represents almost all objects. We take a large number of training image from many different categories and for each category we define a codebook and combine then all to one codebook with W words. If we want only 10 words from one category, we can use K-means which we soon explain with K=10 on that category. The recognition phase is very simple, since we have only small number of words we can allow to sequentially go over them and find the nearest ones.")
32
Fast Feature Recognition
- Inverted File Each image in the database is scored according to how many common features it has with the query image. The image with the best score is selected Also note, that in order for the object to be recognized successfully (compete with background regions) it need to be large enough (at least ¼ of image area) Small number of words – the idea is to find small number of words that best represents almost all objects. We take a large number of training image from many different categories and for each category we define a codebook and combine then all to one codebook with W words. If we want only 10 words from one category, we can use K-means which we soon explain with K=10 on that category The recognition phase is very simple, since we have only small number of words we can allow to sequentially go over them and find the nearest ones
 it need to be large enough (at least ¼ of image area) Small number of words – the idea is to find small number of words that best represents almost all objects. We take a large number of training image from many different categories and for each category we define a codebook and combine then all to one codebook with W words. If we want only 10 words from one category, we can use K-means which we soon explain with K=10 on that category. The recognition phase is very simple, since we have only small number of words we can allow to sequentially go over them and find the nearest ones.")
33
Fast Feature Recognition
Why do we need different approaches? Why can’t we just use a table? There could be too many visual words and we want a fast solution!

34
Fast Feature Recognition
Three different approaches: A small number of words Vocabulary Tree Decision Tree

35
Fast Feature Recognition
- A small number of words Construction of the vocabulary: We take a large training set of images from many categories Then form a codebook containing W words using the K-means algorithm Recognition phase: We sequentially find the nearest neighbor of the query feature Small number of words – the idea is to find small number of words that best represents almost all objects. We take a large number of training image from many different categories and for each category we define a codebook and combine then all to one codebook with W words. If we want only 10 words from one category, we can use K-means which we soon explain with K=10 on that category The recognition phase is very simple, since we have only small number of words we can allow to sequentially go over them and find the nearest ones R Fergus, L Fei-Fei, P Perona, A Zisserman. Learning Object Categories from Google’s Image Search. ICCV 2005.

36
Fast Feature Recognition
- A small number of words Small number of words – the idea is to find small number of words that best represents almost all objects. We take a large number of training image from many different categories and for each category we define a codebook and combine then all to one codebook with W words. If we want only 10 words from one category, we can use K-means which we soon explain with K=10 on that category The recognition phase is very simple, since we have only small number of words we can allow to sequentially go over them and find the nearest ones

37
Fast Feature Recognition
- A small number of words Small number of words – the idea is to find small number of words that best represents almost all objects. We take a large number of training image from many different categories and for each category we define a codebook and combine then all to one codebook with W words. If we want only 10 words from one category, we can use K-means which we soon explain with K=10 on that category The recognition phase is very simple, since we have only small number of words we can allow to sequentially go over them and find the nearest ones

38
Fast Feature Recognition
- A small number of words Pros: Going sequentially over the words leads high accuracy Space efficiency - we save only a small number of words Cons: A small number of words doesn’t capture all the features Small number of words – the idea is to find small number of words that best represents almost all objects. We take a large number of training image from many different categories and for each category we define a codebook and combine then all to one codebook with W words. If we want only 10 words from one category, we can use K-means which we soon explain with K=10 on that category The recognition phase is very simple, since we have only small number of words we can allow to sequentially go over them and find the nearest ones

39
A small Detour - K-Mean Clustering Input
A set of n points {x1,x2,…,xn} in a d-dimensional feature space (the descriptors) Number of clusters - K Objective To find the partition of the points into K non-empty disjointed subsets So that each group consists of the descriptors closest to a particular center We decide to do a small detour and explain the K-mean algorithm since we use it twice. We are giving a set of points and we would like to divide them into k disjoint sets, that the points in each set are “close” to each other
 Number of clusters - K. Objective. To find the partition of the points into K non-empty disjointed subsets. So that each group consists of the descriptors closest to a particular center. We decide to do a small detour and explain the K-mean algorithm since we use it twice. We are giving a set of points and we would like to divide them into k disjoint sets, that the points in each set are close to each other.")
40
A small Detour - K-Mean Clustering Step 1:
Randomly choose K equal size sets and calculate their centers We start by choosing at random k equal size sets and on each set we calculate it’s center. We can see in the picture an example of division to 4 sets and in the pink sets the calculation of it’s center m1

41
A small Detour - K-Mean Clustering Step 2: For each xi:
Assign xi to the cluster with the closest center We go over the points and assign each point to set of the center which it closest We can see in the picture….

42
A small Detour - K-Mean Clustering Step 3: Repeat until “no update”
Compute the mean (mass center) for each cluster For each xi: Assign xi to the cluster with the closest center On each set compute again it center and assign each point… until no update
 for each cluster. For each xi: Assign xi to the cluster with the closest center. On each set compute again it center and assign each point… until no update.")
43
A small Detour - K-Mean Clustering The final result:
Here we can see the final result on our simple demonstration

44
Fast Feature Recognition - Vocabulary Tree
Idea: Use many visual words – capture all features But since we can’t sequentially go over a large number of words we’ll use a tree! We will represent another algorithm where the recognition phase take only log of the number of features save in the database. We save the features of the training data in a vocabulary tree. We take all the features partition them by k-means or any other algorithm and continue recursively for each group up to L levels. In the recognition phase we get query feature, check to each of the k centers it closest and take it subtree Until we reach the leaves. D Nister, H Stewenius. Scalable Recognition with a Vocabulary Tree. CVPR’

45
Fast Feature Recognition - Vocabulary Tree
Construction of the vocabulary: Input: A large set of descriptor vectors Partition the training data into K groups, where each group consists of the descriptors closest to a particular center Continue recursively for each group up to L levels Recognition phase: Traverse the tree up to the “leaves” which will hopefully contain the closest word We will represent another algorithm where the recognition phase take only log of the number of features save in the database. We save the features of the training data in a vocabulary tree. We take all the features partition them by k-means or any other algorithm and continue recursively for each group up to L levels. In the recognition phase we get query feature, check to each of the k centers it closest and take it subtree Until we reach the leaves.

46
Fast Feature Recognition - Vocabulary Tree
We will show a short demo of how the approach works. The first phase is to build the vocabulary tree. We take each image, find the features and describe them by some descriptor algorithm, here the points represents the descriptors in some dimension.

47
Fast Feature Recognition - Vocabulary Tree
All the descriptor vectors are thrown into a common space. This is done for many images, the goal being to acquire enough statistics on how natural images distribute points in the descriptor space.

48
Fast Feature Recognition
- Vocabulary Tree

49
Fast Feature Recognition
- Vocabulary Tree

50
Fast Feature Recognition
- Vocabulary Tree

51
Fast Feature Recognition
- Vocabulary Tree

53
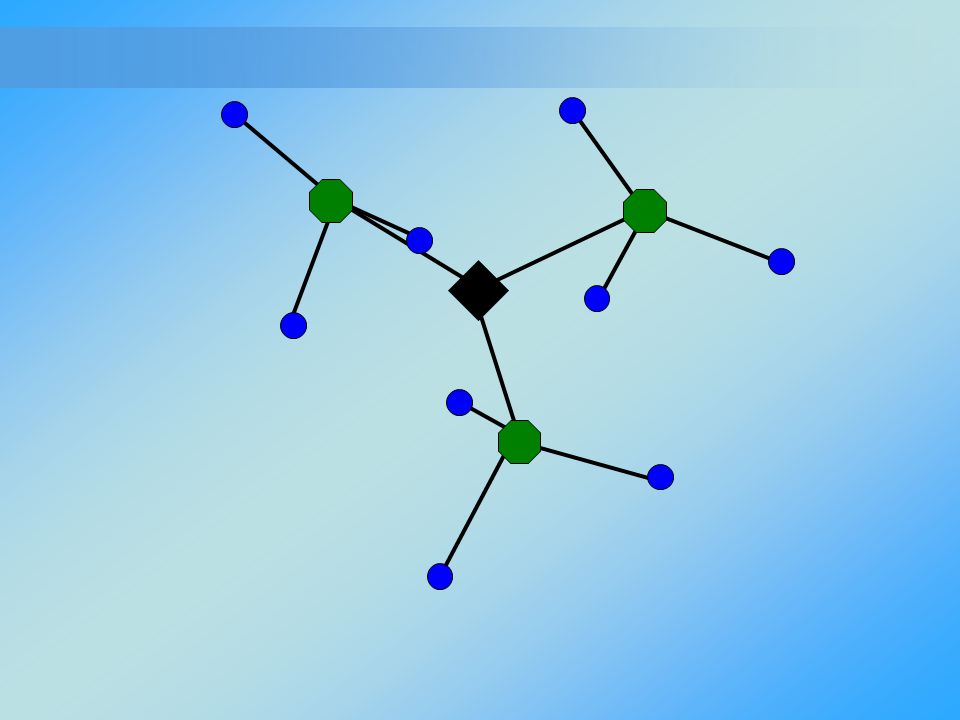
After we collected all the features we then run k-means on the descriptor space.
Here we can see that k=3 meaning we divide each group to three subsets We then run k-means again, recursively on each of the resulting group.

67
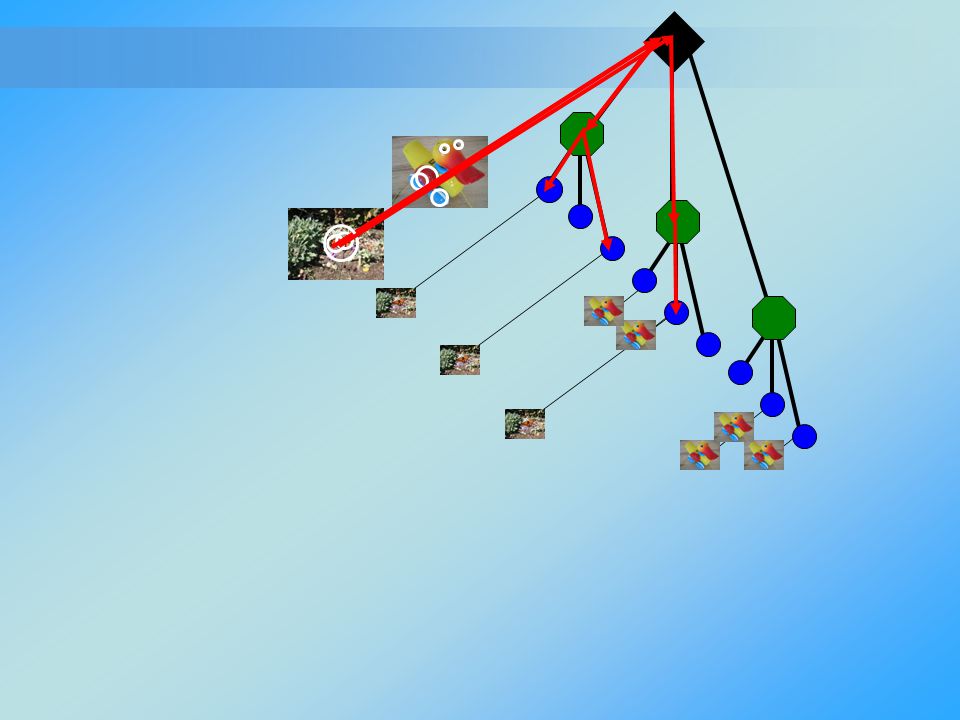
When we then wish to query on an input image, we quantize the descriptor vectors of the input image in a similar way, and accumulate scores for the images in the database with so called term frequency inverse document frequency (tf-idf). This is effectively an entropy weighting of the information. The winner is the image in the database with the most common information with the input image.

68
Fast Feature Recognition - Vocabulary Tree
Pros: We can save many visual words and thus capture more features Cons: We can’t go sequentially over all words – not perfectly accurate Space: we need to save many words Small number of words – the idea is to find small number of words that best represents almost all objects. We take a large number of training image from many different categories and for each category we define a codebook and combine then all to one codebook with W words. If we want only 10 words from one category, we can use K-means which we soon explain with K=10 on that category The recognition phase is very simple, since we have only small number of words we can allow to sequentially go over them and find the nearest ones

69
Fast Feature Recognition - Decision Tree
Idea: use a tree, but on each non terminal node make a very simple check In order to overcome accuracy problems: We can save some frames in both subtrees We need to recheck similarity when we reach to the leaves Decision tree – this is our third and last algorithm for feature recognition This algorithm is similar to the last algorithm in the case that here we also save the features in a tree. The differences are 1. The tree is binary 2. Ambiguity - The images can be saved into both subtrees 3. In each intermediate node we have a different classifier and the tree is binary. 4. Checks in the intermediate node is more efficient We assume here that we use Local Frames of Reference Descriptor which let me remind you is the descriptor where we normalize each frame and assume that corresponding frames are looks similar. So instead of using an inefficient classifier we use a simple test that check only one pixel at each time. Of course if the transformation is perfect, two corresponding features will have the same value in all the pixels. But since the transformation is not perfect each pixel can lie on small neighborhood around it, we ca define a distribution on every pixel that describe it’s probabilities o fall into. Ambiguous Binary classification S Obdrzalek, J Matas. Sub-linear indexing for large scale object recognition. Proc. British Machine Vision Conference, 2005.

70
Fast Feature Recognition - Decision Tree
Assume Local Frames of Reference Descriptor was used A very simple check in each non terminal node: we check only one pixel and compare it to some threshold The leaves are associated with a list of frames The affine transformation is not perfect: Frames close to the threshold saved in both subtrees We must recheck similarity of the frames in the leaves Decision tree – this is our third and last algorithm for feature recognition This algorithm is similar to the last algorithm in the case that here we also save the features in a tree. The differences are 1. The tree is binary 2. Ambiguity - The images can be saved into both subtrees 3. In each intermediate node we have a different classifier and the tree is binary. 4. Checks in the intermediate node is more efficient We assume here that we use Local Frames of Reference Descriptor which let me remind you is the descriptor where we normalize each frame and assume that corresponding frames are looks similar. So instead of using an inefficient classifier we use a simple test that check only one pixel at each time. Of course if the transformation is perfect, two corresponding features will have the same value in all the pixels. But since the transformation is not perfect each pixel can lie on small neighborhood around it, we ca define a distribution on every pixel that describe it’s probabilities o fall into. Ambiguous Binary classification

71
Fast Feature Recognition
- Decision Tree The tree construction: Every node gets a set of frames If the number of frames is below some threshold or indistinguishable, create a leaf Else find a weak classifier: All frames below or close to the threshold in pixel x, are added to left list All fraes above or close to the threshold in pixel x, are added to right list Continue recursively

72
Fast Feature Recognition
- Decision Tree Weak Classifier The goal: minimize the expected recall time for query. we need to find that on average we reach the leaves in minimal time Two requirements: The tree is balanced The number of ambiguous frames that are stored in both subtrees is minimized.

73
Fast Feature Recognition
- Decision Tree Recognition Phase: Traverse the tree according to the weak classifiers Check similarity to the frames in the leaf

74
Fast Feature Recognition
- Decision Tree Pros: We can save many visual words and thus capture more features A very efficient test in each non terminal node Cons: Since the normalization transformation is not perfect It won’t work on all frames Ambiguous saving We need to make another check in the leaves

75
Fast Image Recognition
Inverted Files Probabilistic approach Implementation of pLSA – Google Image Search

76
Fast Image Recognition
After recognizing the features in our query image, our aim is to recognize an image in the database or a group of images (classify) that is most similar to our query image.
 that is most similar to our query image.")
77
Inverted Files Each (visual) word is associated with a list of (images) documents containing it along with frequency and positions of (visual) words Analogous to search engines ( )
")
78
Inverted Files – cont. Results are sorted according to a complex scoring method that google calls ‘Page Ranking’

79
Inverted Files – Recognizing an Image
The list of features in our query image provides us with a list of corresponding images. The task is to rank those images according to their similarity to the query image Similarity is based on common words between query and DB image.

80
Inverted Files – Voting
Each word independently votes on the relevance of images. To improve recognition we add weights to the different words.

81
Inverted Files – Possible Scoring of Words
Frequency of word i in query image Number of Documents in Database Word i in query image Number of Documents containing word i Considers how frequent the word is in the database. The more rare the word is, the higher score it will get (because it is more discriminative). This is similar to the entropy of a word.
. This is similar to the entropy of a word.")
82
Inverted Files – Scoring of images
Query Image Database Image (Document) q and d are vectors of the frequencies of all words in an image. Similarity score between a DB image and query image Lower score is better match. Rare words, when their frequency does not match, contribute much more to the score. Need to go over all words - implementation is not obvious with inverted files
 q and d are vectors of the frequencies of all words in an image. Similarity score between a DB image and query image. Lower score is better match. Rare words, when their frequency does not match, contribute much more to the score. Need to go over all words - implementation is not obvious with inverted files.")
83
Inverted Files – Scoring – Fast
Vectors are normalized Score is a function of common words only. Scoring is now straightforward with inverted files

84
Inverted Files – Scoring – Implications
This part can be done fast Allows scaling of database without linear growth in search time because common features are rare (with a big vocabulary) for non-matching images. Score is [0,2] with 0 the best match, 2 for images with no common features.
 for non-matching images. Score is [0,2] with 0 the best match, 2 for images with no common features.")
85
Experiment – Effect of Vocabulary Size
1400 image database (small) Inverted Files Detector – MSER “Maximally Stable Extremel Regions” Descriptor – SIFT Hierarchical k-means clustering David Nister & Henrik Stewenius 2006
 Inverted Files. Detector – MSER Maximally Stable Extremel Regions Descriptor – SIFT. Hierarchical k-means clustering. David Nister & Henrik Stewenius")
86
Experiment – Effect of Vocabulary Size
Best parameters: 1 million words, 6 levels tree L1 Normalization Scheme 90% success on first hit Non-Hierarchical: 10,000 words, one level Much slower (linear) Only 86% correct on first hit Good performance requires large vocabulary! David Nister & Henrik Stewenius 2006
 Only 86% correct on first hit. Good performance requires large vocabulary! David Nister & Henrik Stewenius")
87
Experiment – Scalability
Performance scales well with database size Losing <5% hit rate while expanding the database 100-fold (green curve is more realistic scenario) David Nister & Henrik Stewenius 2006
 David Nister & Henrik Stewenius")
88
Demonstration – Robustness
CD Cover is photographed using a digital camera. Severe occlusions, specularities. Viewpoint, Rotation and Scale are different. CD Cover is identified in real-time from a database of 50,000 images. David Nister & Henrik Stewenius 2006

89
Summary Big vocabulary can be used effectively and quickly for high performance image identification. Using inverted files, database can be scaled relatively easy. ‘Bag of Words’ model allows for identification under noisy conditions. David Nister & Henrik Stewenius 2006

90
Bag of Words – Drawbacks
Positional information is not taken into account. These two images have the same frequency of words. Is this the best we can do? In fact, in real life, the interaction between the features is important.

91
Probabilistic approach – TSI-pLSA
Translation and Scale Invariant pLSA We’ll try to guess a window surrounding our object. We’ll use the position, as well as the frequency, of a word, to identify the object. We’ll do all of this in an unsupervised manner. First, what is pLSA? R. Fergus et al. 2005

92
Probabilistic approach – pLSA
Probabilistic, Unsupervised approach to object classification. Probabilistic – Instead of identifying a single topic in the image we view an image as a collection of topics in different proportions. e.g. 50% motorbike, 50% house. Unsupervised – Topics are not defined in advance, rather they are learned from the database. R. Fergus et al. 2005

93
Probabilistic approach – Image is made of Topics
W = 6

94
Probabilistic approach – Image is made of Topics
Z = 2 Car Horse 1 ⅔ D = 7 Car Horse Z = 2 W = 6

95
Probabilistic approach – The model – pLSA
Distribution of words in documents is associated by a single variable z that represents the topic. Assumption is that distribution of words is independent of specific document – function of topic in document.

96
Probabilistic approach – Topics and Words
Each topic (z) is characterized by its own frequencies of visual words Each image (d) contains a mixture of topics,
 is characterized by its own frequencies of visual words. Each image (d) contains a mixture of topics,")
97
Probabilistic approach – Learning
In Learning we compute the best values for EM is used to maximize the likelihood of the model over the data.

98
Probabilistic approach – Learning
In Learning we compute the best values for EM is used to maximize the likelihood of the model over the data. Likelihood of data Computed from the model

99
Probabilistic approach – Topics
Note that learning is unsupervised. Topics can be thought of as a group of features that tend to appear together in an image. Only the number of topics is provided in advance. Topic 1 2 3 4 5 6 7 8 Results of 8-topic learning with images of motorbikes

100
Probabilistic approach – Topics – Example
The parts of a motorbike tend to appear together in an image and therefore, most likely, will be grouped under one topic. Images sorted by their prominent topic show under Topic 7, the most images of motorbikes We’ll name Topic 7 ‘Motorbikes’ – our classifier. Topic 1 2 3 4 5 6 7 8

101
Probabilistic approach – Recognition
In recognition, is locked after learning phase. Using EM, is guessed.

102
Probabilistic approach – Recognition – Example
1 2 3 4 5 Topic In recognition, we identify the most likely distribution of topics. If topic 4 was our classifier for faces we’d classify this image as ‘Face’

103
Probabilistic approach – Choosing Topics
Number of topics is chosen in advance as a parameter. It is not related to the actual number of object classes in the data. We still need to pick the topic that best describes our object class. One option is to pick by hand the best topic.

104
Probabilistic approach – Validation set
Or we can use a validation set - a few high quality images, and automatically pick the single best classifier for this validation set. In the future, a combination of topics could be used to give superior classification.

105
pLSA - Summary Word frequency is a function of Topics in image. Topics are learned and recognized using EM Positional information is still not taken into account.

106
Probabilistic approach – TSI-pLSA
We’ll guess a window surrounding our object. We’ll use the position of a word, relative to the object, in the model.

107
Probabilistic approach – Object Boundaries
c describes the boundaries of an object. P(c) is Calculated by fitting a mixture of Gaussians to the features. Center of the object is given as the mean of the Gaussian. Scale is given by the variance. Features are weighted by P(w|z) for a given topic This is repeated with k=1,2,….K for all possible bounding boxes. Image of two planes Fitting a ‘Mixture of Gaussians’ with k=2 to the features, weighted by their color, would give the two centers of the planes.
 is Calculated by fitting a mixture of Gaussians to the features. Center of the object is given as the mean of the Gaussian. Scale is given by the variance. Features are weighted by P(w|z) for a given topic. This is repeated with k=1,2,….K for all possible bounding boxes. Image of two planes. Fitting a ‘Mixture of Gaussians’ with k=2 to the features, weighted by their color, would give the two centers of the planes.")
108
Probabilistic approach – Word Position
x describes the position of a word in relation to the object. Locations are quantized to 36 internal positions and one background position.

109
Probabilistic approach – Word Position
Word positions (x) are used in the model
 are used in the model.")
110
Probabilistic approach – Robustness
Hopefully, recognizing object centroids should allow TSI-pLSA to be scale invariant while preserving its translation-invariance.

111
Probabilistic approach – Results
Z = 2 (Number of topics) K = 2 (maximum # of Gaussians) Airplanes R Fergus et al. 2005
 K = 2 (maximum # of Gaussians) Airplanes. R Fergus et al")
112
Probabilistic approach – Centroid selection
Red is first topics. It was found to correspond to airplanes Green is second topic. Bounding boxes are suggested centroids. Solid rectangles are centroids with highest likelihood.

113
Probabilistic approach – TSI-pLSA – cont.
In learning, the results of moving the sub-window over all possible locations, c, are aggregated. In addition, P(c) is a flat distribution since there is no more confidence in a single position over the other.
 is a flat distribution since there is no more confidence in a single position over the other.")
114
Probabilistic approach – Parameters
Need to specify number of topics – no theory on optimal number Many parameters for the model, example: 350 visual words 37 discreet positions (6x6 grid + background position) 8 topics (irrespectable of the way we divide the dataset) 350x37x8 = 103,900 parameters to learn Need to provide many data points: 500 images 700 features in each image Only 350,000 data points. That is only ~3 datapoints/parameter.
 8 topics (irrespectable of the way we divide the dataset) 350x37x8 = 103,900 parameters to learn. Need to provide many data points: 500 images. 700 features in each image. Only 350,000 data points. That is only ~3 datapoints/parameter.")
115
Probabilistic approach – Summary
Number of topics needs to be specified in advance. Images do not have to be annotated individually. Group of images should contain a few object classes. Otherwise topics would be meaningless.

116
How does that help us??? Usefulness?
So, we could use a database of airplanes and faces but we do not need to know which is which. How does that help us??? TSI-pLSA can be used to improve on google image search.

117
Google image search Returns many thousands of images.
Currently, many are low quality (bad viewpoint, small objects, junk)
")
118
Google image search – Quality images
This is for the entire set of images returned for each keyword Green is good images Intermediate means some relevance (like a cartoon) Bad means junk image, unrelated.
 Bad means junk image, unrelated.")
119
Google image search – Validation set
Needs a set of images to serve as the ground truth to identify the best topics. Could choose some 20 images by hand. Empirically, the top 5 images returned by google search are usually good quality. Could use Google Translate to obtain the top 5 images in every language. For example, 30 images of airplanes in 6 languages

120
Google image search + Probabilistic Approach – Results (TSI-pLSA)
7 Keywords (datasets): ~600 images/keyword Validation set: ~30 images/keyword Z=8 (Number of topics) A single topic was chosen as classifier from the 8 topics for each keyword using the validation set. Descriptor – SIFT Vocabulary – 350 words. R. Fergus et al. 2005
: ~600 images/keyword. Validation set: ~30 images/keyword. Z=8 (Number of topics) A single topic was chosen as classifier from the 8 topics for each keyword using the validation set. Descriptor – SIFT. Vocabulary – 350 words. R. Fergus et al")
121
Results – cont. Tested on pre-annotated set. (by hand) Each labeled image had to be classified according to the pre-determined classifier for each category Notable problems were (A)irplanes, half of them classified as (C)ars Rear. Both (F)aces and (W)ristwatches classified as (G)uitars
irplanes, half of them classified as (C)ars Rear. Both (F)aces and (W)ristwatches classified as (G)uitars.")
122
Google image search – Improving
Used TSI-pLSA to reorder the images returned by google according to the chosen topic. Graph shows how many of 15% top hits are relevant Note that since this method is completely unsupervised it could be used immediately to improve the search results of google image search, although at a high computational cost.

123
Google image search – Automatic Classification
Give a keyword. Use google image search to find images somewhat related. Use TSI-pLSA to classify the images by topics. Use validation set to choose best topic. Classify any image in the world.

124
Summary Probabilistic method uses results returned from image search engine, despite being extremely noisy, to construct automatically classifier for objects. This classifier uses frequency and position of visual words to identify the most likely topic of the object in the image. This topic can be further used to improve the relevance of such an image search. Positional data not always helpful (results not shown). In some cases using only the frequencies of the words gives better performance.
. In some cases using only the frequencies of the words gives better performance.")
125
References R Fergus, L Fei-Fei, P Perona, A Zisserman. Learning Object Categories from Google’s Image Search. ICCV 2005. D Nister, H Stewenius. Scalable Recognition with a Vocabulary Tree. CVPR’ J Sivic, A Zisserman. Video Google: a text retrieval approach to object matching in videos. Computer Vision, 2003. S Obdrzalek, J Matas. Sub-linear indexing for large scale object recognition. Proc. British Machine Vision Conference, 2005. Li Fei-Fei, Rob Fergus, Antonio Torralba. Recognizing and Learning Object Categories. ICCV 2005 short courses.

Similar presentations