Download presentation
Presentation is loading. Please wait.

1
Carla Neiman Chief Financial Officer Clark Fork Valley Hospital
Hospital Finance 101 The Finance Quality Connection Introduction to Hospital Finance & Reporting Getting Comfortable with the numbers Carla Neiman Chief Financial Officer Clark Fork Valley Hospital

2
What is your F Quotient?

3
Discussion Topics Why Finance? Basic Hospital Finance & Reporting
How the goals of financial performance and quality care are related & integrated Basic Hospital Finance & Reporting How to understand and use your hospital’s financial information Current Trends in Healthcare Finance & Reimbursement Affordable Care Act and coming payment reforms

4
Why Finance? Margin vs. Mission
One of the most important characteristics of ANY business is its financial performance & condition

5
Financial Analysis evaluates a business’s financial performance & condition
Does it have the financial capacity to fulfill its mission? By assessing the financial health of our hospital we can identify strengths & weaknesses The principal of Stewardship

6
The Quality Connection
The financial impact of quality on your hospital Cost of new technology and the evolving “standard of care” Adverse events Lawsuits, insurance claims and insurance cost Community image – consumer assessment Payer impact – Never Events, credentialing & payment reform Survey agencies Publicly reported quality data

7
The evolving relationship between quality and cost in health care
The “Cost of Quality” “…costs and quality of care cannot be separated from each other. Higher quality often requires increased expenditures. When this occurs, decision makers must reconcile the desire for higher quality with the desire for cost control.” –Kovener & Neuhauser, 1990

8
The evolving relationship between quality and cost in health care
The “Cost of Poor Quality” Process improvement & resulting reduction in cost, LEAN, Six Sigma “Although health care differs in many ways from manufacturing, there are also surprising similarities: Whether building a car or providing health care for a patient, workers must rely on multiple, complex processes to accomplish their tasks and provide value to the customer or patient. Waste – of money, time, supplies or good will – decreases value…” --Institute for Healthcare Improvement (2005)
")
9
The Quality Connection
High Cost does not mean High Quality “Despite having the most costly health system in the world, the United States consistently underperforms on most dimensions of performance compared with other industrialized countries…” –Karen Davis, President, Commonwealth Fund

10
Introduction to Hospital Finance & Reporting
How the hospital gets and spends its money

11
Financial Statements Audited vs. Interim
Statement of Operations (Income Statement) Statement of Financial Position (Balance Sheet) Statement of Cash Flows
 Statement of Financial Position (Balance Sheet) Statement of Cash Flows.")
12
Other Financial Reports
Statistical Reports Accounts Receivable Status Labor Productivity Report

13
Statistical Reporting
Hospital revenues tend to be volume driven and revenues are well demonstrated with statistics Statistical reports should compare actual statistics to budget for current period and year-to-date One should see a reasonable correlation between variances in statistics and corresponding categories of revenue

14
Typical Statistics to Review
Average Daily Census (by unit, by category) Patient days Outpatient Visits Surgery minutes Case mix index Emergency Room visits Clinic visits Revenue per day and per visit
 Patient days. Outpatient Visits. Surgery minutes. Case mix index. Emergency Room visits. Clinic visits. Revenue per day and per visit.")
15
Statistical Report example
Description Actual Budget Variance Avg YTD Hospital ADC 4.2 4.7 (.5) 3.9 Surgery Minutes 3709 2778 931 2636 Outpatient Visits 1370 1483 (113) 1388
 3.9. Surgery Minutes Outpatient Visits (113)")
16
Dashboard Report

17
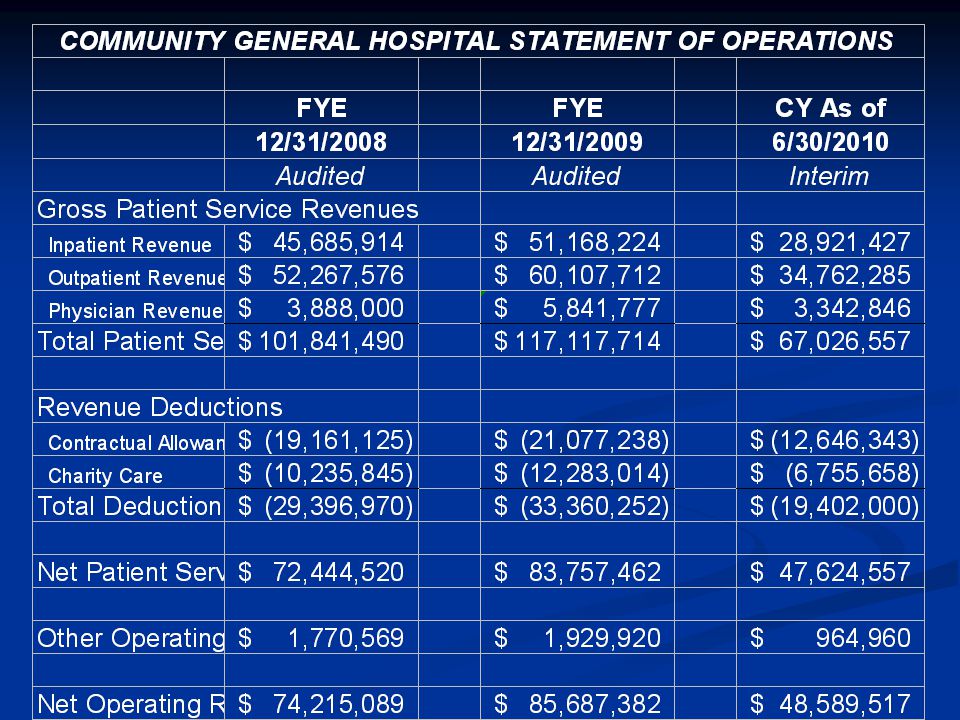
The Statement of Operations
Also called the “Income Statement” – this report outlines actual revenues and expenses, as compared to budget, and is the most important gauge of the positive or negative results of the hospital’s operations for the period.

18
Hospital Revenues Operating Revenue Other Operating Revenue
Directly related to operations Volume driven Other Operating Revenue Indirectly related to operations Non-Operating Revenue Not related to operations

20
Operating Revenues Routine – Inpatient Room & Bed Charges
Ancillary – Inpatient & Outpatient Lab, Imaging, Pharmacy, Therapy, Supplies, ER, Surgery, Home Health Clinic

21
Deductions from Revenue “No one pays full price…”
Contractual Discounts/Allowances Charity Care Policy Discounts – Employee discounts, Administrative Discounts Monthly Allowance Estimates

22
Net Patient Service Revenue
This is the difference between Gross Charges and Contractual Allowances This is the NET amount of revenue we expect to collect after discounts to patients and public/private payers

23
Hospital Service Revenue & Margin
Lab Test A Charge/Price = $25.00 Payment (varies w/payer) Medicare = $18.00 Cost = $13.00 Charge – Payment = Contractual Adjustment Payment – Cost = Contribution Margin
 Medicare = $ Cost = $ Charge – Payment = Contractual Adjustment. Payment – Cost = Contribution Margin.")
24
Payer Types & Payment Methodology – Hospital
Medicare and Medicaid Hospital CAH Cost Based Non-CAH Prospective Payment (DRG & APC) Commercial Insurance – Fee for service and discounts from charges, DRG or case payments, capitation Private Pay – Prompt pay discounts, charity care, bad debt expense Medicare Swingbed – Per Diem based on Cost per Day
 Commercial Insurance – Fee for service and discounts from charges, DRG or case payments, capitation. Private Pay – Prompt pay discounts, charity care, bad debt expense. Medicare Swingbed – Per Diem based on Cost per Day.")
25
Payer Methodology Other Services
Medicare DME, Lab, Mammo – Fee Schedule Medicare Home Health – Episode Based Medicaid Nursing Home – Per Diem based on Facility Rate set by the state Medicare Nursing Home – Prospective payment based on RUG coding Medicare Rural Health Clinic – Payment per cost Physician – RBRVS based on rate per RVU

26
Evolution of Payment Methodology
Incentives! DRG’s 1983 APC’s 2000 Home Health Episodes 2000 Future… Value-based Purchasing; Accountable Care Organizations; Payment for outcomes vs. fee for service

27
Hospital Service Mix

28
Outpatient Service Mix

29
Revenue Payer Mix

30
Other Operating Revenue
Cafeteria Revenue Medical Records Revenue Rental Revenue Outreach Revenue

31
Non-Operating Revenue
Interest Gains and Losses on Fixed Assets and Joint Ventures Grants & Charitable Donations

32
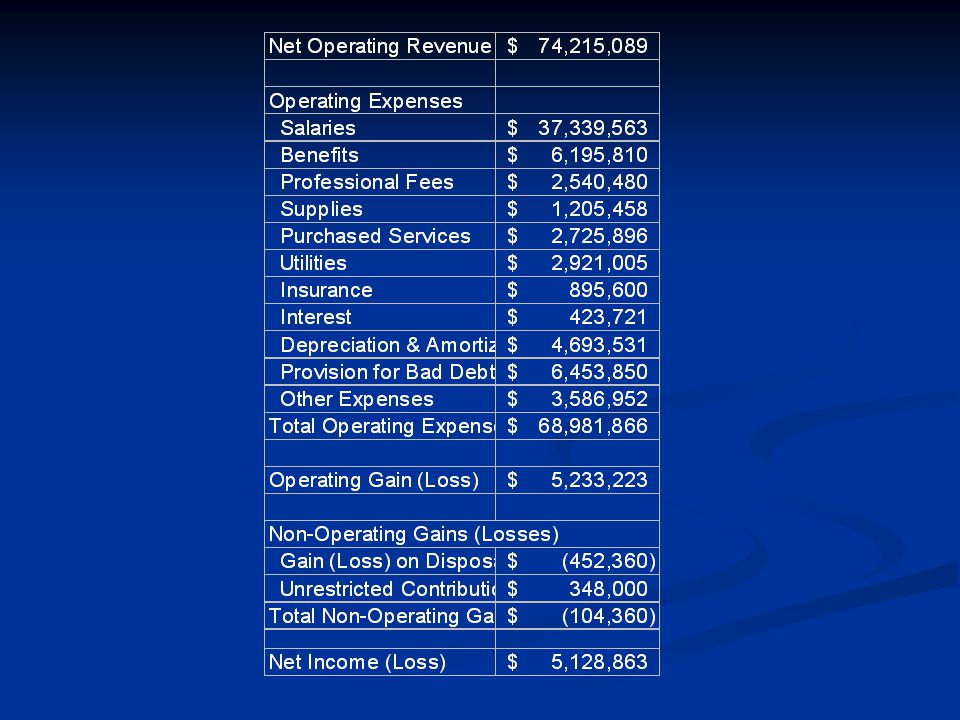
Operating Expenses Staffing – Salaries, Benefits, Professional Fees
Supplies & Other – Medical and Non-Medical Supplies, Purchased Services, Insurance, Utilities, Repair & Maintenance, Lease & Rental Depreciation Interest Bad Debt Other Expense – Postage, Travel, Dues & Subs, Taxes

34
Operating Expenses

35
The Balance Sheet The Statement of Financial Position or Balance Sheet is a snapshot of the financial position of the organization at a specific point in time. It can tell us a lot about the financial health of the business.

36
Assets Short Term Long Term Cash and Investments
Accounts Receivable – gross vs. net Other Receivables – Third Party Payers, Non-patient receivables Inventory Prepaid Expenses Long Term Property Plant & Equipment – at cost less accumulated depreciation Other Assets – Restricted assets, Joint Ventures, Intangibles, such as good will

37
Liabilities Short Term Long Term Accounts Payable Accrued Compensation
Other Accrued Expenses Line of Credit Current Portion of Long Term Debt Long Term Mortgage & other Long Term Debt Payable Capital Leases

38
Net Assets or Fund Balance
This is the equivalent of “equity” in a non-profit Unrestricted Fund Balance Restricted Fund Balance Current Year’s Operations Balance, if interim

39
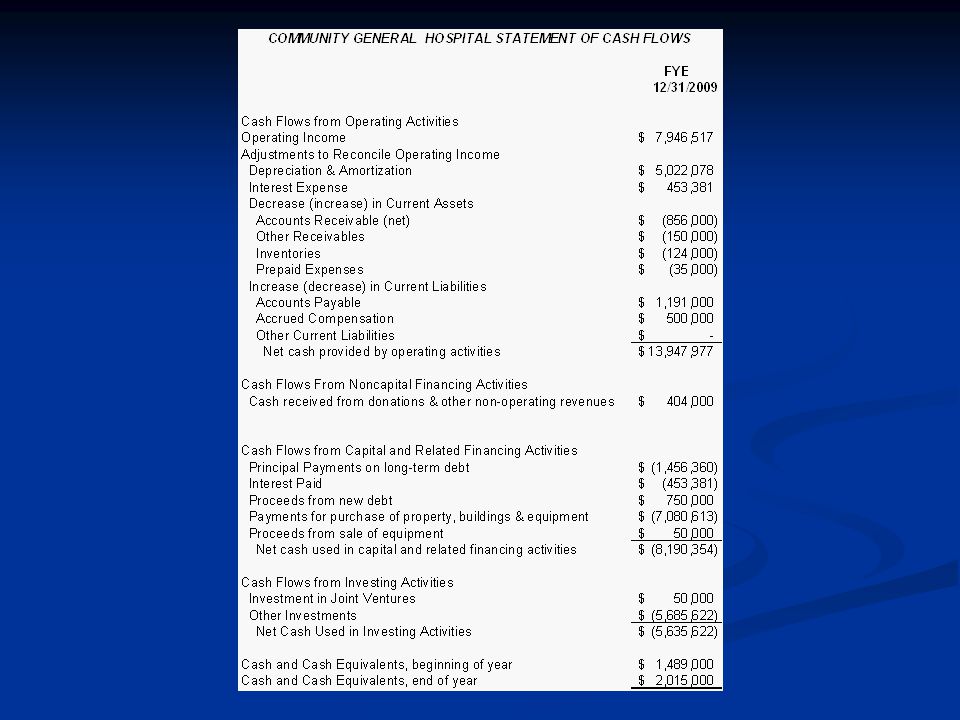
CASH – What really keeps the hospital ticking!

40
The importance of monitoring cash flows
While Revenues and Expenses offer an excellent assessment of the financial outcome of operations, the bottom line is not directly indicative of real-time financial performance, since most revenues are not collected at the time of service, most expenses are not paid when incurred and non-cash expenses, while important, do not have a direct impact on our financial resources

41
The Revenue Cycle

42
Sources of Cash Collection of Accounts Receivable Cash Services
Investment Income Sale of Assets Financings Unrestricted Donations Capital Contributions

43
Applications of Cash Payments to Employees of Accrued Compensation
Payments to Suppliers of Accounts Payable Payments to Lenders for Principal and Interest Purchase of Fixed Assets Investments

44
Statement of Changes in Cash
Net Income (Loss) Results of Operations Add back Non-Cash Expenses (Depreciation, Amortization) Identifies sources & uses of cash during the accounting period to explain the change in the cash balance
 Results of Operations. Add back Non-Cash Expenses (Depreciation, Amortization) Identifies sources & uses of cash during the accounting period to explain the change in the cash balance.")
46
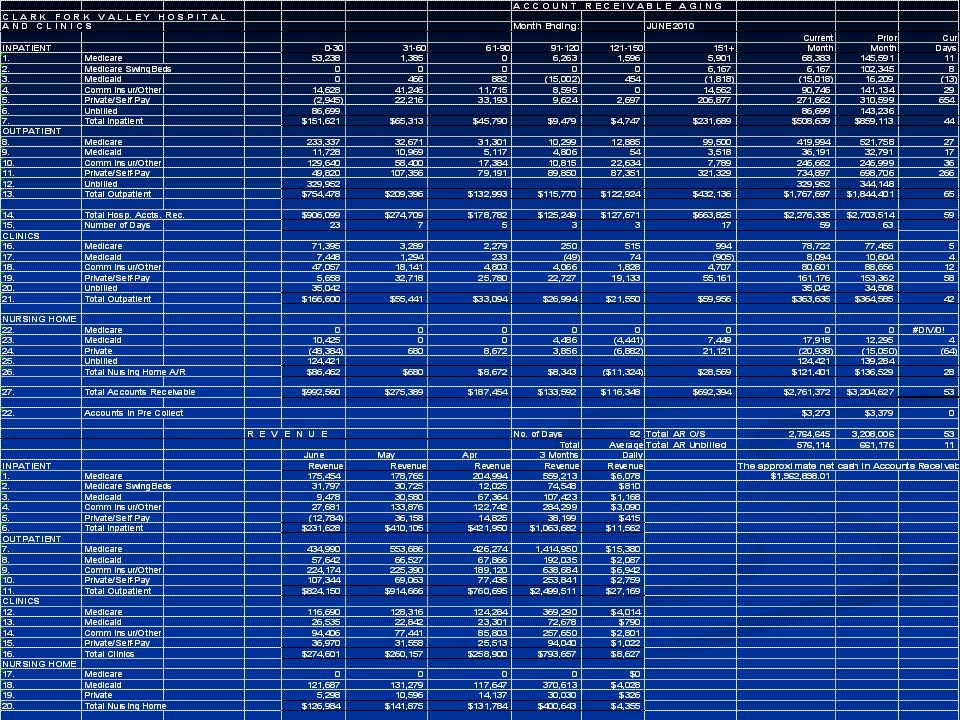
Accounts Receivable Analysis
Increased Accounts Receivable is a drain on cash flow Optimizing the “Revenue Cycle” means capturing charges, generating bills and collecting from payers as quickly as possible, so that the resulting cash can be used to fund operations Accounts cannot be collected until they are billed

47
Accounts Receivable Analysis Report
Breakdown by Patient Type (Inpatient, Outpatient, SNF) with prior month comp Breakdown by Payer Type (Medicare, Medicaid, Commercial, Self Pay) with prior month comparison Aging of Accounts Receivable Unbilled Accounts Receivable Gross Days A/R Outstanding w/ prior month comparison Revenue and Revenue Day Equivalent
 with prior month comp. Breakdown by Payer Type (Medicare, Medicaid, Commercial, Self Pay) with prior month comparison. Aging of Accounts Receivable. Unbilled Accounts Receivable. Gross Days A/R Outstanding w/ prior month comparison. Revenue and Revenue Day Equivalent.")
48
Days Revenue in Accounts Receivable Outstanding
Total Accounts Receivable / Average Revenue per day This is a measure of how many days it takes to collect patient accounts, on average This will vary by payer and type of service Medicare will pay a clean bill in 14 days Private Pay nursing home accounts are generally paid in advance Self pay bills may take several months to a year (or more) to be paid off
 to be paid off.")
50
Questions to ask about Accounts Receivable Performance
How many days unbilled? What action have we taken to manage/optimize our revenue cycle? Monitor physician chart completion Monitor transcription and coding turnaround Electronic billing Ensure clean claims Collection practices

51
Labor Productivity Analysis
Helps to analyze and justify variances in labor cost by relating labor cost to service volume or other relevant statistics Overtime Hours by department Non-Productive Hours (PTO, Vacation, Sick Leave) “Target” is actual units of service x budgeted hours per unit Efficiency measures actual hours per unit of service to budget Productive % measures worked hours compared to total paid hours
 Target is actual units of service x budgeted hours per unit. Efficiency measures actual hours per unit of service to budget. Productive % measures worked hours compared to total paid hours.")
53
How are we doing? How are we tracking against our budget?
Ratio Analysis
![]()
54
Ratio Analysis Ratio analysis is a technique used in both financial statement and operating indicator analyses It combines values from the financial statements (and elsewhere) to create single numbers that Have easily interpretable financial significance Facilitate comparisons
 to create single numbers that. Have easily interpretable financial significance. Facilitate comparisons.")
55
Using Ratios A single ratio value has little meaning
One point in time may not be representative We can’t judge whether it is good or bad Two techniques are commonly used Trend – Time series analysis Comparative – Cross Sectional analysis with comparisons to industry benchmarks and peers

56
Ratios help to identify
Questions to ask Issues to address Problems to solve They do not necessarily provide Answers Explanations Solutions *That’s the job of management!

57
Profitability Indicators
Measure the ability to generate the financial return required to replace assets, meet financial obligations, meet increases in service demands, and compensate investors (or in the case of a nonprofit, build reserves for stability & growth Total margin, cash flow margin, return on equity, operating margin, debt service coverage

58
Liquidity Indicators Measure the ability to meet cash obligations in a timely manner Current ratio, Days cash on hand, Days Revenue in Accounts Receivable, Days in Accounts Payable

59
Capital Structure Indicators
Measure the extent of debt and equity financing Equity financing, debt service coverage, long-term debt to capitalization

60
Sources of Comparative Information
Finding a suitable comparison – Peer groups, similar facilities (type, size, service mix, location) Moody’s and other Debt Rating Agencies Healthcare Financial Management Association MHA Databank National CAH Flex Team Benchmarking
 Moody’s and other Debt Rating Agencies. Healthcare Financial Management Association. MHA Databank. National CAH Flex Team Benchmarking.")
61
Flex Monitoring Team CAH Financial Indicators Report
61

62
Beyond the numbers… Understand your Hospital’s Operating environment and its impact on the financial picture External environment – economic, regulatory, human resource, payers, competition, investment performance, donor support Internal environment – management control, staff vacancies, case mix, payer mix, physician practice patterns

63
Environmental Analysis (cont)
Retrospective How do environmental factors help to explain past financial performance? Proactive Anticipating change in the environment and its associated impact on future performance Taking action to minimize negative influences and maximize opportunities presented by positive change Planning!

64
The Budget A budget is an operating plan expressed in dollar amounts that acts as a road map to carry out an organization’s objectives, strategies and assumptions. Translating operating plans and assumptions into their expected financial results ensures those plans and assumptions are financially realistic

65
Budget Process Based on the Strategic Plan
Allows adequate time for staff and board input, review and approval Has some basis in current year’s results Provides for department level involvement and accountability

66
Current Trends in Healthcare Finance & Reimbursement
The “unsustainable” cost curve Spending on Healthcare as a Percentage of GDP, 1966 – 2005 Source: Congressional Budget Office (2007)
")
67
Current Trends in Healthcare Finance & Reimbursement
Projected Spending on Health Care as a Percentage of GDP, Source: Congressional Budget Office (2007)
")
68
Current Trends in Healthcare Finance & Reimbursement
Sources of Projected Growth in Spending on Medicare & Medicaid Source: Congressional Budget Office (2007)
")
69
Current Trends in Healthcare Finance & Reimbursement
A growing emphasis on “VALUE” “Value is defined as the relationship of quality to cost. High quality at inappropriately high cost does not produce value. Likewise, low quality at low cost also does not produce value. Relentlessly driving toward both high quality and low cost is what produces value. Given our current environment, it is critical for healthcare organizations to make achieving value a key strategy.” --Dick Clarke, HFMA President (2009)
")
70
Current Trends in Healthcare Finance & Reimbursement
Consumer Driven Health Care Empowered consumers Widespread availability of information Third party payer scrutiny – RAC Audits Never Events

72
From the OIG Adverse Events Report
Studied representative sample data in one month of 2008 to extrapolate annual estimates 1 in 7 Medicare beneficiaries admitted to a hospital is harmed Adverse events add $4.4 Billion to government health care cost annually and contribute to the deaths of 180,000 patients each year Most adverse events are preventable

73
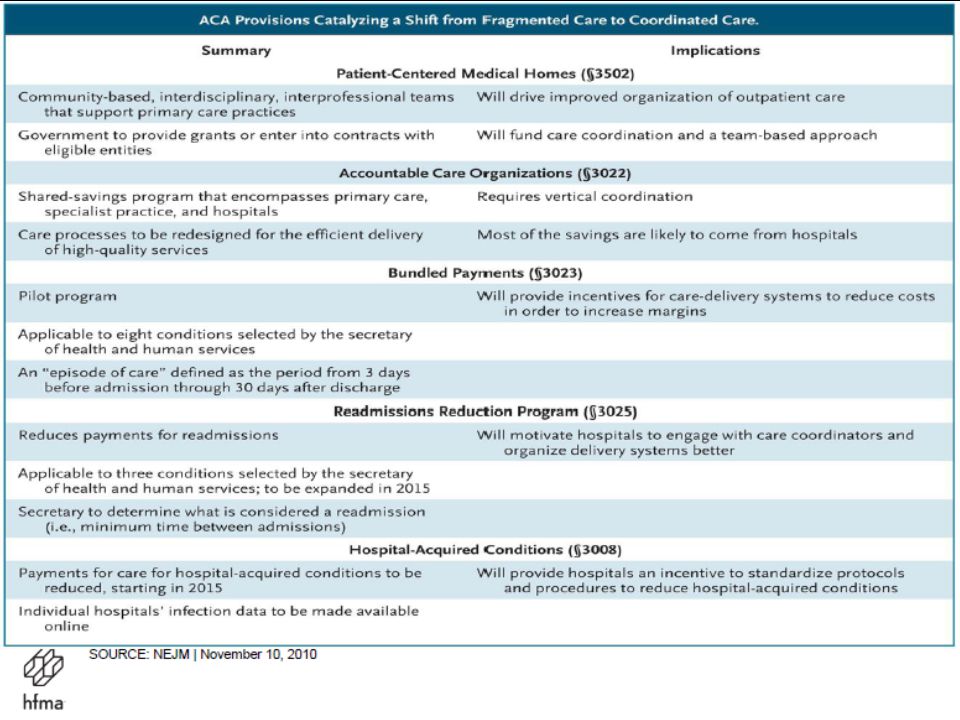
Patient Protection & Affordable Care Act (PPACA)
Healthcare Reform using “Healthcare Payment Reform” as incentives Intended to drive a shift from “fragmented care” to “coordinated care”

76
Trends in Healthcare Finance & Reimbursement
Payment for Outcomes vs. Services “You may regard as a Utopian dream my hope to see all our hospitals devoting a reasonable portion of their funds to tracing the results of the treatment of their patients and analyzing these results with a view to improving them. You may prefer to ponder over the voluminous discussions now appearing in our journals and in the lay press about the pros and cons for state medicine and who is to pay the cost of medical care. I read these discussions, but they seem to be futile, until our hospitals begin to trace their results.” --E. A. Codman, 1935

77
Trends in Healthcare Finance & Reimbursement
Reduced ability to “cost shift” With health care reform, more people will have coverage under government programs which traditionally do not cover the full cost of care, due to the expansion of coverage and the aging of the population Coverage expansion & access to services Shortage of primary care providers Adequate supply of facilities & services

78
“Changing Economics in an Era of Healthcare Reform”
“As health systems prepare for healthcare reform, they are focusing significant resources on developing accountable care organizations and medical homes and on preparing for bundled payments and population-based reimbursement. However, current economic trends combined with an analysis of the impact of key healthcare reform initiatives will require health systems to take significant cost out of their systems to maintain positive financial performance. Few organizations have the culture or the expertise to implement a cost-reduction effort of this magnitude.” --Nathan S. Kaufman, Managing Director, Kaufman Strategic Advisors, LLC (Journal of Healthcare Management, January/February, 2011)
")
79
Questions?

80
Helpful Resources A Community Leader’s Guide to Hospital Finance
Guidestar: Data on non-profits including IRS F990 info Montana Attorney General Report on Montana’s Hospitals and Charitable Purpose

81
More Resources Databank: Financial data repository for all hospitals across the state of Montana; ability to print comparative reports for your hospital to various peer groups, all hospitals in the state, and selected hospitals Flex Monitoring Team: Comparative financial data on CAH hospitals with trending *Hospital specific reports for CAH accessible by CEO & CFO *Educational resources – how to read the reports and interpret ratios & comparative data Rural Assistance Center: Various resources, publications and funding information related to rural health

82
More Resources Information on healthcare reform & finance
Healthcare Costs & Spending Adverse Events in Hospitals

83
Contact Me Carla Neiman, CFO Clark Fork Valley Hospital P. O. Box 768
Plains, MT (406)
")
Similar presentations