Download presentation
Presentation is loading. Please wait.

1
Any CHC - Sample Multi-year TREND REPORT Access and Financial Measures Budget Access to Primary Care

2
Number of Patients/Users - PM#1 Measures Access to Health Care The number of patients utilizing services is a significant indicator of a health center’s effort to meet the health care needs of its community, as well as an important indicator of the health center’s market penetration.

3
Any CHC Number of Unduplicated Patients

4
Any CHC Patients - Gender Breakdown

5
Any CHC Patients - Age Breakdown

6
Any CHC Patients - Ethnicity Breakdown

7
Any CHC Patients - Medical Service

8
Any CHC Patients - Other Service Types

9
Average Number of Visits Per User Measures Practice Quality, Comprehensive Care, and Acuity Calculation: Total Provider Medical Encounters (physicians and mid-levels only) - divided by - Total Medical Users (Patients) The Measure is Calculated in the Same Manner for Each Type of Service Provided by a Health Center
 - divided by - Total Medical Users (Patients) The Measure is Calculated in the Same Manner for Each Type of Service Provided by a Health Center")
10
Any CHC - Average Number of Visits Per User

11
Any CHC - Patient Mix by Payer Type

13
Any CHC Patient Income Level

14
Any CHC - Number of Patients Contributing Factors: CF1: CF2: CF3: CF4: CF5: CF6:

15
Restricting Factors: RF1: RF2: RF3: RF4: RF5: RF6: Any CHC - Number of Patients

16
Performance Improvement Options: PIO1 PIO2 PIO3 PIO4 PIO5 Any CHC - Number of Patients Next Steps

17
Current Ratio Measures Financial Liquidity Minimum of 1.0 - with 2.0 preferred Calculation: Current Assets / Current Liabilities Source: Month End and Year End Balance Sheet - One of the Routine Financial Statements. The Balance Sheet is a snapshot of the financial position of the organization at the point in time (date) of the Financial Statement. All activities of the health center (What people do) impacts the Current Ratio: Increased Encounters = Increased Revenue = Improved Profitability = Increase in the Current Ratio
 of the Financial Statement. All activities of the health center (What people do) impacts the Current Ratio: Increased Encounters = Increased Revenue = Improved Profitability = Increase in the Current Ratio.")
18
Current Assets Cash or Readily Converted to Cash Cash Net Patient Services Accounts Receivable Grants and Contracts Receivable Prepaid Expenses (rent, insurance, etc.)
")
19
Current Liabilities Expenses /Obligations Due in One Year Time Accounts Payable Accrued Expenses (payroll taxes/withholdings, uncompensated absences, etc.) Capital Leases - Current Portion Lines of Credit Notes/Mortgage Payable - Current Portion
 Capital Leases - Current Portion Lines of Credit Notes/Mortgage Payable - Current Portion")
20
Any CHC Current Ratio

21
Any CHC Balance Sheet Data

22
Total Net Assets Net Worth Calculation: Total Assets (Audited Balance Sheet) - Minus - Total Liabilities (Audited Balance Sheet) The difference between what the organization owns minus the debts the organization owes. Negative Net Assets is an indication of severe financial weakness and raises the question of financial viability.

23
Any CHC - Total Net Assets

24
Debt Management Ratio Measures the Debt Load - Percent of Debt to Total Assets Calculation: Total Liabilities (Audited Balance Sheet) - Divided by - Total Assets (Audited Balance Sheet) The target is a Debt Management Ratio below 0.50 (or less than 50% of Total Assets tied up in Debt). A Debt Management Ratio in excess of 1.0 is an indication of excessive debt load and is an indicator that the organization’s financial viability is in question.

25
Any CHC - Debt Management Ratio

26
Increase/(Decrease) in Net Assets Measures Financial Results from Operations Calculation: Total Operating Revenues (Audited Stmt of Activities) - Minus - Total Operating Expenses (Audited Stmt Activities) Donated Capital Assets increase Net Assets but are not included in order to evaluate the results from operations only.
 in Net Assets Measures Financial Results from Operations Calculation: Total Operating Revenues (Audited Stmt of Activities) - Minus - Total Operating Expenses (Audited Stmt Activities) Donated Capital Assets increase Net Assets but are not included in order to evaluate the results from operations only.")
27
Any CHC - Increase/Decrease in Net Assets

28
Net Patient Services Revenue Measures Amount of Revenue Derived from Patient Services Calculation: Total Patient Services Revenue (per Audit) Net of Adjustments for Contractual Allowances, Discounts, Bad Debt, and Reserve for Doubtful Accounts Patient Services Revenue is an important resource for covering the costs of providing services. These revenues should increase over time due to inflation and more importantly due to growth in the number of patients served annually.

29
Any CHC - Net Patient Services Revenue

30
Any CHC - Federal 330 Grants & Other Sources of Revenue

31
Any CHC - Percent of Patient Services and Other Non-Federal 330 Sources of Revenue

32
Percent of Income from BPHC Receipts Measures Efficiency in Establishing Other Sources of Income Calculation: BPHC Health Center Cluster Grant Funds - divided by - Total Annual Income from All Sources

33
Any CHC - Percent of Income from BPHC Receipts

34
Percent Change: Net Patient Services Revenue compared to Net Patient Accounts Receivable Measures Effectiveness of Patient Services Revenue Accounting Procedures Calculation: Percent Change in Net Patient Revenues (Audits Year to Year) Compared to Percent Change in Net Patient Services Accounts Receivable The trend lines should be a mirror image if accounting procedures for patient services revenue are effective. Fluctuations and crossing trend lines is an indication of the need for accounting/audit adjustments to bring amounts in line with realizable values (collectible amounts).
..")
35
Any CHC - Percent Change: Net Patient Revenues compared to Net Patient Accounts Receivable

36
COLLECTION RATE ( Percent of Gross Charges Collected) Measures Efficiency in Collecting Patient Services Revenue Calculation: Total Charges Collected (Table 9-D, Col. 3, Line 14) - divided by - Total Gross Charges (Table 9-D, Col. 2, Line 14) The Calculation can be done for each payer type using the same formula - subtotal for each payer type from Table 9-D.
 - divided by - Total Gross Charges (Table 9-D, Col. 2, Line 14) The Calculation can be done for each payer type using the same formula - subtotal for each payer type from Table 9-D..")
37
Any CHC Percent of Gross Charges Collected

38
Issues that Affect the Collection Rate: Fee Schedule Patient Mix by Financial Payer Class Patient Registration Practices Billing and Collection Policies and Procedures Provider Coding Norms FQHC (Prospective Payment) Rate FQHC Rate Setting & Settlement Policies & Procedures Degree of Medicaid and Other Managed Care Sliding Fee Discount Minimum Sliding Fee Discount Policies and Procedures Contractual Agreements with Health Plans Staffing Level, Skills, & Training of Billing & Collection Office Data Systems Reporting Capabilities and Monitoring Activities
 Rate FQHC Rate Setting & Settlement Policies & Procedures Degree of Medicaid and Other Managed Care Sliding Fee Discount Minimum Sliding Fee Discount Policies and Procedures Contractual Agreements with Health Plans Staffing Level, Skills, & Training of Billing & Collection Office Data Systems Reporting Capabilities and Monitoring Activities")
39
Average Charge Per Billable Encounter Measures Effectiveness of Fee Schedule and Coding Practices Calculation: Total Gross Charges (for the period) - divided by - Total Billable Encounters (for the period) Includes medical (physicians + mid-levels), dental, & mental health services Data is obtained from the UDS Report - Tables 5 and 9-D
 - divided by - Total Billable Encounters (for the period) Includes medical (physicians + mid-levels), dental, & mental health services Data is obtained from the UDS Report - Tables 5 and 9-D")
40
Any CHC Average Charge Per Billable Encounter

41
Average Collection Per Billable Encounter Measures Effectiveness of Billing and Collection Efforts Calculation: Total Charges Collected (for the period) - divided by - Total Billable Encounters (for the period) Includes medical (physicians + mid-levels), dental, & mental health services Data is obtained from the UDS Report - Tables 5 and 9-D
 - divided by - Total Billable Encounters (for the period) Includes medical (physicians + mid-levels), dental, & mental health services Data is obtained from the UDS Report - Tables 5 and 9-D")
42
Any CHC Average Collection Per Billable Encounter

43
Patient Payer Mix Measures Distribution of Patients by Financial Class Calculation: Patient Users - Each Financial Class (UDS Table 4) - Divided By - Total Patient Users (UDS Table 4) Due to significant differences in the average revenue received per encounter by Third Party Payers and Self-Pay Patients the Patient Payer Mix has a significant impact on revenue potential, collection rates, and profitability.
 - Divided By - Total Patient Users (UDS Table 4) Due to significant differences in the average revenue received per encounter by Third Party Payers and Self-Pay Patients the Patient Payer Mix has a significant impact on revenue potential, collection rates, and profitability.")
44
Any CHC - Patient Mix by Payer Type

46
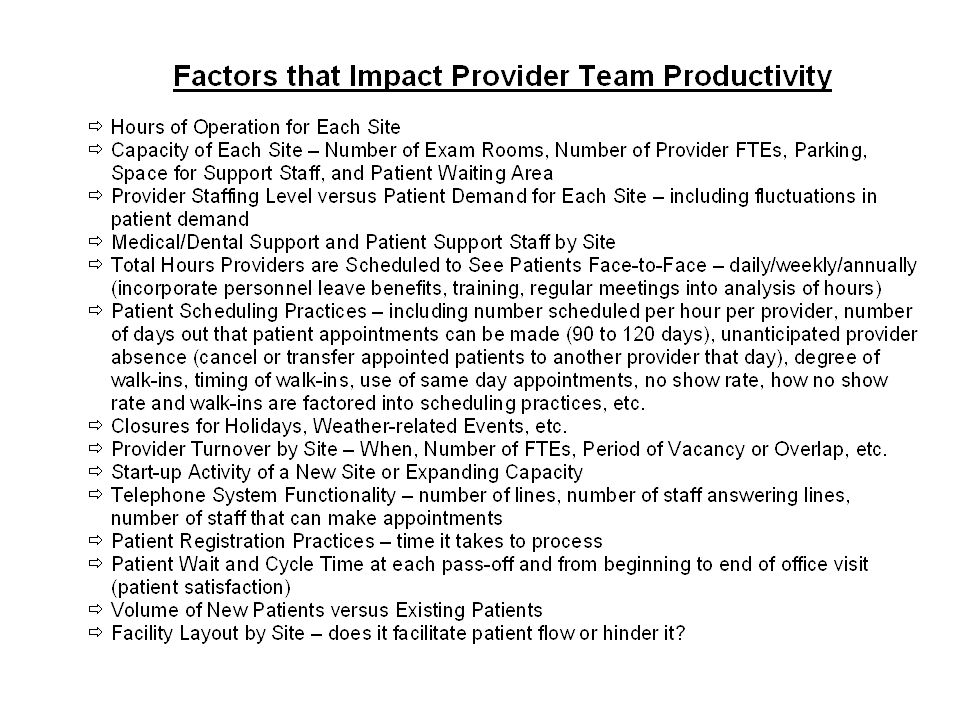
Provider Team Productivity Measures Provider/Practice Efficiency Medical Team Calculation: Total Provider Medical Encounters (physicians and mid-levels only) - divided by - Physician FTEs + 50% of Mid-Level FTEs The Dental Team Productivity is Calculated in the Same Manner with Hygienists at 50% of the FTE Value
 - divided by - Physician FTEs + 50% of Mid-Level FTEs The Dental Team Productivity is Calculated in the Same Manner with Hygienists at 50% of the FTE Value")
47
Any CHC - Medical Provider Team Productivity

48
Any CHC - Dental Provider Team Productivity

50
Average Number of Visits Per User Measures Practice Quality, Comprehensive Care, and Acuity Calculation: Total Provider Medical Encounters (physicians and mid-levels only) - divided by - Total Medical Users (Patients) The Measure is Calculated in the Same Manner for Each Type of Service Provided by a Health Center
 - divided by - Total Medical Users (Patients) The Measure is Calculated in the Same Manner for Each Type of Service Provided by a Health Center")
51
Any CHC - Average Number of Visits Per User

52
Any CHC - Support Staff Ratios

53
Uncompensated Care Ratio Measures Efficient Use of BPHC Grant Funds Calculation: Sliding Fee Discounts + Medicaid Contractual Adjustments (only if aggregate amount reduces gross charges) - divided by - BPHC Health Center Cluster Grant Funds
 - divided by - BPHC Health Center Cluster Grant Funds")
54
Any CHC Uncompensated Care Ratio

55
Factors Impacting the Uncompensated Care Ratio Fee Schedule/Charge Master - Are Fees in Line with Market/National Norms? Set for All Services Provider Coding Norms - Based on National Benchmarks/Under-coding Sliding Fee Discount Policies and Procedures Sliding Fee Discount Minimums - How do they compare with neighboring CHCs/National? Sliding Fee for Ancillary Services - All Inclusive versus Separate Minimum? Sliding Fee for Underinsured - Co-Pays and Deductibles? Policy on Failure to Pay - How is the Patient Handled? Bad Debt Write-off? Signage on Availability of Sliding Fee - How do Patients Know? Methods Used to Inform Community About Discounted Services Patient Registration Practices - How is the Application Process Handled? FQHC (Prospective Payment) Rate FQHC Rate Setting & Settlement Policies & Procedures Amount of BPHC Health Center Cluster Grants Patient Mix by Financial Payer Class - Sliding Fee (by category) and Medicaid Billing and Collection Policies and Procedures Staffing Level, Skills, & Training of Front Desk, Patient Reps, Billing & Collections Data Systems - Is the data captured? How Reporting Capabilities and Monitoring Activities
 Rate FQHC Rate Setting & Settlement Policies & Procedures Amount of BPHC Health Center Cluster Grants Patient Mix by Financial Payer Class - Sliding Fee (by category) and Medicaid Billing and Collection Policies and Procedures Staffing Level, Skills, & Training of Front Desk, Patient Reps, Billing & Collections Data Systems - Is the data captured. How Reporting Capabilities and Monitoring Activities.")
56
Percent of Administrative & Facility Costs Measures Operating Efficiency for Overhead Costs Calculations: Total Administration Costs (Table 8-A, Col. (a), Line 15) - divided by - Total Accrued Costs (Table 8-A, Col. (c), Line 17) Total Facility Costs (Table 8-A, Col. (a), Line 14) - divided by - Total Accrued Costs (Table 8-A, Col. (c), Line 17)
, Line 15) - divided by - Total Accrued Costs (Table 8-A, Col. (c), Line 17) Total Facility Costs (Table 8-A, Col. (a), Line 14) - divided by - Total Accrued Costs (Table 8-A, Col. (c), Line 17).")
57
Any CHC Percent of Admin & Facility Costs

58
Any CHC - Current Ratio Contributing Factors: CF1: CF2: CF3: CF4: CF5: CF6:

59
Restricting Factors: RF1: RF2: RF3: RF4: RF5: RF6: Any CHC - Current Ratio

60
Performance Improvement Options: PIO1 PIO2 PIO3 PIO4 PIO5 Any CHC - Current Ratio Next Steps

Similar presentations