Download presentation
Presentation is loading. Please wait.

1
IAQ Overview Short overview of what IAQ is about.
Indoor air quality is important because we spend about 90% of our time indoors. Indoor air quality is not a simple, easily defined concept. The principles behind dealing with IAQ problems are a science, but art is involved in dealing with people. Multidisciplinary approach involving medicine, HVAC, engineering, IH, Human Resources. IAQ is a constantly changing interaction of a complex set of factors - people and mechanical systems.

2
This course will cover:
Standards and Codes Respiratory System HVAC Contaminants, Chemical and Biological How To Do An IAQ Investigation Planning to Prevent IAQ Problems Exercises and Case Studies Standards and Codes as they relate to IAQ. Respiratory system and how it functions in relation to inhaling irritants and disease causing organisms in buildings. Biological and chemical contaminants likely to be found in buildings. Biological includes bioaerosols, living and fragments. The practical mechanics of conducting IAQ walk-through surveys and employee surveys. Monitoring instruments and types of sampling.

3
Typical complaints Upper respiratory irritation Dry throat
Eye irritation Coughing Headache, fatigue, inability to concentrate Congestion Dizziness and nausea Upper respiratory irritation, headache, and fatigue are usually most common symptoms. May be causes unrelated to building. Multiple chemical sensitivity is sometimes mentioned. It is controversial.

4
Cause of Symptoms Nonverifiable, dissatisfied employees
Actual verifiable problem Bacteria grow in HVAC system and distributed throughout building Nonverifiable, dissatisfied employees Mass psychogenic disease - caused by suggestions that people should be feeling sick IAQ investigation may not always produce a concrete reason for the problems noted. However, many times deficiencies are seen which could contribute to the problem and seem to help resolve the situation when improvements are made. The two examples on slide are meant to show the wide range of verifiable to nonverifiable problems. Most problems are in the middle in terms of finding the actual cause. The next slide shows this range graphically.

5
Spectrum of causes Actual verifiable Nonverifiable physical agent
Give examples of actual verifiable physical agent and nonverifiable physical agent. Sometimes a physical agent may be present in combination with psychological factors such as a clash of personalities or a perception that the employer does not care about the well-being of employees. Bacteria throughout bldg Mass psychogenic illness

6
IAQ Has Become An Issue Since 1973 tighter building construction
Energy conservation Costs more to heat/cool outside air Windows do not open Less control over environment Better individual adjustment IAQ issues have been around a long time. Over 200 years ago Benjamin Franklin wrote about the smoky effects of a sealed room where a fireplace was located. Much of the cooking at that time was done inside over a fire. In the 1930’s researchers first suggested an amount of outside air be brought into buildings. Mostly because of odor control from smoking and body odor (not as many baths then). Pose question “Why has IAQ become an issue in the 80’s and 90’s?” There were oil embargos in 1971 and Energy became more expensive and tried to save energy. Energy saving techniques such as better insulation and tighter, more controlled buildings were in place by 80’s and 90’s. In 1975, ASHRAE reduced recommended outside air to 1/5 of what it had been. When windows opened, employees had better control over their temperature and felt more control over environment. When individuals lose control, over their work area, more stressful. Example is one thermostat for a large office area.
. Pose question Why has IAQ become an issue in the 80’s and 90’s There were oil embargos in 1971 and Energy became more expensive and tried to save energy. Energy saving techniques such as better insulation and tighter, more controlled buildings were in place by 80’s and 90’s. In 1975, ASHRAE reduced recommended outside air to 1/5 of what it had been. When windows opened, employees had better control over their temperature and felt more control over environment. When individuals lose control, over their work area, more stressful. Example is one thermostat for a large office area.")
7
IAQ Has Become An Issue New building and construction materials
Large amount of time spent indoors Increased public awareness Increased % of population has asthma and allergies Tighter building construction methods were advised. In house construction now you see “house wrap”. Tight buildings are not necessarily bad if managed correctly with some fresh air. However, many building managers tried to keep all outside air from getting into building and standard setting organizations recommended much less outdoor air for ventilation. State of Ohio actually made grants to school systems in the 70’s to block off fresh air from coming into schools as part of their money saving strategy. Another reason for concern about IAQ is greater expectations about working conditions.

8
Importance of IAQ Productivity Desirability of rental properties
Potential liability issues Good IAQ enhances occupant health, comfort, and morale

9
Proactive Management Building air quality should be managed like other aspects of the business. To impress on top management the need for good air quality, you need to focus on how much money is being spent on the salaries of employees compared to the amount that is spent on environmental services for those employees. In most cases only, 1 percent of total cost of staffing a building are related to the energy costs. Spending a little more on having good IAQ can produce large dividends in employee productivity.

10
Proactive Management IAQ is influenced by a constantly changing interaction of employees and the building mechanical system.

11
COST BENEFIT ANALYSIS

12
IAQ Cost / Benefit Analysis
SECTION ONE Ways to think about the economic impact of poor indoor air quality. . . 1

13
“ ‘Sick Building’ workers get $1.5 Million”
Costs of legal action: “ ‘Sick Building’ workers get $1.5 Million” The Cincinnati Enquirer, August 16, 1997 2

14
Annual IAQ costs $60,000,000,000 this is the EPA’s estimate for costs to US businesses from IAQ problems most of the cost is the result of lost productivity the remainder: WC and health care

15
ENVIRONMENTAL PROTECTION AGENCY’S COST ESTIMATES

16
Total Cost Estimate Based on the following criteria:
Material & Equipment Cost Direct Medical Cost Indirect Medical Cost Lost Production 6

17
Material & Equipment Damages
Bell Communication Research $10,000 - $380,000 per event 7

18
Direct Medical Cost Poor IAQ Average 0.24 doctor visits/worker/year
Average cost per office visit = $40 Estimated work force = 64 million workers 64,000,000 x 0.24 visits x $40/visit = $614,400,000 8

19
Indirect costs loss in production investigation time
cost of overtime or replacement worker employee morale cost to fix problem (possibly duplicates work that should have been done originally) 9
 9.")
20
“Sick building” costs*
assumption: 1% IAQ-related absenteeism rate $300 annual productivity losses per employee *research from Healthy Buildings International 10

21
Lost Production Less effective because workers feel --
fatigued, suffer from headaches eye irritation Accomplish less work per hour Spend more time away from the work location 11

22
Lost Production EPA concluded --
Average production loss of 3% due to poor IAQ Equivalent to 14 minutes/day in lost work time Average of 0.6 added sick days/worker 12

23
COST RECOVERY

24
Cost recovery Labor Costs - salary levels & occupancy load (150 square feet/person) $100 to $300 per ft2 /year Energy Costs $1.00 to $2.00 per ft2 /year Total Environmental Control Costs $ $10.00 per ft2 /year 13

25
Energy costs vs personnel costs
Energy costs are ususally less than one percent of personnel costs. 14

26
Heating, ventilation, and air-conditioning (HVAC) & costs
At 20 percent relative humidity, a room temperature of 86 degrees F is needed to match comfort of a 70 degree room at percent relative humidity It is less expensive to add 30 percent humidity than to add 16 degrees! 15

27
Material & Equipment Damages

28
Environmental Protection Agency Air Pollution Effects on Materials

29
Environmental Protection Agency Air Pollution Effects on Materials, cont.

30
INDIRECT COSTS ARE 4 TO 10 TIMES THE DIRECT COST INDIRECT COST DIRECT
VS INDIRECT COST 7

31
Injury and Illness Costs
Medical Compensation costs (Insured costs)
")
32
Ledger Costs of Property Damage
Building damage Tool & equipment damage Product & material damage Production delays and interruptions Legal expenses Expenditure of emergency supplies & equipment Interim equipment rentals Investigation time

33
Uninsured Miscellaneous Costs
Wages paid for time lost Cost of hiring and/or training replacements Overtime Extra supervisory time Clerical time Decreased output of injured worker upon return Loss of business and good will

34
CHOP: Main Elements of IAQ Problems
Contaminants HVAC System Deficiencies Occupant Behavior Pathways

35
Standards & Codes

36
Standards or Recommendations?
What “standards”? OSHA ASHRAE ACGIH OBBC NIOSH BOCA EPA HUD Compare IH evaluations in industry (quant.) vs. office (qual.)
 vs. office (qual.)")
37
Risk Rankings

38
OSHA & ACGIH (PELs & TLVs)
Based on health effects to healthy adults of exposures for 8 hour days over a working lifetime Issue: relevance to office setting where focus may be 1) comfort or 2) desire for absence of unusual sensory stimuli? Chronic & acute / Population differences and children.
 comfort or 2) desire for absence of unusual sensory stimuli Chronic & acute / Population differences and children.")
39
OSHA Occupational Safety & Health Administration
IAQ standard on hold Nothing new Record-keeping is emphasized

40
NIOSH National Institute for Occupational Safety & Health
Research arm for OSHA HHE* provide unique, valuable info on building related illnesses Provides useful specific guidance -- e.g., on CO2 levels even though recommendations only *Health Hazard Evaluations

41
NIOSH National Institute for Occupational Safety & Health
Technical info: Publications: e.g., “Guidance For Indoor Air Quality Investigations” (1987)
")
42
EPA Environmental Protection Agency
National Ambient Air Quality Standards (six contaminants) Set in order to protect the public 24 hours a day Issue: relevance for office IAQ problems? Off-site vs. on-site exposures / animal & vegetation vs. man.
 Set in order to protect the public 24 hours a day. Issue: relevance for office IAQ problems Off-site vs. on-site exposures / animal & vegetation vs. man.")
43
National Ambient Air Quality Standard

44
Comparing Industrial and IAQ limits

45
ASHRAE American Society of Heating, Refrigerating, and Air-Conditioning Engineers
Developed specifically for the indoors Thermal comfort guidelines ( ) See BAQ, p Ventilation standard ( ) See BAQ, p. 137
 See BAQ, p Ventilation standard ( ) See BAQ, p")
46
ASHRAE 55 - 1992 Temperature range: Relative humidity range:
F in winter F in summer Relative humidity range: above % in winter below 60 % in summer Show how to use sling psychrometer; digital pen; Q-Trak

47
ASHRAE American Society of Heating, Refrigerating, and Air-Conditioning Engineers
(Now ) Applies to residential & commercial Guideline: “satisfy” 80% of occupants CFM refers to OUTSIDE air supplied per person
 Applies to residential & commercial. Guideline: satisfy 80% of occupants. CFM refers to OUTSIDE air supplied per person.")
48
ASHRAE American Society of Heating, Refrigerating, and Air-Conditioning Engineers
Defines acceptable indoor air quality as: “air in which there are no known contaminants at harmful concentrations as determined by cognizant authorities and with which a substantial majority (80% or more) of the people exposed do not express dissatisfaction.”
 of the people exposed do not express dissatisfaction.")
49
ASHRAE American Society of Heating, Refrigerating, and Air-Conditioning Engineers
Fresh Air Per Occupant Standard: Non-smoking Smoking area: area: CFM 50 CFM CFM 20 CFM / CFM 60 CFM Over time and energy crisis.

50
ASHRAE Outdoor Air Requirements (62-1999)
Show how to use CO2 equipment

51
ASHRAE Guidelines for Carbon Dioxide
Instantaneous level Outdoor air = parts per million (ppm) People exhale 2-3% CO2 1% = 10,000 ppm 1000 ppm guidance level based on 300 ppm outdoor level
 People exhale 2-3% CO2. 1% = 10,000 ppm ppm guidance level based on 300 ppm outdoor level.")
52
IAQ Indicators Table (Room#)
")
53
62-1999 (Continuous Maintenance)
June 1997 instead of revision of entire std. 62-c; Std. Will no longer deal with thermal comfort issue, 62-d; Compliance does not assure relief for susceptible individuals, 62-e; Removes smoking reference since EPA carcinogen, 62-f; Changes 1000 ppm to difference between indoor and outdoor

54
62 - 1989 R (Revised) System commissioning
Satisfy accustomed occupants Minimum filtration efficiencies Continuous HVAC operation HVAC protection during renovation Balance ventilation every 5 years Monthly record of filter pressure drop CO level > 3 ppm above outdoor level

55
HUD US Dept. of Housing & Urban Development
Source emission standard Product standard limiting formaldehyde exposures from pressed wood products in mobile & manufactured homes <0.2 PPM plywood <0.3 PPM particleboard Goal: indoor HCHO exposures <0.4 PPM, but TLV is now 0.3 PPM! Add lead.

56
HUD (continued) Ventilation standard
Part of its mortgage insurance and low rent public housing program as well as construction requirements for manufactured housing

57
HUD (continued) Ventilation standard
Area at least 8% the size of floor area must be available for natural ventilation, or Mechanical system available to change room air every 30 minutes (2 ach)
")
58
Model Building Codes Purpose: identify design & construction specifications for buildings (housing) Updated to reflect new knowledge or incorporate standards State & local governments can use part or all of a code.

59
Model Building Codes Primary codes in US:
BOCA Building Officials & Code Administrators International SBCCI Southern Building Code Congress International CABO Council of American Building Officials APHA American Public Health Association

60
Model Building Codes Ventilation specification areas (examples):
Area of window space & amount openable Alternatives to openable windows Bathroom exhaust Crawl space ventilation openings Attic ventilation

61
Ohio Model Building Codes
Ohio Basic Building Code (OBBC) Uses BOCA’s Nat’l Mechanical Code (Article 16, “Ventilation Air”) Article 16 [Ohio Admin. Code 4101:2-47] “Ventilation Air (Mechanical)”
 Uses BOCA’s Nat’l Mechanical Code. (Article 16, Ventilation Air ) Article 16 [Ohio Admin. Code 4101:2-47] Ventilation Air (Mechanical)")
62
Ohio Model Building Codes
Ventilation required depends on occupant load & use of the space; e.g., 35 CFM in conference rooms Specifies minimum outdoor air of 5 CFM per person

63
Ohio Model Building Codes
Smoking areas not specifically addressed Recirculation rates specified (max.: 67 to 85 %)
")
64
Other resources : ACGIH Industrial Ventilation Manual “Ventilation Aspects of Indoor Air Quality” OSHA Technical Manual “Indoor Air Quality Investigations” ACGIH Ind. Ventilation / OSHA Tech. Manual / Stds. Books BWC: Division of Safety & Hygiene Indoor Air Quality Revised: 1/7/99 Tab 3 -64

65
IAQ Tools for Schools Action Kit
IAQ Coordinator’s Guide IAQ Coordinator’s Forms IAQ Backgrounder IAQ Problem Solving Wheel IAQ Checklists Teachers Administrative Staff Health Officer Building Maintenance Food Services Renovation and Repair

66
Additional Resources American Lung Association ACGIH ASHRAE
800 LUNGUSA ACGIH ASHRAE Bldg.Air Quality Alliance Division of Safety & Hygiene 800 OHIOBWC EPA IAQ Division EPA Research & Inform. Clearinghouse Tool for School Pub.# National Air Duct Cleaning Association National Air Filtration Association National Pesticide Network NIOSH 800-35NIOSH Ohio Dept. of Health Env. Health Div. Ohio State Un. Extension Services OSHA / GPO Clev Col Tol Radon Information Hotline

67
Standards on the Web ansi.org -Amer. Nat. Standards Institute
asce.org -Amer. Society of Civil Eng. ashrae.org -Am. Society of Heating Refrig. & Air-conditioning Eng. astm.org -Am. Soc. For Testing and Materials bocai.org -Building Officials & Code Administrators International energycodes.org-U.S.Dept. of Energy Bldg. Stds. & Guidelines Program icbo.org -International Conference of Building Officials nateval.org -National Evaluation Services, Inc. ncsbcs.org -Nat. Conf. Of States on Bldg. Codes and Standards, Inc. nfpa.org -The National Fire Protection Association nibs.org -National Institute of Building Sciences nist.gov -National Institute of Standards and Technologies nssn.org -National Resource for Global Standards

68
The Respiratory System
2

69
Content covered Overview of respiratory system function
How chemicals can interact with the respiratory system We will examine how the respiratory system functions, how airborne chemicals behave, and how airborne chemicals interact with the respiratory system. 3

70
Chemistry versus Physics
130,000 toxic chemicals - NIOSH 650,000 hazardous chemicals- OSHA Physics - only 3 physical states: Solid Liquid Gas Chemistry presents us with literally thousands of potential hazards. To organize our thoughts, it is helpful to turn to physics. No matter how many chemicals are present, they can only exist in three physical forms: solid, liquid or gas. It is easier to understand three physical forms than it is to think about 130,000 individual chemicals. Thus, physics provides a framework to organize our thoughts about chemical exposures. 4

71
Physical states of matter -- GAS
a state of matter having very low density & viscosity compared with solids & liquids (expands to fill its container) at NTP (Normal Temperature and Pressure) is in the gaseous state 5
 at NTP (Normal Temperature and Pressure) is in the gaseous state. 5.")
72
Physical states of matter -- LIQUID
Vapor: gaseous phase of a substance whose normal state is as a liquid (mimics a gas) Mist: tiny liquid droplets suspended in air (mimics a particle) synonyms - fog, spray 6
 Mist: tiny liquid droplets suspended in air (mimics a particle) synonyms - fog, spray. 6.")
73
Physical states of matter
Solids - become airborne as dusts, fumes or fibers Aerosol - general term including both airborne liquids and solids 7

74
Physical states of matter -- SOLID
Dust: finely divided solid particles typically generated by mechanical processes Examples: sawing, grinding, sanding It is sometimes helpful to think about the energy required to generate air borne solids. Assume that we begin with a solid block and break it down into smaller particles. As we break the block into smaller and smaller pieces, we expend more and more energy. 8

75
Physical states of matter -- SOLID
Fume : a solid which has been heated to a vapor and cooled quickly, condensing as extremely small particles Examples: welding, soldering It requires large amounts of concentrated energy to generate fumes. 9

76
Physical states of matter -- SOLID
Fiber: an airborne solid whose length is at least three times its width. Examples: asbestos, fiber glass, man-made mineral fibers, refractive ceramic fibers 10

77
Deposition in the Respiratory System
Gases and Vapors - solubility in water. (Fat-soluble chemicals tend to affect other organs) Aerosols ( airborne liquids and solids) - particle size 11
 Aerosols ( airborne liquids and solids) - particle size. 11.")
78
Water-Soluble Chemicals
Highly water-soluble: Formaldehyde Ammonia Acids They tend to act rapidly mainly on the eyes, skin, mouth & throat. 12

79
Water-Soluble Chemicals
Less water-soluble: Chlorine Sulfur dioxide These tend to affect the upper respiratory tract. 13

80
Water-Soluble Chemicals
Low in water-solubility: Phosgene Oxides of nitrogen Site of injury: delayed onset of symptoms affecting lower respiratory tract (at alveoli). 14
. 14.")
81
Fat-Soluble Chemicals
More likely to end up beyond the respiratory system -- for example, in the blood and major organ systems Examples: some pesticides, amines, & alcohols 15

82
Micron One millionth of a meter About 1 thousandth the size of a hair
or um 16

83
Particle deposition mechanics
Impaction - inertia Interception - contact especially fibers Sedimentation - gravity Diffusion - movement due to kinetic energy of the particle Impaction -”An object in motion tends to stay in motion in a straight line unless acted upon by an outside force…“ Sir Isaac Newton. Larger particles have more momentum than smaller particles. It takes a greater force to divert them from their straight line of travel. When initially inhaled, air moves rather fast. Larger, heavier particles cannot negotiate the turns as readily as smaller particles. Thus, larger particles tend to impact the upper respiratory tract. Interception - When a particle touches the moist lining of the respiratory tract, it typically deposits there. Sedimentation - Once the air reaches the deepest regions of the lungs, it has lost much of its movement. With very little air movement to keep them aloft, particles tend to settle because of gravity. Diffusion - Very small particles tend to mimic individual molecules. Like a tiny puppy with too much energy, they tend to “bounce off the walls.” However, once particles contact the moist (sticky) walls of the respiratory system, they no longer “bounce,” they adhere where they contact. 17
 walls of the respiratory system, they no longer bounce, they adhere where they contact. 17.")
84
The Lungs Very large surface area
70 M2 in healthy male (or, about 40 times greater than surface area of external skin) Very thin membrane required at gas exchange area (only 1/2 to 1 micron thick in healthy persons, thickness of a soap bubble) Different references quote different surface areas for the lungs. The third edition of Fundamentals of Industrial Hygiene, by the National Safety Council, (page 35) states, “The respiratory surface in the lungs ranges from about 28 meters squared (300 square feet) at rest to about 93 meters squared (1,000 square feet) at deepest inspiration.” 18
 Very thin membrane required at gas exchange area (only 1/2 to 1 micron thick in healthy persons, thickness of a soap bubble) Different references quote different surface areas for the lungs. The third edition of Fundamentals of Industrial Hygiene, by the National Safety Council, (page 35) states, The respiratory surface in the lungs ranges from about 28 meters squared (300 square feet) at rest to about 93 meters squared (1,000 square feet) at deepest inspiration. 18.")
85
Respiratory System Function: Gas exchange between atmosphere & blood
Parts: Upper respiratory system: Mouth, nose, pharynx, larynx Lower respiratory system: Trachea, bronchi, bronchioles, lungs 19

86
Respiratory System - Anatomy
Anatomy (parts continued) In addition to upper and lower respiratory system, we can think of the respiratory system in terms of airways and gas exchange region. Actual gas exchange takes place very deep within the lungs at the respiratory bronchioles and alveoli. 20
 In addition to upper and lower respiratory system, we can think of the respiratory system in terms of airways and gas exchange region. Actual gas exchange takes place very deep within the lungs at the respiratory bronchioles and alveoli. 20.")
87
Upper Respiratory System
Actions: Filters/traps large particles (8-10 microns) Nose filters Mucous traps Impaction at sharp bends Humidifies & heats air taken in Reacts with water-soluble chemicals 21
 Nose filters. Mucous traps. Impaction at sharp bends. Humidifies & heats air taken in. Reacts with water-soluble chemicals. 21.")
88
Lower Respiratory System
Actions: Traps & expels particles in mucous (muco-ciliary escalator) Provides less abrupt directional changes; particles 1 to 5 microns deposited Particles in the range of 1 to 5 microns tend to be deposited in mucous and are expelled by the muco-ciliary escalator. 22
 Provides less abrupt directional changes; particles 1 to 5 microns deposited. Particles in the range of 1 to 5 microns tend to be deposited in mucous and are expelled by the muco-ciliary escalator. 22.")
89
Lower Respiratory System
Actions (continued): In lungs, gas exchange actually occurs at clusters of 300 million air sacs (alveoli) 2 cells thick Particles smaller than 1 micron can reach the alveoli 23
: In lungs, gas exchange actually occurs at clusters of 300 million air sacs (alveoli) 2 cells thick. Particles smaller than 1 micron can reach the alveoli. 23.")
90
Gas Exchange Oxygen in (and quite a bit out) Carbon dioxide out
Thin-walled (2 cells thick normally) But: chemicals (and disease) can cause thickening Exhaled air contains about 15 % oxygen and about 5 % carbon dioxide. 24
 But: chemicals (and disease) can cause thickening. Exhaled air contains about 15 % oxygen and about 5 % carbon dioxide. 24.")
91
Gas Exchange (continued)
Thickening can interfere with gas exchange; example: pneumonia, pulmonary fibrosis (scarring) Lack of elasticity in lungs also a problem; example: emphysema 25
 Lack of elasticity in lungs also a problem; example: emphysema. 25.")
92
Respiratory System Disorders
Now that we know how the respiratory system functions, we can better understand what can go wrong in terms of disease. 26

93
Emphysema Occurs when adjacent walls in alveoli break through, causing a reduction in the number of air sacs This decreases the total gas exchange surface that is available Over time, the lung becomes less elastic, and the outflow of air is obstructed Explain the grape cluster analogy. 27

94
Chronic bronchitis Inhaled irritants cause excessive production of mucous in lower respiratory passages They also cause inflammation & fibrosis (hardening) of the skin surface (mucosa) 28
 of the skin surface (mucosa) 28.")
95
Chronic bronchitis (continued)
The result: airway obstruction, poor ventilation of lungs, & interference with the gas exchange process Bacteria thrive in the mucous & so pulmonary infections often occur 29

96
ETS* -- Respiratory effects
Irritates mucous membranes Interferes with system which mechanically expels contaminants Causes a decrease in respiratory performance (e.g., emphysema) Can worsen effects of a respiratory disease as well as delay healing *Environmental Tobacco Smoke 30
 Can worsen effects of a respiratory disease as well as delay healing. *Environmental Tobacco Smoke. 30.")
97
ETS Causes both: emphysema, and chronic bronchitis 31

98
Protective Measures Nasal hairs filter larger particles
Sharp directional changes in pathway cause particles to be caught Air is heated before entering lungs Moist surfaces react with water-soluble substances before they get further into the system 32

99
Protective Measures (continued)
Organisms may kill or neutralize inhaled particles (& even inhaled micro-organisms) Cough and sneeze reflexes expel some foreign substances Allergic reactions can restrict entry of air 33
 Cough and sneeze reflexes expel some foreign substances. Allergic reactions can restrict entry of air. 33.")
100
Protective Measures (continued)
Many of these defense mechanisms can deteriorate with age, or be compromised as a result of illness, tobacco smoking, or exposure to chemical irritants. 34

101
Allergic Reactions Muscles in bronchioles (smaller branches) contract
Mucous membranes swell Effect: reduction of airflow Note: not necessarily bad If the allergic reaction traps particles and expels them before they reach deep into the lungs, that is “not necessarily bad.” 35

102
Allergic Reactions Common toxicological concepts such as “dose” and “particle size,” etc. are overpowered by the immune system. 36

103
Heating, Ventilation, & Air Conditioning
Introduction to HVAC Heating, Ventilation, & Air Conditioning 1

104
Content covered: Terminology, principles & properties of air relevant to IAQ. Primary HVAC system functions and their impact on IAQ. Major HVAC system components & configurations used to perform these functions. 2

105
Part I - Air Terminology Principles Properties 3

106
Dry Air Approximate Composition (by volume): 78.0 % Nitrogen
20.9 % Oxygen 1.0 % Argon 0.1 % Other Gases “DRY “ because it does not contain any WATER VAPOR. In other words, if air could be completely dried such that it contained no water vapor all, its composition would be as indicated above. 4

107
Wet Air = Dry Air + Water Vapor
5

108
Wet Air Composition Approximate Composition: 78.0 % Nitrogen
20.9 % Oxygen 1 - 2 % Water Vapor 1 % Argon 0.1 % Other Gases Of the other gases, the most prevalent is CO2 which occurs naturally at approximately 350 parts per million or %. 6

109
Answer: “Billions and Billions...”
Question: How many molecules of air are in this room? Guffey: 2.7x10E19 / cubic cm 7

110
Answer: Really fast! Question: How fast do air molecules typically move? Estimated speed: approx mph! Answer courtesy of Bill Nye. 8

111
Pressure Pressure = Force / Area
The total force exerted upon a given surface at any instant divided by the area of that surface Expressed in “pounds per square inch” (psi) 9
 9.")
112
Barometric Pressure The total force of all air molecules impacting a given surface at a given instant in time divided by the area AKA: “Atmospheric Pressure” Measured using a barometer and stated in “inches of mercury” Draw a mercury barometer showing in. Hg. At sea level and 70 degrees. F the pressure exerted on the surface of the mercury by dry air is psi. This will raise the level of mercury in the tube to a height of inches. In the case of the barometer, the surface is the surface of the mercury in the dish. Draw analogy to a scale. As such, we may think of B.P. as the weight of a column of air extending from the surface of the earth to the top of the atmosphere. 10

113
Trick Question #1 Which weighs more: 1 cubic ft. of dry air or
1cubic ft. of humid air? Avoid answering why, if possible. 11

114
Air Density 75 lbs. per 1000 cubic ft. Mass of air per unit volume
At 70 ° F., the density of dry air is 75 lbs. per 1000 cubic ft. 12

115
Why Does Warm Air Rise? As the temperature increases,
Causing its density to DECREASE As air is heated it EXPANDS Its density, in turn DECREASES (Fewer molecules per unit volume) Therefore, at higher temperatures, air weighs less per cubic ft. This is why warm air rises. 13
 Therefore, at higher temperatures, air weighs less per cubic ft. This is why warm air rises. 13.")
116
Vapor A gas which may condense to a liquid at normal temperatures
Water Vapor is actually H2O gas occurring in a mixture with dry air. 14

117
Relative Humidity (RH)
Ratio of the amount of moisture present in the air to the maximum amount which it can hold at saturation at a given temperature RH varies considerably with temperature. 15

118
Human Thermal Comfort Defined in terms of both temperature AND relative humidity ASHRAE Standard contains a chart for determining human thermal comfort 16

119
Trick Question #2 Which can hold more water vapor: WARM air or
COOL air? M.W. of water: 18 M.W. of nitrogen: 28 M.W. of oxygen: 32 Water is therefore lighter than the other primary constituents of air (namely nitrogen and oxygen) In a humid air stream a small fraction of the nitrogen and oxygen molecules will be displaced by the lighter water molecules resulting in a mixture of less overall mass than an equal volume of dry air. 18
 In a humid air stream a small fraction of the nitrogen and oxygen molecules will be displaced by the lighter water molecules resulting in a mixture of less overall mass than an equal volume of dry air. 18.")
120
Sensible Heat The amount of heat which when added to air causes a change in temperature with NO CHANGE in the amount of water vapor present 19

121
Latent Heat The heat content of the water vapor present in the air 20

122
Total Heat Total Heat = Sensible Heat + Latent Heat 21

123
Part II HVAC System Functions Impact on Indoor Air Quality 22

124
The Basics Heating Ventilation Air Conditioning 23

125
HVAC System Functions Heating Cooling Ventilation Filtration
Dehumidification Humidification Distribution 24

126
Impact on IAQ Over 50% of all IAQ problems are due to Inadequate Ventilation! 25

127
Control Hierarchy Engineering controls Administrative controls
Personal Protective Equipment

128
Contaminants

129
IAQ is relevant because --
90 percent of your time is spent indoors! Home (tight construction and high efficiency furnaces, humidity, mold) to: Automobile (exhaust vapors, mold in vent and evaporator coil) to: Office
 to: Automobile (exhaust vapors, mold in vent and evaporator coil) to: Office.")
130
IAQ is relevant because --
Change in complexity of chemicals used Increase in number/types of chemicals New methods to disperse chemicals New processes/equipment RTEC’s 1000s chemicals many variants of isocyanates and glycol ethers Aerosolization of surface coating during application (e.g. stucco, shellac)
")
131
Is the problem new? “No common air from without is so unwholesome as the air within a closed room that has been often breathed and not changed.” Ben Franklin

132
Historical examples Physicians in the 1700s linked the deaths of English sailors to their unventilated cabins. In World War I, high levels of carbon monoxide accumulated in Renault tanks from long-term weapons firing.

133
The Office Setting Today
Pollutant sources: Building material emissions Furnishings Office equipment Human metabolism Outside contaminants brought inside Review exposures from bldg. Materials, furnishings, office equipment, human, outdoor, etc.

134
Building-related illness
Where 1 or more workers develop a well-defined illness, A specific cause (airborne agent & pathway) is found, and The cause is clearly related to the building. Page 11 of BAQ Not addressing spread of communicable illness (person to person contact, personal hygiene; does not amplify in building)
 is found, and. The cause is clearly related to the building. Page 11 of BAQ. Not addressing spread of communicable illness (person to person contact, personal hygiene; does not amplify in building)")
135
Building-related illness
Causative agent: Chemical, or Pathogen, or Biological allergen

136
Building-related illness -- Examples
Infectious syndromes: Legionnaires’ disease Pontiac fever Q fever Humidifier fever Hypersensitivity pneumonitis Building-related asthma

137
Sick-building syndrome*
Significant number of workers develop non-specific complaints or illness Few physical signs; absence of clinical abnormalities Specific causative agent rarely found, and assumed to be multi-factorial Highest risk: new or recently remodeled structures with tight envelopes *AKA SBS, tight building syndrome, TBS

138
Common SBS symptoms: Irritation of eyes, nose, and throat
Dry mucous membranes and skin Erythema (reddened skin) Headache, dizziness, or mental fatigue Respiratory infections or cough Hoarseness or wheezing Nausea Hypersensitivity reactions (note: if unproved) Also symptoms associated with cold, flu, allergies and stress
 Headache, dizziness, or mental fatigue. Respiratory infections or cough. Hoarseness or wheezing. Nausea. Hypersensitivity reactions (note: if unproved) Also symptoms associated with cold, flu, allergies and stress.")
139
Tight-building syndrome
Alternative definitions: Applied where engineering or architectural flaws result in either a building-related illness or a sick-building syndrome, or Applied where symptoms occur due to a tightly sealed building -- that is, where conditions permit the build-up of contaminants.

140
Sensitization Sensitivity to individual chemical*
May occur after brief or long-term exposures Assumed to be permanent Prevention: Proactive: limit exposures Reactive: remove from workplace Examples: isocyanates, formaldehyde *Antigen produces immune response ADA accommodations

141
Mass Psychogenic Illness
“Symptoms that develop in a group that is under stress (physical or emotional)” Suggested by 1) symptoms that have no organic basis or are inconsistent with exposure & 2) illness occurring only after learning of others being ill
 Suggested by 1) symptoms that have no organic basis or are inconsistent with exposure & 2) illness occurring only after learning of others being ill.")
142
Mass Psychogenic Illness (continued)
At risk: those in low-paying, stressful jobs that are boring or unrealistically paced, or within physically stressful or rigid authoritarian organizations

143
Multiple Chemical Sensitivity
Particular sensitivity to a broad range of low chemical levels Does it exist? Theories Sensitization spreads from chemical to chemical Stressor overload Psychiatric in origin Controversal: No medical diagnosis: Orhganic; physiological; Public anxiety with scientific basis (I.e., EMF, dental amalgum) Always a man made chemical, nevery from natural exposures.
 Always a man made chemical, nevery from natural exposures.")
144
Indoor Contaminants Show Drager tubes and reference pages 5-9 and 5-10; and BAQ pages 74-78; and Appendix A and mfgr’s equipment list

145
“All substances are poisons. There is none which is not a poison
“All substances are poisons! There is none which is not a poison. The right dose differentiates a poison and a remedy.” Paracelsus Review acceptable risk and how we ingest many natural toxins such as aflztoxin in peanut butter.

146
Major IAQ Contaminants
Carbon monoxide Formaldehyde VOCs (volatile organic compounds) Particulates Add list from OSHA’s FOM including: acetic acid, Nox, O3, Radon, H2S, Ammonia, Asbestos, Man-made fibers, ETS
 Particulates. Add list from OSHA’s FOM including: acetic acid, Nox, O3, Radon, H2S, Ammonia, Asbestos, Man-made fibers, ETS.")
147
AREC Evaluation Model Anticipation Sources Recognition Symptoms, signs
Evaluation Testing Control Prevention

148
A R E C Carbon Monoxide (CO) Anticipation (sources)
Cracked heat exchangers Combustion engines Poorly located air intakes Gas burners, gas ovens, wood stoves, or kerosene heaters Even from weapons firing! Mention non-vented space heaters, Lift trucks, Small engine repair ACGIH Industrial Ventilation Manual on Lift truck ventilation A R E C

149
A R E C Carbon Monoxide Recognition Possibly complaints of headache
Extreme: collapse The problem: prevents blood from carrying normal oxygen level -- and puts those with heart problems at special risk. A R E C

150
Carbon Monoxide Evaluation Note: can't be smelled, tasted, or seen. Use direct-reading instruments Passive, electronic and draw samplers TLV(ACGIH): 25 PPM PEL (OSHA): 50 PPM A R E C
: 25 PPM. PEL (OSHA): 50 PPM. A R E C.")
151
A R E C Carbon Monoxide Control Preventive maintenance
e.g., forklift tune-ups Proper ventilation design/layout Structure & location A R E C

152
Carbon Monoxide Control (continued) Appropriate policies/rules
Where and when motor vehicles can idle Equipment choice Airtight wood stoves, reduced fuel consumption kero heaters

153
A R E C Formaldehyde Anticipation (sources) Insulation (UFFI)
Composition boards Medium density fiberboard, hardwood plywood, pressed wood, particle board Carpet & carpet adhesives Review but do not do AREC A R E C

154
A R E C Formaldehyde Anticipation (sources continued) Fabrics
Gas burners, gas ovens Embalming fluids Many other sources A R E C

155
A R E C Formaldehyde Recognition Burning eyes (0.1 to 0.3 PPM)
Respiratory tract irritation (2 or 3 PPM) Dermal sensitization A R E C
 Dermal sensitization. A R E C.")
156
A R E C Formaldehyde Evaluation Odor threshold below 1 PPM
Direct reading instruments, and long-term sampling TLV: 0.3 PPM PEL: 0.75 PPM A R E C

157
A R E C Formaldehyde Control Product choice or application method
Scheduling of work (exposure) Proper isolation design Local exhaust ventilation Dilution ventilation Building commissioning procedures PPE A R E C
 Proper isolation design. Local exhaust ventilation. Dilution ventilation. Building commissioning procedures. PPE. A R E C.")
158
Volative Organic Compounds(VOC)
Classes: Aliphatic hydrocarbons e.g., n-hexane, kerosene Aromatic hydrocarbons Benzene, xylene, toluene

159
VOC -- classes (continued)
Halogenated hydrocarbons Perchloroehylene, methylene chloride, diazinon Oxygenated hydrocarbons Aldehydes, alcohols, and ketones

160
Volatility The tendency of a material to pass into the vapor state at a given temperature; that is, the tendency to evaporate into the surrounding space Ditto High and low volative examples. NAAQS

161
A R E C VOCs Anticipation Maintenance products Building materials
Combustion processes (including tobacco smoking) Industrial / laboratory chemicals Many potential sources A R E C
 Industrial / laboratory chemicals. Many potential sources. A R E C.")
162
A R E C VOCs Recognition Examples: Mucous membrane irritation
Ocular (eye) irritation Skin irritation A R E C
 irritation. Skin irritation. A R E C.")
163
A R E C VOCs Evaluation Direct reading, and Long-term sampling
Examples: N-hexane: TLV: 50 PPM; PEL 500 PPM Methyl alcohol: TLV & PEL: 200 PPM A R E C

164
A R E C VOCs Control Product choice or application method
Scheduling of work (exposure) Proper isolation design Local exhaust ventilation Dilution ventilation PPE A R E C
 Proper isolation design. Local exhaust ventilation. Dilution ventilation. PPE. A R E C.")
165
A R E C Particulates Anticipation Grinding Welding Cutting
Sawing, etc. Ditto Office ceiling vents and black marks. NAAQS Duct cleaning and guidelines of national Air Duct Cleaners Association A R E C

166
A R E C Particulates Recognition Visible contamination
Irritation of mucous membranes Lung illness A R E C

167
A R E C Particulates Evaluation Long-term methods primarily
Direct reading (increased use) Direct observation of gross contamination A R E C
 Direct observation of gross contamination. A R E C.")
168
A R E C Particulates Control Local exhaust ventilation
Dilution ventilation Material or process selection Work area isolation PPE A R E C

169
Additional information
Asbestos: See BAQ, Appendix D, pp Radon: See BAQ, Appendix E, pp Glossary / Acronyms: See BAQ, pp Tool for Schools ASHRAE, ACGIH, EPA IAQ Division, NIOSH, Local OSHA & GPO Air currents (Polution pathways) measurements with smoke tube, velometer
 measurements with smoke tube, velometer.")
170
INDOOR AIR QUALITY CONCERNS
BIOAEROSOLS INDOOR AIR QUALITY CONCERNS

171
Bioaerosols Biologically derived airborne contaminants include:
Microorganisms Fragments Toxins Particulate waste from all varieties of living organisms 5 Kingdoms (except viruses) = bacteria; fungi; animal; protozoa; plants live microorganisms - fragments, toxins, particulate waste
 = bacteria; fungi; animal; protozoa; plants. live microorganisms - fragments, toxins, particulate waste.")
172
Microorganisms Bacteria Pathogenic or Natural Flora
Unicellular prokaryotic (no nucleus) Multiplies by cell division Typically contained within a cell wall Bacteria = can also amplify indoors but lack a specific mechanism to become airborne thus needs some form of agitation (aerosolization)
 Multiplies by cell division. Typically contained within a cell wall. Bacteria = can also amplify indoors but lack a specific mechanism to become airborne thus needs some form of agitation (aerosolization)")
173
Legionella pneumophila
Anticipation Water-cooled systems Recognition Stagnant water Evaluation Bulk samples Proper diagnosis

174
Legionella pneumophila
Control Regular maintenance Temperature setting Below 40 degree F Avoid standing waters

175
Tuberculosis Anticipation Hospitals Nursing Homes Public Health
Recognition Occupants are sources, not building structure

176
Tuberculosis Evaluation Physician diagnosis of patient Control
OSHA / CDC has guidelines for prevention of spread of TB bacillus in affected industries

177
Microorganisms Virus Group of minute infectious agents
Can’t be seen by a light microscope Characterized by a lack of independent metabolism Ability to replicate only within living host cells Do not grow or amplify in building resevoir (can’t reproduce) Spread the result of crowded conditions (cold, flue, rabies, measles, mumps, chicken pox, croup)
 Spread the result of crowded conditions (cold, flue, rabies, measles, mumps, chicken pox, croup)")
178
Microorganisms Fungus - Plant Eukaryotic - true nucleus
Multiplies by mitosis No chlorophyll Rigid cell wall Simple morphology

179
Fungus Mushrooms Yeast Rusts Molds
Includes molds (largest biomass on earth) Can successfully colonize and amplify and disseminate large quantities of allergic particles indoors without agitation.
 Can successfully colonize and amplify and disseminate large quantities of allergic particles indoors without agitation.")
180
Mold Anticipation Temperature range above 40 and below 100 degree F.
Mold spores present Nutrient base (most surfaces) Moisture Add my experience with monitoring for Stachy, Atra & Pulmonary hermosiderosis in Cleveland area/Fiorilli
 Moisture. Add my experience with monitoring for Stachy, Atra & Pulmonary hermosiderosis in Cleveland area/Fiorilli.")
181
Mold Recognition Exterior corners
Poor circulation Wind washing Low insulation levels Greater surface area heat loss Set Back Thermostats - heating season Mold growth during unoccupied periods

182
Mold Recognition (continued) Air conditioned spaces Thermal bridges
Conditioned air blows against the interior surface of an exterior wall. Thermal bridges Causes localized cooling of surfaces Dust accumulation Windows Concealed condensation

183
Mold Evaluation Visible mold growth Air sampling Anderson impactor
Wipe samples Bulk samples

184
Mold Evaluation (continued) HVAC evaluation Relative humidity
Temperature control Air circulation

185
Free Water in/on bldg. Materials [Aw = Water Activity]
Aw Low=Primary colonizers (first to grow in dust/dirt on wall/ceiling cavities, carpet, furniture) Aspergillus and Penicillium fungi Aw Moderate=Secondary colonizers (common outdoors and infiltrate through air inlets & cloths) Cladosporium fungi Aw High=Tertiary colonizers (hydrophilic; grow on wet or recently wet bldg. materials; in cooling towers, humidifiers, cooling coils, and condensate pans) Fusarium/Stachybotrys fungi; Pseudomonas/ Bacillus/Streptomyces/Actinomyces G- bacteria
![Free Water in/on bldg. Materials [Aw = Water Activity]](http://slideplayer.com/slide/3901134/13/images/185/Free+Water+in%2Fon+bldg.+Materials+%5BAw+%3D+Water+Activity%5D.jpg "Aw Low=Primary colonizers (first to grow in dust/dirt on wall/ceiling cavities, carpet, furniture) Aspergillus and Penicillium fungi. Aw Moderate=Secondary colonizers (common outdoors and infiltrate through air inlets & cloths) Cladosporium fungi. Aw High=Tertiary colonizers (hydrophilic; grow on wet or recently wet bldg. materials; in cooling towers, humidifiers, cooling coils, and condensate pans) Fusarium/Stachybotrys fungi; Pseudomonas/ Bacillus/Streptomyces/Actinomyces G- bacteria.")
186
Interpretation of Results (Air)
Pathogenic fungi such as aspergillus, cryptococcus, histoplasma Toxogenic fungi such as stachybotrys atra, toxic aspergillus, fuscarium Presence of 1or more species (e.g.-2X) greater than outdoor > 50 cfu/m3 of 1 or more species except cladosporium, alternaria Different profile of species indoor than outdoor Mixture up to 150 cfu/m3 OK if similar to outdoor Higher levels OK in summer if primarily tree fungi like cladosporium Even low levels of stachybotrys and aspergillus a concern
 greater than outdoor. > 50 cfu/m3 of 1 or more species except cladosporium, alternaria. Different profile of species indoor than outdoor. Mixture up to 150 cfu/m3 OK if similar to outdoor. Higher levels OK in summer if primarily tree fungi like cladosporium. Even low levels of stachybotrys and aspergillus a concern.")
187
Mold Control Maintain relative humidity near surfaces below dew point. Reduce moisture content of the air by... Control of the source Dilution of moisture laden air with outdoor air when humidity levels are low Dehumidification

188
Mold Control (continued) Increase air movement at surface
Increase air temperature (general space or building) Near room surfaces by raising the thermostat setting Improve air circulation Decrease heat loss: Add insulation; Close cracks in exterior walls
 Near room surfaces by raising the thermostat setting. Improve air circulation. Decrease heat loss: Add insulation; Close cracks in exterior walls.")
189
Biocontamination Prevention
Upgrade filter efficiency Regular cleaning and maintenance of cooling coil & drain pans Maintain ductwork insulation to minimize applification Clean HVAC if there are obvious signs of contamination Design HVAC without porous materials inside ductwork Maintain and inspect humidifiers and cooling towers regularly Placement of outdoor air intakes away from street level, loading docks, and cooling towers. Inspect and keep clean.

190
ASHRAE 52.2 MERV MERV %Eff. Final Resist Controls Type
< in. w.g. Pollen/mites/fiber Disp./Wash./ES in. w.g. Dust/mist/spores ES/Pleated in. w.g. Fume/Legionella Box/Bag in. w.g. Tob.Sm./Bacteria Box/Ind. ES Minimum Efficiency Reporting Value (MERV) Highly controlled laboratory testing, instead of dust spot Minimum efficiency instead of average Filter ability to remove particles of specific size
 Highly controlled laboratory testing, instead of dust spot. Minimum efficiency instead of average. Filter ability to remove particles of specific size.")
191
Histoplasma capsulatum
Histoplasmosis Anticipation Animal access to buildings Recognition Bird droppings CDC document Sept. 1997 Bird droppings cource of nutrition for growth in soil Bats can be infected and spread without soil.

192
Histoplasma capsulatum
Evaluation Soil/site evaluation Proper diagnosis Control Control access to attic Reduce airborne dust

193
Hypersensitivity Pneumonitis
Most prevalent and most difficult to determine A group of allergic lung diseases resulting from sensitization and recurrent exposure to inhaled organic dust.

194
Aspergillus Fumigatus
Causative agent associated with Aspergillosis Also known as Farmers Lung

195
Aspergillus Fumigatus
Anticipation Ubiquitous Soil Potted plants Refrigerated foods

196
Aspergillus Fumigatus
Recognition Thermophilic - thrives in high temperatures Composting sites in vicinity of HVAC fresh air intake Farmers and construction workers - higher risk

197
Aspergillus Fumigatus
Evaluation Same as histoplasmosis Soil/site evaluation Air sampling Proper diagnosis

198
Aspergillus Fumigatus
Control Control animal access to attics and building structures Reduce dust disturbance

199
Allergens A substance that causes allergic reaction in sensitized populations Chemical or biological in nature Antigens Tree (April/May )- Grass (June/July) Ragweed (Sept/Oct) generally higher outside than inside. Dust Mite; Cochroach feces; VOC generation; Asthma increased 66% since 1982 even though outdoor irritants and respiral particulate levels have decreased
- Grass (June/July) Ragweed (Sept/Oct) generally higher outside than inside. Dust Mite; Cochroach feces; VOC generation; Asthma increased 66% since 1982 even though outdoor irritants and respiral particulate levels have decreased.")
200
Allergens Nonviable (not living) House dust mite fecal pellets
Cockroach feces Insect and spider remains Nonviable remains of molds and their spores

201
Allergens -- Nonviable continued
Dried reentrained animal excretions Pollens Biogenic VOC (volatile organic compounds)
")
202
Allergens Illnesses associated with these agents Allergic Rhinitis
Commonly known as hay fever Bronchial Asthma

203
Allergens - Other examples
Thermoactinomyces candidus Contaminated forced air systems Humidifier water Altered or contaminated humidifier water Various Saprophytic fungus Contaminated environments

204
Nonviable Allergens Recognition Presence of debris
Accumulation of debris in air handling units Improper cleanup from a fungus/mold growth episode Poor housekeeping After extermination of infestation

205
Nonviable Allergens (continued)
Evaluation Walk-through inspection Antigen testing Physical examination

206
Nonviable Allergens (continued)
Control Improved housekeeping practices Proper cleaning after pest extermination Maintain rodent/bird guards at fresh air intake

207
HVAC SYSTEMS 1

208
Objective Provide an overview of the components which make up a typical heating, ventilating, and air conditioning (HVAC) system 2

209
Overview What is an HVAC system? HVAC system components
Heating equipment Cooling equipment Air handling Controls 3

210
Heating Equipment Steam and Hot Water Boilers Heat Exchangers 5

211
Cooling Equipment Refrigerator Cycle Evaporators and Coils Compressors
Heat rejection equipment 6

214
Controls Proper operation critical Uncalibrated controls waste energy
Good documentation, standard lay out, accessible 9

215
Air Handling Equipment
Fan Coils Outside Air Intake Filters Humidifier 10

217
Unitary Systems Residential unit Rooftop unit Computer room unit
Window unit 11

218
Types of All Air Systems
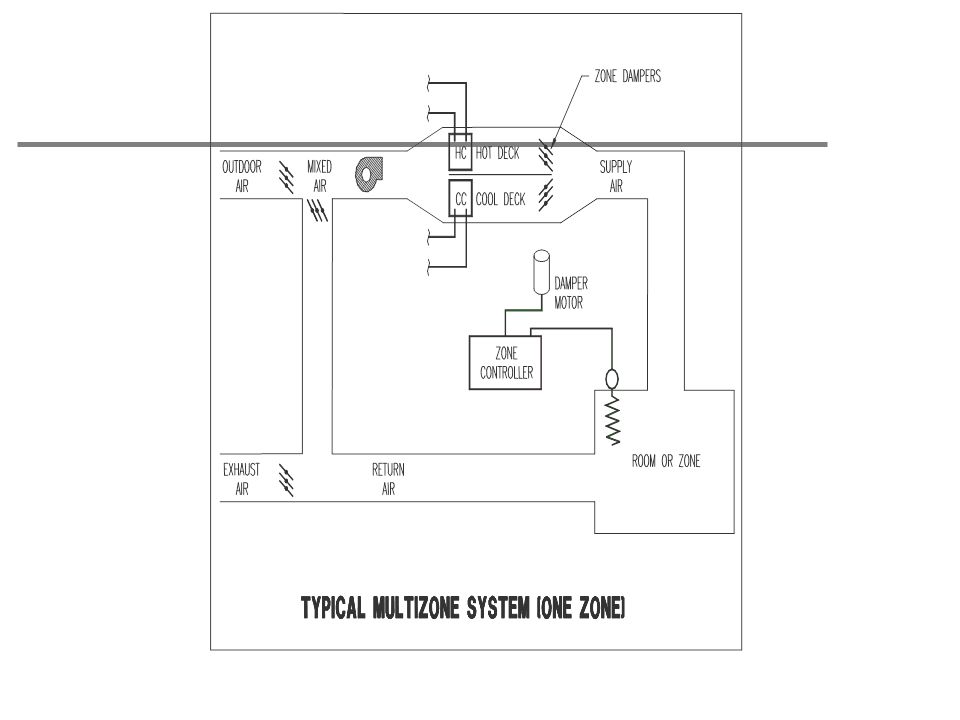
Single Zone system Variable Air Volume (VAV) system Dual Duct system Multi Zone system 13
 system. Dual Duct system. Multi Zone system. 13.")
220
Single Zone System Characteristics
Constant Volume of Air Variable Temperature of Air Control from one temperature sensor in space Effective for uniform load Simple Inexpensive 15

221
VAV System Characteristics
Variable Volume of Air Constant Temperature of Air Control at each location Effective for Variable Loads

223
Separate Coil Air-Water System Characteristics
Conditioned air delivered through independent system to meet ventilation load Terminal unit in space provides heating/cooling 18

228
Investigation and Evaluation of IAQ Problems
We have heard a lot of information about IAQ, what causes problems, and how we look at the HVAC system. Now we will look at the practical considerations in actually conducting an investigation.

229
Recognition and Evaluation
Source HVAC system Occupant Pathway Traditionally, industrial hygienists have used the AREC model . Anticipation Recognition Evaluation Control During the investigation phase, we are interested in the recognition and evaluation of IAQ problems. 4 components must be looked at in most situations to get a clear understanding of the situation. Called the SHOP or CHOP model. Source or Contaminant HVAC system Occupant Pathway These are usually involved and interrelated. 2

230
Source Outside building
Mechanical Equipment and office machines in building Human activities Building components and furnishings Page 5 of the EPA Building Air Quality manual under the “Basics” tab has a very good description of sources in a building. Ask questions of class for each of the sources in this slide. Source could be outside bldg: pollen, fungal spores, vehicle exhaust, loading dock exhaust, odor from dumpster, reentrained from building exhaust, radon, previous use of site, rooftop after rainfall with drains blocked, crawlspace Source could be equipment in the building: dust and dirt in ducts, biological growth in drip pans, coils, cleaning of HVAC system - too much cleaner, office equipment - ozone from copiers, printing press, small lab Human sources smoking, cooking, body odors, perfumes, cleaning activities, dust circulated by vacuum cleaner, maintenance activities such as painting, adhesives, pesticides Building components and Furnishings pressed wood, carpeting, textiles, asbestos, water damaged furnishings, dry sewer trap, VOC’s in new materials 3

231
HVAC system Unable to control air contaminants
Unable to control thermal climate Ask class for examples of each of these on slide. HVAC system unable to distribute adequate amounts of outdoor air. Thermal comfort on page 57 of EPA BAQ gives temperatures and relative humidities when most people are comfortable. Comfort depends on : activity level age physiology of individual clothing single thermostat for personal choice large window are (may be cold or hot if sunny) 4
 4.")
232
Occupants Sensitive TLV’s and PEL’s for average white male
Overcrowding Occupants may be allergic or sensitive individuals or have respiratory diseases. Some people may be immune suppressed, old, infant Job stress can cause similar symptoms. Improper lighting can cause similar symptoms. Multiple chemical sensitivites may be diagnosed by some physicians. 5

233
Pathways Airflow patterns HVAC system predominant path Windows, doors
Can use smoke tubes to check air flow. Shows air flow patterns in visible way so building maintenance or engineering people can better understand what you are trying to tell them. Look for high pressure to low pressure movvement through any openings. Look at elevators and the large amount of air they push through the building. Don’t forget about the effects of wind. 6

234
Pathways HVAC system X source occupant pathway Wind
Source inside building. Predominant pathway is probably through HVAC if problem is widespread. Should note direction of air flow at doors, are windows and doors open or closed, are there obstructions to air flow by walls. Wind

235
Pathways HVAC system X air intake pathway Wind Source outside
Look for possible sources of contaminant and how it could get into building. If the problem is occasional, see if the problem coincides with a certain wind direction and activity outside. Could be exhaust ventilation going back into building through intake vent. pathway Wind

236
Diagnosing IAQ Complaints
Meet with building owner/manager Initial walkthrough Interviews or questionnaires Review information More detailed investigation for specific contaminants (air sampling) Report, recommendations Apply control measures, reassess Go through step by step. 8
 Report, recommendations. Apply control measures, reassess. Go through step by step. 8.")
237
Tools for initial walk-through
CO2 meter or tubes CO meter or tubes Temperature, Relative humidity Flashlight, step ladder, tool kit Tape measure, camera Ask class to come up with tools they feel would be helpful. 9

238
Approach to IAQ Problems
Problem surfaces Controls Hypothesis Walk-through Scientific hypothesis way to view solving IAQ problems. Each time around the circle would be a more in-depth investigation. Good approach to IAQ problems is in EPA BAQ page 45 called “Resolving IAQ Problems”. 1) Problem surfaces 2) Evaluate situation through walk through and talking to manager, occupants, HVAC person 3) Tentative conclusions 4) Gather additional information, more in depth info, focus on particular source or area 5) Develop hypothesis and test. Change conditions and see if it helps 6) Repeat and attempt a long term control strategy. Gather additional info or In-depth sampling Tentative conclusions
 Problem surfaces. 2) Evaluate situation through walk through and talking to manager, occupants, HVAC person. 3) Tentative conclusions. 4) Gather additional information, more in depth info, focus on particular source or area. 5) Develop hypothesis and test. Change conditions and see if it helps. 6) Repeat and attempt a long term control strategy. Gather additional info. or In-depth sampling. Tentative conclusions.")
239
Contact building management
Area where complaints originate Type and frequency Get building layout Recent renovations? Any suspected causes? Find out where complaints came from, types and frequency. Get a building layout. Ask if anyone knows or suspects what the problem is. Very important for HVAC person responsible for that system to be present so you know the history of the HVAC system. Many buildings do not have a person dedicated to handling HVAC problems. A contractor is generally called. Make arrangements for the usual person from that contractor to be present. Ask class to think of other questions. One possible other question: Is there a preventive maint. Program? 11

240
Initial walk-through Look for sources Water damage
Presence of hazardous substances Obvious signs of occupant discomfort Look above dropped ceiling BAQ p. 23 Talk to building manager, HVAC person, employees. Sometimes employees or managers may suspect what the problem might be but haven’t told anyone. Take along a building layout so you can make notes at each area. Look at absentee records, ask about odors. Look for signs of occupant discomfort such as redirected diffusers or blocked off diffusers. Look for obvious signs of water damage, visible growth, stains, standing water on the roof. Ask about past water problems that may have been cosmetically covered over.

241
Initial walk-through (continued)
Air intakes of HVAC system Blocked pathways of HVAC system Were rooms constructed after the HVAC system was installed. Some rooms may not have air supply or return. Cubicle walls or too much furniture may block air circulation Check for maintenance records for checking linkages, change filters, calibrate thermostats. Look for signs of occupant discomfort such as blocked diffusers, fans in work areas, stuffiness complaint, propped open doors, individual heaters, personal air cleaners, or humidifiers. Look above dropped ceilings for: dirt, connected ducts, grilles through walls to allow airflow in ceiling plenum, debris (nutrients), water damage(moisture). 13
, water damage(moisture). 13.")
242
Detailed Investigation
Sampling for specific contaminant if identified Bioaerosol monitoring Limited guidelines Expensive Sampling for carbon dioxide, carbon monoxide, temperature and relative humidity are very useful. Other sampling not as useful unless you have a reason to suspect the presence of a particular contaminant. Biological sampling can be useful to identify specific agents which are known to be problems. Here again, sampling is not indicated unless you suspect its presence because of symptoms or visible water damage. Biological sampling when there is no visible water damage or when symptoms do not indicateit, is not suggested. There are no airborne biological standards. 21

243
Employee Surveys and Interviews
14

244
Data collection Questionnaires / survey forms: Interviews In person
Over phone Mailed See BAQ, pp Interviews produce more info but time consuming Be careful not to ask leading questions. 15

245
Data collection Activity logs: “Diary” type of data Tracking
activities processes symptom occurrences See BAQ, pp. 183, 187, 189 Case study. A hospital lab was having problems with odors at various unpredictable times. They kept a log of the occurrence of odors which was matched to the times a helicopter landed on a roof-top landing pad. Although they suspected this was the case, the diary was strong evidence to show a connection between the helicopter and the odors. They needed this evidence because the potential fix was expensive. 16
![]()
246
Data collection “Proactive” Complaint form See BAQ, p. 181 Reactive
Surveys, activity logs, etc. Use BAQ, page 181 sample of IAQ complaint form. If complaint forms are distributed and people know how to fill it out, it should be easier to respond quickly to a problem before more people are affected. Surveys and activity logs may be useful, but at that point many people are usually involved. For a complaint form to work, it must be taken seriously and acted on quickly. 17

247
Data collection (continued)
Ensure confidentiality Don’t bias process Be consistent Be accurate Be complete Get expert advice on question design (if writing own survey instrument) 18
 18.")
248
Data collection (continued)
Compare: “Have you been sick during the past three weeks?” (yes/no) With -- “Describe any unusual symptoms you’ve had recently.” (open-ended) Ask questions that are open-ended so more information is volunteered. 19
 With -- Describe any unusual symptoms you’ve had recently. (open-ended) Ask questions that are open-ended so more information is volunteered. 19.")
249
Data collection (continued)
Compare: “I haven’t felt well for three weeks.” With -- “I’ve had itchy eyes and a dry throat for three weeks.” 20

250
EPA Building Air Quality Action Plan
Companion to the EPA BAQ. BAQ manual is meant to help investigate current problems and develop a good IAQ program. The action plan booklet is a proactive method for taking stock of where the building is now and identifying how to develop a good IAQ program. Plan for comprehensive IAQ program 1998

251
Designate an IAQ Manager
Employee of building owner or manager Coordinates all IAQ in building Familiar with building structure and function Has authority to make changes 24 2

252
Develop IAQ Profile Comprehensive look at present situation
Document existing practices Look at structure, function, occupancy Look at design of HVAC system and any changes Make changes to layout of building 25 3

253
Address Existing Problems
IAQ Profile highlights potential problems Identify resources for emergency situations Use flowchart in EPA BAQ book (page 45) Same steps as investigating problems IAQ Profile helps to identify conditions or practices that could cause bad IAQ. Identify emergency resources refers to identifying experts or in-house people and what their roles should be in an IAQ emergency. Page 45 lays out how to diagnose an existing IAQ problem. After the problem is identified, identify the source, improve ventilation, and/or improve air filtration. 4 26
 Same steps as investigating problems. IAQ Profile helps to identify conditions or practices that could cause bad IAQ. Identify emergency resources refers to identifying experts or in-house people and what their roles should be in an IAQ emergency. Page 45 lays out how to diagnose an existing IAQ problem. After the problem is identified, identify the source, improve ventilation, and/or improve air filtration")
254
Educate Building Personnel
Give them perspective of thinking in terms of IAQ IAQ Profile helps determine who is trained Bldg. Personnel may know about things that are wrong with the building but fail to understand how that may impact employees working in the building. Education may help to reinforce Bldg. Personnel’s role in keeping employees comfortable. 5 27

255
Implement Plan for Facility Operations
HVAC preventive maintenance and standard operating procedures Housekeeping Preventive maintenance Unscheduled maintenance 28 6

256
Manage Potential Sources
Remodel and renovation Painting, low VOC Pest control Shipping/receiving, loading dock Environmental Tobacco Smoke Try to minimize sources, change to times when the building is sparsely populated, appropriate supervision of procedures such as pest control. 7 29

257
Communicate with Occupants
To prevent IAQ problems To get cooperation once a problem occurs Communication goes a long way towards alleviating fears. If employees do not know what is being done about a problem they will assume nothing or a cover-up is occurring. 8 30

258
Establish IAQ Complaint Procedure
Always take complaints seriously Checklist to verify implementation Follow-up on complaints Assign each complaint to a person for follow-up and check to see what was discovered during the investigation. 9 31

Similar presentations


>")


 and Its Impact upon Building Occupants Andrew Burgie, MS Center for Occupational & Environmental Health at Hunter College.>")

>")

 March 2009 UCOP Safety Meeting.>")


