Download presentation
Presentation is loading. Please wait.

1
Ultrasound, not just your daddy leak detector anymore.
SDT Ultrasound Solutions What Industry Listens To Ultrasound, not just your daddy leak detector anymore. Presented by Paul Klimuc

2
earlier in the failure curve.
Defect Detection 101 The benefit of ultrasonic is that the energies produced are detectable much earlier in the failure curve.

3
P-F Interval P Condition F Time

4
P-F Interval P Ultrasound Vibration Condition Infrared F Time

5
Static Condition Indicators
RMS Max RMS Peak Crest Factor

6
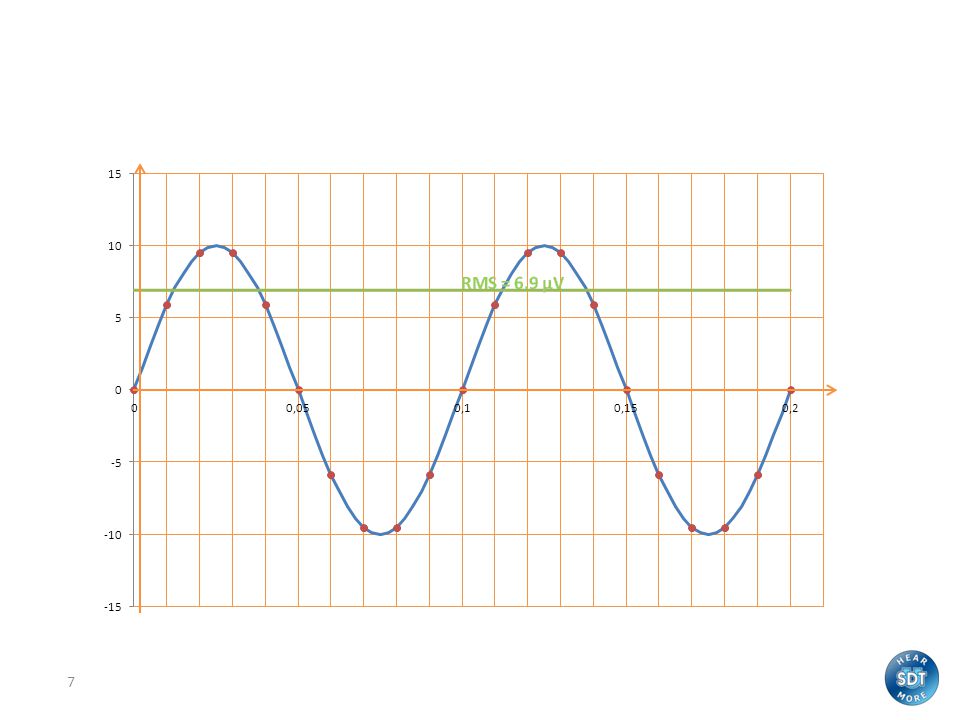
What is RMS? Acronym for Root Mean Square
Reflects the amount of energy present Physical unit (we use): dBµV
: dBµV.")
8
RMS: advantages/disadvantages
Positive: Stable Repeatable Suited for trending Negative: Insensitive to short duration events So not suited to early stage impact detection Welcome everyone to the webinar and introduce the 3 key takeaways.

9
Max RMS: advantages/disadvantages
Positive: Stable and repeatable Comparison with RMS: steady or varying signal Suited for trending Negative: Insensitive to early stage impact detection Welcome everyone to the webinar and introduce the 3 key takeaways.

10
What is Peak? The highest value detected in the time signal
Physical unit used: dBµV The Sampling Rate is 8K.

11
Peak : advantages/disadvantages
Positive: Very sensitive to any change Suited for impact detection Negative: Not going to be repeatable, by the very nature of infrequent transients Trends difficult to interpret Welcome everyone to the webinar and introduce the 3 key takeaways.

12
What is Crest Factor? The Peak-to-RMS ratio Crest Factor = Peak / RMS
No physical unit – it is a numeric ratio Indicates how Peaky the signal is or how many impacts/RMS

13
What is Crest Factor? RMS value is 20dBµV Peak is 40dBµV
Crest Factor could be expressed in dB’s 40-20=20dB Crest Factor is expressed in linear numbers Crest Factor is 10 40dBµV = 100µV, 20dBµV = 10µV Crest Factor is 100/10= 10

14
Condition indicators A guide to choosing RMS Max RMS Peak
Crest Factor Leak Steam traps Lubrication Mechanical Electrical Welcome everyone to the webinar and introduce the 3 key takeaways.

15
Condition indicators A comparison guide Positive Negative RMS Stable
Repeatable Trending Insensitive to short duration events Not suited for early stage bearing failure Max RMS Steady or fluctuating signal (vs. RMS) Peak and Crest Factor Very sensitive to any change Suited for bearing failure Not stable and repeatable Not suited for trending Welcome everyone to the webinar and introduce the 3 key takeaways.
 Peak and Crest Factor. Very sensitive to any change. Suited for bearing failure. Not stable and repeatable Not suited for trending. Welcome everyone to the webinar and introduce the 3 key takeaways.")
16
Benefits Combining the 4 condition indicators:
Better view of machinery health or performance (steam traps, mechanical) Better evaluation of the failure severity (lubrication, mechanical, traps) Better diagnosis capabilities (lubrication vs bearing failure) Early stage detection (mechanical) Welcome everyone to the webinar and introduce the 3 key takeaways.
 Better evaluation of the failure severity (lubrication, mechanical, traps) Better diagnosis capabilities (lubrication vs bearing failure) Early stage detection (mechanical) Welcome everyone to the webinar and introduce the 3 key takeaways.")
17
Condition indicators and UAS
UAS handles each indicator separately Select whichever you want for trend display Alarms are set up individually for each (3 Absolute, 4 Relative, 2 Safe) x 4 = 36 alarms
 x 4 = 36 alarms.")
18
Condition indicators and UAS
Simplicity for those who want Elaborate for those who need Welcome everyone to the webinar and introduce the 3 key takeaways.

19
Slow Speed Bearings

20
Slow Speed Condition Monitoring
Rotating Machinery Slow Speed Condition Monitoring Difficult with some technologies Ultrasound does not need 1 minute

21
Ferris Wheel Feng Shui A Singapore Flyer
Spindle bearing measurements taken one month after rotational direction changed (Feng Shui) 37 minutes for one rotation RPM A
 37 minutes for one rotation RPM. A.")
22
Special Applications – Hoist Bearing
Rotating Machinery Special Applications – Hoist Bearing Doesn’t operate long enough for some tech. 14 RPM but for 10 or 20 seconds only BPFI expected at 2.88Hz/173CPM

23
Time Signal Time Signal Impacts can be seen clearly

24
Expand any area of this time signal Apply a periodic cusor
You get a repetition frequency of 346cpm 2x the inner race defect frequency (173cpm)
")
25
Inner Race Defect Discovered
Rotating Machinery Inner Race Defect Discovered Spalling across the length of the raceway

26
Bearing failure example
Healthy bearing: RMS = 24.4 dBµV, Peak = 43.1 dBµV, CF = 8.6 Welcome everyone to the webinar and introduce the 3 key takeaways.

27
Bearing failure example
Defective bearing: RMS = 47.7 dBµV, Peak = 75.4 dBµV, CF = 21.9 Welcome everyone to the webinar and introduce the 3 key takeaways.

28
What’s the problem? Over lubrication is A huge killer of bearings
Consumes far too much grease Consumes far too much time Reduces reliability

29
Applications Lubrication: Lubrication is friction
Correctly greased: regular and pleasant signal (low RMS value) Under or over greased: friction, and so signal is increasing RMS is the suited indicator, throw in Peak to detect possible early stage damage Welcome everyone to the webinar and introduce the 3 key takeaways.
 Under or over greased: friction, and so signal is increasing. RMS is the suited indicator, throw in Peak to detect possible early stage damage. Welcome everyone to the webinar and introduce the 3 key takeaways.")
30
The horror stories

31
Lubrication example Healthy bearing being lubricated:
Correctly greased: RMS = 51.2 dBµV Under-greased: RMS = 57.8 dBµV Welcome everyone to the webinar and introduce the 3 key takeaways.

32
On-condition lubrication
Bearing needed grease:

33
On-condition lubrication
Bearing already overgreased:

34
On-condition lubrication
Using trending:

35
Using an accelerometer
Vibration Ultrasound Imaging Thermal Oil Analysis Motor Current Analysis

36
Keeping it simple The 270 has IR temperature measurement
But it is not an IR camera The 270 has vibration measurement But it is not a vibration data collector That’s not the intention

37
Using an accelerometer
Adds one extra tool to the powerful SDT270 Means that users can make diagnosis that bit easier Don’t need to go back to office to change tools Don’t need to ask somebody else to do it

38
What can I measure? Velocity in ips or mm/s 10-1,000Hz
Acceleration in g 10-10,000Hz RMS and Peak calculated Dynamic measurement (Time) of both now possible with the Raw option instead of Ht. All options controlled inside UAS Sensor Options Supports 100mV/g ONLY
 of both now possible with the Raw option instead of Ht. All options controlled inside UAS Sensor Options. Supports 100mV/g ONLY.")
39
This should get your attention

40
Electrical Applications
Use ultrasound to find electrical faults Arcing Tracking Corona Special areas Flow Loose part monitoring

41
Find it, Fix it, Check it Measurement Cycle BEFORE CLEANING
AFTER CLEANING

43
Valve Inspections 1. Do a comparison method before and after the valve. OR 2. Contact the valve and listen.

44
Valves and Hydraulics Find internal leakage and passing valves
Perform inspections without disassembly Save hours or even days from complicated repairs Ultrasonic Inspection of Hydraulics: Place contact sensor on valve body and wait for system to cycle. Ultrasound will tell you that the valve is passing or stuck in shut position.

45
Valve Body Inspection Checking valve for flow Upstream and downstream
Works for any gas or liquid

46
Valve Inspections Identify the difference between a closed and 10% open 60cm bypass recycle valve Dynamic measurements captured downstream Time signals identically scaled Valve closed Valve opened 10%

47
Steam Trap example Good trap:
Max RMS (43.3 dBµV) is higher than RMS (29.7 dBµV) Peak (51.7 dBµV) RMS Max RMS Welcome everyone to the webinar and introduce the 3 key takeaways.
 is higher than RMS (29.7 dBµV) Peak (51.7 dBµV) RMS. Max RMS. Welcome everyone to the webinar and introduce the 3 key takeaways.")
48
Trap example Failed closed: RMS is low (9.4 dBµV)
Max RMS (11.5 dBµV) is close to RMS RMS Max RMS Welcome everyone to the webinar and introduce the 3 key takeaways.
 is close to RMS. RMS. Max RMS. Welcome everyone to the webinar and introduce the 3 key takeaways.")
49
Trap example Failed open: RMS is high (39.5 dBµV)
Max RMS is close to RMS (41.9 dBµV) RMS Max RMS Welcome everyone to the webinar and introduce the 3 key takeaways.
 RMS. Max RMS. Welcome everyone to the webinar and introduce the 3 key takeaways.")
50
THANKS!

Similar presentations


 Structural Health Monitoring (SHM) a joint lecture for MECH 512: Design for Structural Integrity MECH 513: Smart Materials.>")


>")


