Download presentation
Presentation is loading. Please wait.

1
Star Marketing Spend Effectiveness
Students Kent Van Horn Dan Schwartz TVS Mentors Sourav Das K Subramanian NV Saikumar Krannert Faculty Suresh Chand, PhD

2
Who Are We? Kent Van Horn Kent is a junior economics student at the Krannert School of Management. He is also majoring in Management. Dan Schwartz Dan has completed his first year of the MBA program at the Krannert School of Management. His Concentration is in operations. Previously, he worked as a project manager at General Electric and as a consultant at Total Quality Logistics, a 3rd party logistics provider.

3
Lets Look at the Agenda…
Industry Analysis Traffic vs Retail Sales Head Effectiveness Problem Indore Recommendation

4
What is the Problem? StaR Sales Decline
Average of 500 less sales per month for the last 3 years Unclear Effect of Promotion Many different promotion methods used Results of promotions unclear

5
Two Wheeler Economy Segment

6
Agenda Industry Analysis Traffic vs Retail Sales Head Effectiveness
Problem Indore Recommendation

7
Marketing Microenvironment
Customer Mass market economy Favors fuel economy Finances Competitors Hero Honda Bajaj Collaborators Dealers Suppliers Company Largest volume product for TVS 35-40 thousand sold per month

8
Economy Segment Marketing Mix
Product Star City TVS Sport Price Rs. 36,000 onwards ex showroom Rs. 34,000 onwards ex showroom Placement Retail Dealers Sub-Dealers Promotion Many Sales Promotions Discounts, Rebates 10+ Advertising Schemes ATL-TV, Print, Radio BTL- Demos, Activations

9
Market Segmentation Economy Segment <40,000 Rs ex showroom
15-49 years old 2 million bikes per year Decreased in due to economy Increasing again in 2010 Buy Decision Price Fuel efficiency High durability Specs not important

10
Who is Our Target Group? TVS StaR City Male, 25-35 Married Self employed SEC BCD TVS Sport Male, 20-30 Unmarried Salaried/Self employed(2nd Generation) Key Takeaway: TVS Sport targets a younger, wealthier market
 Key Takeaway: TVS Sport targets a younger, wealthier market.")
11
Situation/Opportunity Analysis
Strengths Brand awareness Reliability TVS brand name Weaknesses Price point Fuel economy Limiting design Price conscious consumers Opportunities Sell on reliability Differentiate from competitors Threats Quality not perceived by customers

12
Macro-Environment Environment Economic Tightening Lending Policies
Threat Opportunity Economic Tightening Lending Policies Growing Middle Class Demographic Socioeconomic Shift Uniqueness Target Political / Legal Environmental Regulation Government Incentives Technological Obsolescence, Alternative Power Incremental Product Modification Sociocultural Demand for Cars Dissatisfaction with Public Transit Global Joint Venture or Import Export trade with Pakistan

13
Market Analysis Key Takeaway: Concentrated market with few players
Hero Honda Splendor Reliability Undifferentiated CD Deluxe Value Bajaj Platina Fuel Efficiency TVS Star City Toughness Lasts a while Sport Sporty Key Takeaway: Concentrated market with few players

14
Market Analysis CD Deluxe Splendor Star City Plantia Sport Key Takeaway: TVS products are differentiated in this segment

15
Agenda Industry Analysis Traffic vs Retail Sales Problem Indore
Head Effectiveness Problem Indore Recommendation

16
Look at the Distribution Channel
TVS Dealer Customer (Urban) 30% Sub-dealer Customer (Rural) 70% Margin split 50/50 between dealer and sub-dealer
 30% Sub-dealer. Customer. (Rural) 70% Margin split 50/50 between dealer and sub-dealer.")
17
Comparing Retail Sales Vs. Traffic
Key Takeaway: Retail Traffic and Sales are closely related.

18
Agenda Industry Analysis Traffic vs Retail Sales Problem Indore
Head Effectiveness Problem Indore Recommendation

19
Head Effectiveness Regional spend compared to sales: Correlation = R2 Highly correlated spends have highest effect Y=m x+b Positive m values indicate sales increase Negative m values indicate sales decrease Both advertising and promotion

20
Brand vs Promotion

21
Brand vs Promotion

22
Weighted Sales Method to compare sales:
Weighted Sales = 0.5 x Month n Sales + Month (n+1) Sales x Month (n+2) Sales x Month (n+3) Sales
 Sales x Month (n+2) Sales x Month (n+3) Sales.")
23
West Bengal Regression Analysis
Key Takeaway: Print, advertisements, demos and hoardings appear to increase sales. There is a strong correlation between all India sales and West Bengal. Too many variables makes a difficult to use model.

24
What About Tamil Nadu? SUMMARY OUTPUT Regression Statistics Multiple R R Square Adjusted R Square Standard Error Observations 8 ANOVA df SS MS F Significance F Regression 2 Residual 5 Total 7 Coefficients t Stat P-value Lower 95% Upper 95% Lower 95.0% Upper 95.0% Intercept E-05 Weighted TV E-05 E-05 Press E-05 Sales = x Weighted TV Spend x Press Key Takeaway: For every 1500 Rs. Spent on press, TVS can expect one additional sale. Combining variables leads to a cleaner model.

25
Purdue Item Indian Foreigner Dan Taj 20 750 N/A Rickshaw 30 90 150
Spice Flaming Mild Ketchup Food Naan Rice McDonald's Travel Bus Honda Civic Drink Tea Coffee Beer

26
Opportunity Breakdown
Key Takeaway: TVS Star City and Sport are Economically Inferior goods that decrease in sales in wealthier areas. There are some areas where there is opportunity for more sales.

27
Opportunity Breakdown
Delhi Key Takeaway: 73.2% of the sales in TVS City can be explained by its linear relationship with total market segment sales during that month. For every 9 products the market increases, 1 TVS City sale is expected.

28
Opportunity Breakdown
Key Takeaway: Uttar Pradesh, West Bengal and Andhra Pradesh all have very high potential for future sales.

29
India Promotion Regression
Diwali

30
India Advertising Regression

31
Agenda Industry Analysis Traffic vs Retail Sales Problem Indore
Head Effectiveness Problem Indore Recommendation

32
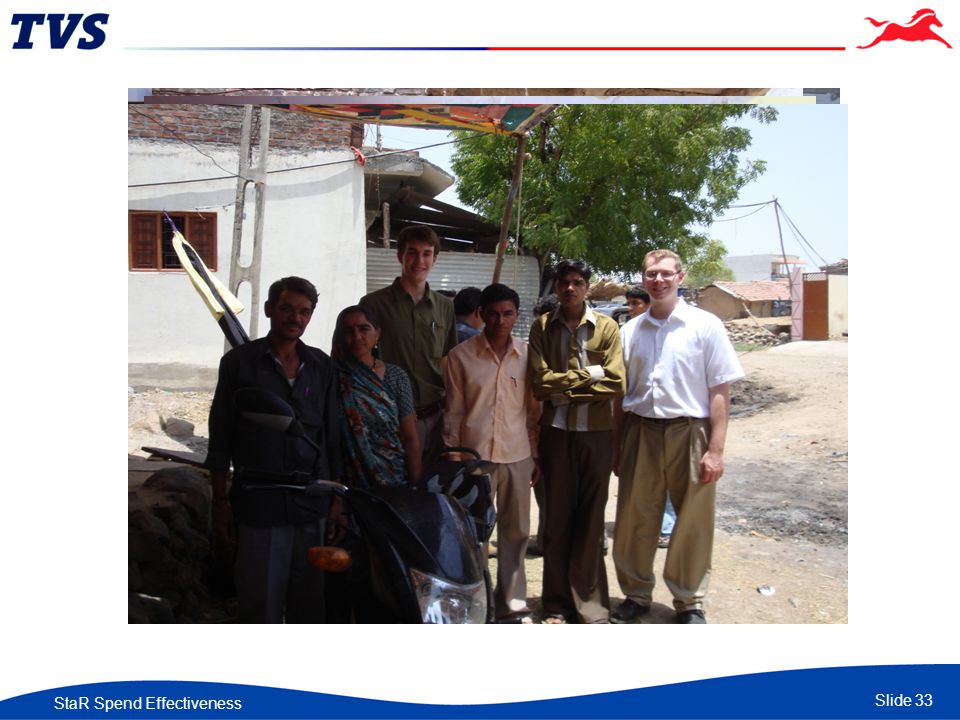
Primary TVS Dealership
Our Trip to Indore! Field Study to Indore Indore Consumer Sub-dealership Primary TVS Dealership

34
Indore Consumer Feedback
House 1 House 2 House 3 Which bike do you own? Splendor StarCity Why this bike? Mileage, road presence Mileage, max load Mileage, bad TVS experience What adds have you seen for Star City? TV: Cricket Star, MS Dhoni Print: Paper and Magazines TV: Cricket Star, MS Dhoni heavily influenced Print: Paper and Magazines Print: Paper and Magazines What do you think of the promotional gifts? Good, but not enough to influence decision Liked them, but not ecstatic about them Not impressed Key Takeaway: Customer perceived mileage is key.

35
Diwali>Wedding Season
Sub-Dealer Store Traffic? 6-7/day Average Sales? 52/month, 62 YTD Pay Cash First Visit? 25% What Impacts Sales? Diwali>Wedding Season Is Price a Factor? TVS Fixes Prices Star City Sales? 75-80% Stockout Loss? 2-4/month

36
TVS Primary Dealership
Customer Service Greeted within 1 minute Follow up calls Green/Pink cards Repairs 300 Rs. Profit per bike repair repairs per day 10-20 service bays

37
Misaligned Priorities?
Top 3 Features that Affect Purchase Intent Party Primary Secondary Tertiary Consumer 1 Mileage Road Presence Power Consumer 2 Maintenance Max Load Consumer 3 Sub-Dealer Strong Sturdy TVS Primary Dealer Looks/Image Brand Key Takeaway: Customer perceived mileage is key although dealers focus on other selling points.

38
Summarizing Our Findings
Sales based on perception Wedding season increases sales Sub-dealer closer to customer Customer needs misunderstood

39
Agenda Industry Analysis Traffic vs Retail Sales Problem Indore
Head Effectiveness Problem Indore Recommendation

40
Recommendations Untapped Markets (West Bengal) Increase Spend
Sponsor Dealerships Too Many Advertising Heads Used Reduce Number Increase Demos Consumer Perception Educate Consumer Below the Line

41
Recommendations Improved Customer Perception Capture Untapped Markets
Improved Head Selection Increased Sales

43
TVS StaR Targets SEC-BCD

Similar presentations


 Simplified>")


