Download presentation
Presentation is loading. Please wait.

1
Building Brains and Futures: One Connection at a Time
Robbin Gibb LaVonne Rideout

2
Nature/ Nurture No longer a debate Environment leaves its mark on our genome and can modulate future gene expression in a sometimes heritable fashion The study of how environment leaves its footprint on the genome falls into the domain of Epigenetics Harry Harlow -early work on surrogate mothers

3
It was long believed that DNA methylation is fixed and irreversible
Each gene contains a unique set of instructions that is carried out if endorsed (signed) by the environment. This is what is known as the “signature effect” The programming of the genome is controlled by the epigenome The epigenome is composed of two components: 1) the chromatin which is associated with the DNA and 2) DNA methylation which is part of the covalent structure of the genome and is therefore a stable long-term signal It was long believed that DNA methylation is fixed and irreversible
 by. the environment. This is what is known as the signature effect The programming of the genome is controlled by the epigenome. The epigenome is composed of two components: 1) the chromatin which is associated with the DNA and. 2) DNA methylation which is part of the covalent structure of the genome and is therefore a stable long-term signal. It was long believed that DNA methylation is fixed and irreversible.")
4
Brain and Human Development
Nature Nurture Genes Epigenetics Stimulation & Nutrition Gene Function Neurobiological Pathways Physical Mental Behaviour Learning & Health Health Cognition

6
Building Better Brains
The process of building a healthy brain is influenced by a wide range of factors, particularly the first 2000 days from conception - A strong foundation Protection from toxic stress Strong “air traffic control” Skills SERVE AND RETURN*

7
Top Three Factors to Promote Brain Development
1. Attachment & Relationships (SERVE & RETURN) 2. Build EF (AIR TRAFFIC CONTROL) 3. Manage Stress (AVOID TOXIC STRESS)
 2. Build EF (AIR TRAFFIC CONTROL) 3. Manage Stress (AVOID TOXIC STRESS)")
8
By Stanley Greenspan and Terry Brazelton Identify 7 NEEDS of children
The Irreducible Needs of Children: What Every Child Must Have to Grow, Learn, and Flourish By Stanley Greenspan and Terry Brazelton Identify 7 NEEDS of children Physical protection, safety, regulation Experiences tailored to Individual difference Developmentally appropriate experience Limit setting, Structure, and Expectations Stable, Supportive communities and Cultural continuity Protecting the future

9
NUMBER 1 NEED? NEED FOR ONGOING, NURTURING RELATIONSHIPS

10
Top Three Factors to Promote Brain Development
1. Attachment & Relationships (SERVE & RETURN) 2. Build EF (AIR TRAFFIC CONTROL) 3. Manage Stress (AVOID TOXIC STRESS)
 2. Build EF (AIR TRAFFIC CONTROL) 3. Manage Stress (AVOID TOXIC STRESS)")
11
Success Requires: Creativity Flexibility Self-Control Discipline
All of these qualities are “executive functions” supported by the PFC -EF’s are more important for school readiness than IQ -EF’s are trainable as early as the first year of life

12
Even small improvements in EF can translate into
Children with worse self-control (EF) at ages 3-11 (stress, loneliness, not physically fit): Have worse health outcomes Earn less Commit more crimes in the ensuing 30 years (studies controlled for IQ, Gender, and SES) Even small improvements in EF can translate into improvements in health, wealth, and lower crime rate for a nation( Moffitt et al. PNAS 2011) .
 at ages 3-11 (stress, loneliness, not physically fit): Have worse health outcomes. Earn less. Commit more crimes in the ensuing 30 years. (studies controlled for IQ, Gender, and SES) Even small improvements in EF can translate into. improvements in health, wealth, and lower. crime rate for a nation( Moffitt et al. PNAS 2011) .")
13
Top Three Factors to Promote Brain Development
1. Attachment & Relationships (SERVE & RETURN) 2. Build EF (AIR TRAFFIC CONTROL) 3. Manage Stress (AVOID TOXIC STRESS)
 2. Build EF (AIR TRAFFIC CONTROL) 3. Manage Stress (AVOID TOXIC STRESS)")
14
Early Experience alters stress axis
TOXIC STRESS Positive or Tolerable STRESS Development of Stress Reactivity Prenatal Stress in lab animals Frontal cortex - 20% smaller cells, deficits on spatial navigation deficits in play behavior Once again, frontal lobe development can be profoundly altered in ways that must interact with later behavior… Modest Stress Reactivity Reduced Risk for Disease Increased Stress Reactivity Increased Risk for Heart Disease, Type II Diabetes, Alcoholism, Affective Disorders, Brain Aging etc.

15
Felletti : Turning Gold into Lead
ACE (adverse childhood experience) study >17,000 middle aged adults in California ACE’s are more common than previously thought and have a powerful effect on mental and physical health later in life Frontal lobe development is particularly sensitive
 study. >17,000 middle aged adults in California. ACE’s are more common than previously thought and have a powerful effect on mental and physical health later in life. Frontal lobe development is particularly sensitive.")
16
And what are Adverse Childhood Experiences ?
Emotional abuse Physical abuse Sexual abuse Mother treated violently Household use of drugs or alcohol Presence of mental illness Parental Separation or Divorce Incarcerated household member

17
OUTCOMES SCALE Positive Sturdy foundation Air traffic control
Negative Positive Positive Sturdy foundation Toxic stress Air traffic control Serve and Return

18
Pay it forward Neuroeconomists tell us that return on investment at this time of life ( preschool) is greater than at any other time in human development Generations to come can benefit from early childhood investment such as this
 is greater than at any other time in human development. Generations to come can benefit from early childhood investment such as this.")
19
Two Key Ways to Make a Difference
1. Prevention- by providing children and families with support we can avoid many situations that undermine brain development 2. Ingenuity- we can use our knowledge about brain development and learning to provide experience that will maximize learning in children

20
Building Adult Capability

21
How are Lethbridge’s young children doing? What the research tells us
Slide: ECMap final research findings on early childhood development in Alberta This presentation summarizes ECMap’s final research findings on early childhood development in Alberta. The results are based on five years of research (from 2009 to 2014), which was conducted by ECMap as part of the Government of Alberta’s Early Child Development Mapping Initiative. The initiative launched the first population-based study of young children across Alberta. So how are our young children doing? © 2015 Early Child Development Mapping Project (ECMap) Presented to: SACPA Presented by: La Vonne Rideout and Dr. Robbin Gibb Date: February 19, 2015 © 2015 Early Child Development Mapping Project
, which was conducted by ECMap as part of the Government of Alberta’s Early Child Development Mapping Initiative. The initiative launched the first population-based study of young children across Alberta. So how are our young children doing © 2015 Early Child Development Mapping Project (ECMap) Presented to: SACPA. Presented by: La Vonne Rideout. and Dr. Robbin Gibb. Date: February 19, © 2015 Early Child Development Mapping Project.")
22
Working together in Alberta
This chart provides an overview of the partnerships that make up Alberta’s Early Child Development Mapping Initiative. The five-year initiative was launched and funded by Alberta Education. ECMap, which is based at the University of Alberta, was commissioned to: research on early childhood development in Alberta, and support coalitions in using the data and promoting positive early development in their communities. Coalitions were formed from a broad cross-section of community leaders and members, who either work with and/or are passionately concerned about young children and families. Coalitions work with ECMap and the ECD Mapping Initiative, but they are independent bodies and represent their communities. © 2014 Early Child Development Mapping Project (ECMap)
")
23
Putting together the data
Community Maps and Reports Socio- Economic Status Community Resources Putting together the data Information for the study of early childhood development has been collected from three sources and reported at the community, subcommunity and provincial levels. Early Development Instrument (EDI) data is collected by kindergarten teachers on the development of young children in their classes. Socio-economic data is gathered using Statistics Canada census information. Information on community resources that relate to young children and families has been collected and mapped with the help of coalitions themselves. EDI data provides information about how young children are actually developing. Socio-economic data and information on community resources provide a context for the EDI data by looking at important environmental factors that shape early development. © 2014 Early Child Development Mapping Project (ECMap) EDI
 data is collected by kindergarten teachers on the development of young children in their classes. Socio-economic data is gathered using Statistics Canada census information. Information on community resources that relate to young children and families has been collected and mapped with the help of coalitions themselves. EDI data provides information about how young children are actually developing. Socio-economic data and information on community resources provide a context for the EDI data by looking at important environmental factors that shape early development. © 2014 Early Child Development Mapping Project (ECMap) EDI.")
24
ECD communities in Alberta
Edmonton Calgary [Optional slide] ECD communities in Alberta One of the first tasks undertaken by coalitions was to map their community boundaries. In Alberta, there are many different kinds of boundaries, including provincial and federal constituency boundaries, and boundaries for school districts, health authorities, libraries, municipalities and Family and Community Support Services (FCSS). There are however, no common community boundaries. As a result, communities, working through their coalitions had to establish their geographic areas first, before data on early development could be analyzed and reported locally. One hundred early childhood development or ECD communities were identified in Alberta. The communities cover the entire land area of the province. This map provides you with some idea of how the province has been divided up into communities. *Due to the small scale of this map, not all the communities could be represented. © 2014 Early Child Development Mapping Project (ECMap) ECD communities in Alberta
. There are however, no common community boundaries. As a result, communities, working through their coalitions had to establish their geographic areas first, before data on early development could be analyzed and reported locally. One hundred early childhood development or ECD communities were identified in Alberta. The communities cover the entire land area of the province. This map provides you with some idea of how the province has been divided up into communities. *Due to the small scale of this map, not all the communities could be represented. © 2014 Early Child Development Mapping Project (ECMap) ECD communities in Alberta.")
25
Coalitions provide unique input
100 mobilized throughout Alberta established community boundaries in a province where there are no common boundaries provided an equal voice at the table for all sectors in the community contributed to research and put the data to work Slide: Coalitions provide unique input Coalitions played an instrumental role throughout the project. One of their first tasks was to define the geographic areas of their communities and map their boundaries. This was an enormously important task in Alberta where there are no common boundaries. Coalitions then built their membership base by inviting different sectors of the community on board. The idea was to provide an equal voice for all community members who wished to participate. Coalitions made an important contribution to the data that was collected, including identifying and mapping community resources. They also helped to interpret research results. Coalitions engaged non-profit service providers, government, businesses, school authorities and parents in responding to the data and planning for improved supports for their young children and families. In many communities, this marked the first time a broad cross-section of the community came together to directly address issues related to young children’s well-being.

26
Slide: Who sits on coalitions
This chart shows the ten sectors that are most frequently represented at coalition tables. The percentages on left hand side relate to the percentages of coalitions. The sectors that have been involved in coalitions the most are: health, schools, parents and community members, libraries, Parent Link centres, family support organizations, Family and Community Support Services (FCSS), early childhood development programs, child care centres and municipalities and towns. Sectors that have also been involved in coalitions and are not shown on this chart include literacy organizations, playschools, Child and Family Services (CFS), mental health, post-secondary institutions, elected officials, recreation programs and business. This represents a considerable investment of volunteer time to the community. Coalition members volunteer an estimated 40,000 hours per year in meeting time alone. This is a conservative estimate that does not include the time spent organizing community events or doing subcommittee work. Adapted from ECMap’s Final Report.
, early childhood development programs, child care centres and municipalities and towns. Sectors that have also been involved in coalitions and are not shown on this chart include literacy organizations, playschools, Child and Family Services (CFS), mental health, post-secondary institutions, elected officials, recreation programs and business. This represents a considerable investment of volunteer time to the community. Coalition members volunteer an estimated 40,000 hours per year in meeting time alone. This is a conservative estimate that does not include the time spent organizing community events or doing subcommittee work. Adapted from ECMap’s Final Report.")
27
The EDI Population-based measure
Surveys how children are doing in communities and across Alberta Not about individual children Questionnaires filled out by kindergarten teachers The EDI The EDI was developed by the Offord Centre for Child Studies at McMaster University in Hamilton, Ontario. It has been widely used across Canada, as well as in Australia and the U.S. and many other countries, since 2000. The EDI is a population-based measurement, much like a census. Children are not identified individually. Questionnaires are completed for each child by kindergarten teachers usually in the early spring after they’ve had an opportunity to get to know their students. Teachers are trained in using the questionnaire beforehand. In Alberta, parents fill out consent forms for their children to participate. © 2014 Early Child Development Mapping Project (ECMap)
")
28
EDI: 2009 to 2013 gathered twice by 135 school authorities
approximately 1,100 schools involved 86,564 questionnaires collected; 70,206 questionnaires usable two rounds collected in each community and merged to form baseline results EDI: 2009 to 2013 Collecting EDI data over the past five years (2009 to 2013) has been a tremendous undertaking. 135 school authorities collected EDI data twice in this period, choosing which years to opt in. 1,100 schools participated. Questionnaires were filled out and collected on more than 86,500 kindergarten-aged children. Of these, 70, 206 were usable. The others could not be used because: there was no parental consent, data was missing or incomplete on the questionnaires, children were diagnosed with severe disabilities,* children were in class for less than a month, and were younger than 4 or older than 7. Two rounds of data were collected in each community and merged to form baseline results, that can be used as a basis for comparison in future. *EDI information for children with diagnosed severe disabilities will be reported separately. For more information on the criteria for analyzing and reporting EDI results, please go to pages I-12 and I-13 of the Introduction of the Community profiles of early childhood development in Alberta report. © 2014 Early Child Development Mapping Project (ECMap)
 has been a tremendous undertaking. 135 school authorities collected EDI data twice in this period, choosing which years to opt in. 1,100 schools participated. Questionnaires were filled out and collected on more than 86,500 kindergarten-aged children. Of these, 70, 206 were usable. The others could not be used because: there was no parental consent, data was missing or incomplete on the questionnaires, children were diagnosed with severe disabilities,* children were in class for less than a month, and. were younger than 4 or older than 7. Two rounds of data were collected in each community and merged to form baseline results, that can be used as a basis for comparison in future. *EDI information for children with diagnosed severe disabilities will be reported separately. For more information on the criteria for analyzing and reporting EDI results, please go to pages I-12 and I-13 of the Introduction of the Community profiles of early childhood development in Alberta report. © 2014 Early Child Development Mapping Project (ECMap)")
29
EDI categories Developing appropriately: Experiencing difficulty:
most or all developmental skills appropriate by kindergarten; above the 25th percentile or top 75 per cent Experiencing difficulty: probable delays in some areas of development; between the 10th and 25th percentile [optional slide] EDI categories Children’s EDI results are described according to three categories. The cutoffs for each category are based on Canadian norms: Developing appropriately: Includes scores that reflect most or all of developmental skills and abilities usually demonstrated by kindergarten. Children who are developing appropriately score above the 25th percentile and are in the top 75 per cent compared to other children in Canada. Experiencing difficulty: Includes scores that indicate probable delays in some areas of development. Children who are experiencing difficulty score between the between the 10th and 25th percentile on the EDI compared to other children in Canada. Experiencing great difficulty: Includes scores that suggest significant delays in development. These children score below the 10th percentile or in the bottom 10 per cent on the EDI compared to other children in Canada. Note: Cutoffs are set according to Canadian norms for the EDI established by the Offord Centre using data on more than 175,000 Canadian children. © 2014 Early Child Development Mapping Project (ECMap) Experiencing great difficulty: significant delays in development; below the 10th percentile or bottom 10 per cent
 Experiencing great difficulty: significant delays in development; below the 10th percentile or bottom 10 per cent.")
30
Five areas of development
Alberta: Five areas of development Let’s take a look at EDI results for Alberta first. These pie charts show EDI results in each of the five areas of development. The green areas in the pie charts show the percentage of children that are developing appropriately in that particular area of development. In physical health and well-being for example, we see that nearly 76 per cent of children are developing appropriately. What percentage of children are developing appropriately in each of the other areas? Approximately three quarters of kindergarten-aged children are developing appropriately in four areas of development: physical health and well-being, social competence, emotional maturity, and language and thinking skills. Nearly a third — 31 per cent — are experiencing difficulty or great difficulty in communications skills and general knowledge. This area appears to be the biggest challenge across the province. Now let’s look at the percentages of children who are experiencing great difficulty in each of the five areas of development. That’s the orange area in the pie charts. What percentage of children are experiencing great difficulty in each area of development. © 2014 Early Child Development Mapping Project (ECMap) June 2014 (Updated) 70,206 questionnaires Please note: Percentages may not always add up to exactly 100% due to rounding or missing data. Alberta EDI results ( ), ECMap
 June 2014 (Updated) 70,206 questionnaires. Please note: Percentages may not always add up to exactly 100% due to rounding or missing data. Alberta EDI results ( ), ECMap.")
31
Alberta falling behind the Canadian norm
Canada Alberta EDI results ( ), ECMap Slide: Alberta falls behind the Canadian norm As this bar graph shows, young children in Alberta are falling behind the Canadian norm. Nearly 29 per cent are experiencing great difficulty in one or more areas of development in Alberta compared to the Canadian norm of 25.4 per cent. 14.7 per cent are experiencing great difficulty in two or more areas of development as compared to the Canadian norm of 12.4 per cent. An important thing to keep in mind when talking about the Canadian norm is that the norm does not set a goal that we should be striving for. The Canadian norm shows that more than one in four kindergarten-aged children in Canada – or more than 25 per cent - are struggling in their development. Great difficulty in ONE or more areas of development Great difficulty in TWO or more areas of development
, ECMap. Slide: Alberta falls behind the Canadian norm. As this bar graph shows, young children in Alberta are falling behind the Canadian norm. Nearly 29 per cent are experiencing great difficulty in one or more areas of development in Alberta compared to the Canadian norm of 25.4 per cent per cent are experiencing great difficulty in two or more areas of development as compared to the Canadian norm of 12.4 per cent. An important thing to keep in mind when talking about the Canadian norm is that the norm does not set a goal that we should be striving for. The Canadian norm shows that more than one in four kindergarten-aged children in Canada – or more than 25 per cent - are struggling in their development. Great difficulty in. ONE or more. areas of development. Great difficulty in. TWO or more. areas of development.")
32
Developing appropriately
73.1% Alberta 46.4% Communities Alberta EDI data ( ), ECMap 16.4% Alberta: Developing appropriately In the previous slide, we looked at the percentage of children who were developing appropriately in each of the five areas of development. Here, we see are looking at the percentage of children who are developing appropriately in all five areas of development. These children would show up green in all five pie charts. Only 46 per cent or less than half of Alberta’s kindergarten-aged children are developing appropriately in all five areas of development measured by the EDI. Results vary a great deal from one community to the next. The percentage of children developing appropriately in all five areas of development ranges from a high of 73 per cent in one community in central eastern Alberta to a low of 16 per cent in another community nearby. Subcommunity results can also vary a great deal. There are wide disparities in early development in Alberta. (Please note: The Offord Centre, which designed the EDI, has not set a national norm for the percentage of children developing appropriately in all five areas.) © 2014 Early Child Development Mapping Project (ECMap) Highest community ALBERTA Lowest community in ALL FIVE areas of development
, ECMap. 16.4% Alberta: Developing appropriately. In the previous slide, we looked at the percentage of children who were developing appropriately in each of the five areas of development. Here, we see are looking at the percentage of children who are developing appropriately in all five areas of development. These children would show up green in all five pie charts. Only 46 per cent or less than half of Alberta’s kindergarten-aged children are developing appropriately in all five areas of development measured by the EDI. Results vary a great deal from one community to the next. The percentage of children developing appropriately in all five areas of development ranges from a high of 73 per cent in one community in central eastern Alberta to a low of 16 per cent in another community nearby. Subcommunity results can also vary a great deal. There are wide disparities in early development in Alberta. (Please note: The Offord Centre, which designed the EDI, has not set a national norm for the percentage of children developing appropriately in all five areas.) © 2014 Early Child Development Mapping Project (ECMap) Highest. community. ALBERTA. Lowest. community. in ALL FIVE areas of development.")
33
Alberta baseline results
Less than half (46 per cent) are developing appropriately in all five areas of development. Nearly 29 per cent experience great difficulty in one or more areas and nearly 15 per cent experience great difficulty in two or more. This does not include children with diagnosed severe disabilities. Slide: Alberta baseline results Baseline results tell us that: Less than half — 46 per cent — of young children are developing appropriately in all five areas of development measured by the EDI. Nearly 29 per cent experience great difficulty in one or more areas of development, and Nearly 15 per cent experience great difficulty in two or more areas of development. This does not include children with diagnosed severe disabilities.* *Note: Children with severe disabilities were not included in the Alberta baseline data because they are not included in the Canadian norm by the Offord Centre, which created the EDI. Out of all the EDI questionnaires that were collected in Alberta, 2.5 per cent – or 2,154 – were for children with severe disabilities.
 are developing appropriately in all five areas of development. Nearly 29 per cent experience great difficulty in one or more areas and nearly 15 per cent experience great difficulty in two or more. This does not include children with diagnosed severe disabilities. Slide: Alberta baseline results. Baseline results tell us that: Less than half — 46 per cent — of young children are developing appropriately in all five areas of development measured by the EDI. Nearly 29 per cent experience great difficulty in one or more areas of development, and. Nearly 15 per cent experience great difficulty in two or more areas of development. This does not include children with diagnosed severe disabilities.* *Note: Children with severe disabilities were not included in the Alberta baseline data because they are not included in the Canadian norm by the Offord Centre, which created the EDI. Out of all the EDI questionnaires that were collected in Alberta, 2.5 per cent – or 2,154 – were for children with severe disabilities.")
34
Lethbridge Early Development Instrument (EDI) baseline results
Source: Early Child Development Mapping Project (ECMap), April 2014
, April")
43
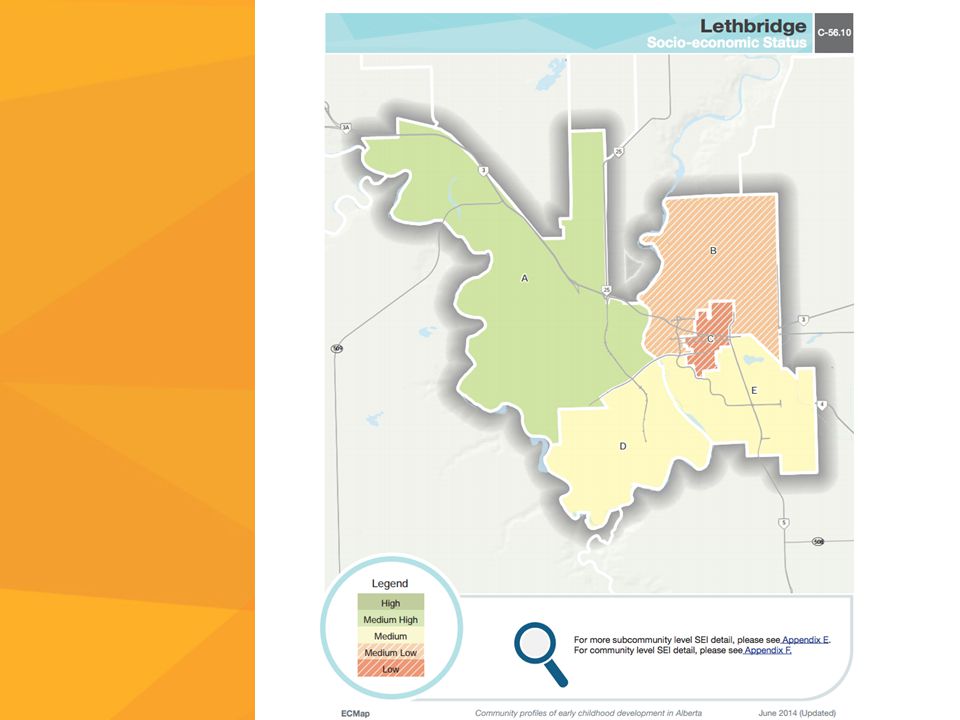
SEI: It’s not just about income
Slide: SEI: It’s not just about income Socio-economic status is defined by much more than just household income. It includes many other things, including the social and cultural conditions in a community. The socio-economic index (SEI), created by ECMap, is made up of five factors. Our research results showed that the economic factor is not always the most significant contributor to SES in communities and subcommunities. Other factors sometimes played a more important role. You can find out more about SEI results by going to the LiveAtlas on ECMap’s website. There you will find interactive maps that provide a breakdown of the SEI at the community and subcommunity level, and for Alberta.* *More information on the SEI can also be found on pages I-15 to I-17 in the Introduction and in Appendix E: Mean scores of the SEI and its factors for the province, communities and subcommunities in the Community profiles report.
, created by ECMap, is made up of five factors. Our research results showed that the economic factor is not always the most significant contributor to SES in communities and subcommunities. Other factors sometimes played a more important role. You can find out more about SEI results by going to the LiveAtlas on ECMap’s website. There you will find interactive maps that provide a breakdown of the SEI at the community and subcommunity level, and for Alberta.* *More information on the SEI can also be found on pages I-15 to I-17 in the Introduction and in Appendix E: Mean scores of the SEI and its factors for the province, communities and subcommunities in the Community profiles report.")
44
The socio-economic connection
Socio-economic status of communities has been related to EDI results. Children generally scored higher on the EDI in communities with positive SEI and lower in communities with lower SEI. Slide: The socio-economic connection Geography did not appear to be a factor in EDI results, as already pointed out. But socio-economics did appear to be connected to community EDI results. Children tended to score higher on the EDI in communities with a positive socio-economic index (SEI) and lower in communities with a low SEI. This was not the case in all communities, however. A number of communities did not conform to this general trend.
 and lower in communities with a low SEI. This was not the case in all communities, however. A number of communities did not conform to this general trend.")
45
Largest # experiencing difficulties found in middle SEI communities
Total number EGD1+ 20,116 Slide: Largest number of children experiencing difficulties found in middle socio-economic communities The socio-economics conditions of a community are linked to EDI results; a larger percentage of children struggle in communities with low SEI, and vice versa. BUT, the largest number of children who are experiencing difficulties are found in middle socio-economic level communities. This graph illustrates this in our EDI results. Out of 20,116 kindergarten-aged children who are experiencing great difficulty in one or more areas of development in Alberta, 16,552 live in middle SEI communities. Why? Overall more children live in middle-class homes and communities. The middle-class predominates in Alberta, and in the rest of Canada.

46
Slide: Resources tied to SEI
23,100+ community resources identified by coalitions and mapped higher socio-economic index (SEI) linked to greater frequency of resources more study needed to understand connection between resources and EDI Slide: Resources tied to SEI Coalitions identified more than 23,100 community resources that relate to young children and families, using a template developed by ECMap. These resources were mapped in the LiveAtlas. A significant connection was found between the socio-economic index (SEI) of communities and the frequency of resources. Communities with a higher socio-economic status were found to have more resources. At this point, no link has been established between the frequency of resources within a community and EDI outcomes, however. A great deal more research needs to be done on the relationship between resources and EDI, including the impact of the quality of resources and how they are used.
 linked to greater frequency of resources. more study needed to understand connection between resources and EDI. Slide: Resources tied to SEI. Coalitions identified more than 23,100 community resources that relate to young children and families, using a template developed by ECMap. These resources were mapped in the LiveAtlas. A significant connection was found between the socio-economic index (SEI) of communities and the frequency of resources. Communities with a higher socio-economic status were found to have more resources. At this point, no link has been established between the frequency of resources within a community and EDI outcomes, however. A great deal more research needs to be done on the relationship between resources and EDI, including the impact of the quality of resources and how they are used.")
47
ECD community resources
include programs and services, informal supports and physical features identified by coalitions total: 23,600 Early childhood development community resources Early childhood development (ECD) community resources can include everything from programs and services (such as daycare centres, libraries, recreational facilities, parks, medical centres and parent resource centres) to more informal supports (strong neighbourhoods networks and extended family) to physical characteristics (such as walkable neighbourhoods and safe, attractive green spaces.) Coalitions worked with the ECMap team to identify and map their community resources. More than 23,600 resources were mapped in Alberta. Coalitions were asked to keep the following question in mind as they did this work: How do the resources that are available in your community support young children and families? © 2014 Early Child Development Mapping Project (ECMap)
 community resources can include everything from programs and services (such as daycare centres, libraries, recreational facilities, parks, medical centres and parent resource centres) to more informal supports (strong neighbourhoods networks and extended family) to physical characteristics (such as walkable neighbourhoods and safe, attractive green spaces.) Coalitions worked with the ECMap team to identify and map their community resources. More than 23,600 resources were mapped in Alberta. Coalitions were asked to keep the following question in mind as they did this work: How do the resources that are available in your community support young children and families © 2014 Early Child Development Mapping Project (ECMap)")
48
Building a strong foundation
A solid foundation The evidence is in: A child’s early brain development – and the early experiences that shape development – build a strong, or weak, foundation for life. Early development also lays the foundation for our communities and society. Positive early development enables our children to reach their potential and grow into healthy, productive, engaged citizens. This in turn paves the way for strong, vibrant communities and a prosperous, sustainable society. We often hear that it takes a village to raise a child. Turn the old proverb around to understand another truth. It also takes a child to raise a village. Early life experiences are critical in building a solid foundation for life. Early Child Development Mapping Project (ECMap) September 2013
 September")
49
Children grow up in an environment of relationships
Families play a primary role. Children grow up in an environment of relationships Although families play a primary role in creating a child’s early environment, other relationships and factors are important too. © 2014 Early Child Development Mapping Project (ECMap)
")
50
Importance of communities
safe, walkable well-designed playgrounds, recreational facilities and green spaces quality, accessible child care and early learning opportunities access to affordable, nutritious food supportive social networks welcoming & inclusive Importance of communities Communities play an important role, including whether: they are safe and walkable, have well-designed playgrounds and recreational facilities, and adequate green spaces, offer quality, accessible child care and early learning opportunities, provide access to affordable, nutritious food, have supportive social networks, and are welcoming and inclusive. © 2014 Early Child Development Mapping Project (ECMap)
")
51
Impact of society comprehensive, accessible health care,
good parental leave policies family friendly employment standards job training and adequate wages, so parents can look after their families high quality early care and learning standards coordinated services for young children and families [Optional slide] Impact of society Social, economic and political factors also affect development. These factors include: comprehensive, accessible health care, good parental leave policies, family friendly employment standards, job training and adequate wages, so that parents can properly support their families, high quality early care and learning standards and training, coordinated services for young children and families. Working together on many levels helps to create the environments and experiences children need to thrive and grow. © 2014 Early Child Development Mapping Project (ECMap)
")
52
Weighing the benefits of positive development
_ + • school success • better jobs • earn more • physically and mentally healthier • stable relationships • better parent • better coping skills • struggle in school • high school dropout • lower paying jobs • acute and chronic illnesses • commit crime • addictions [optional slide] Weighing the benefits of positive development There are many preventative benefits to raising children in safe, nurturing and developmentally rich environments. Children who grow up in positive environments tend to develop better and are more likely to: do well in school, pursue post-secondary education and training, enjoy better health, be able to handle stress and cope with life’s difficulties, form stable relationships, have good parenting skills, and feel good about themselves. They are less likely to: drop out of school or require remedial education programs, experience behavioural issues, commit crimes, suffer from chronic or acute illnesses, such as heart disease, high blood pressure, type 2 diabetes, mental illnesses and depression, become addicted to alcohol or drugs, require social assistance and other income supports, and abuse or neglect their own children. © 2014 Early Child Development Mapping Project (ECMap)
")
53
Why is it important to have data on how young children are doing?
Understanding → Why is it important to have data on how young children are doing? Having good information about how the young children in your community are doing and the factors that are affecting their development can help you to better understand how you can support their positive development. This is particularly important in a province that has the fastest growing preschool population in Canada. © 2014 Early Child Development Mapping Project (ECMap) Action
 Action.")
54
Summary Thousands of young children in Alberta are not reaching their potential. This represents a big loss in a province that has the fastest growing population of preschool children in Canada. All communities have young children who are struggling. Communities care passionately about their children. Slide: Summary What have we learned after five years of research? This is a brief summary of some of ECMap’s key findings.

55
Final Recommendations
Continue to gather EDI data as part of a comprehensive early childhood development (ECD) monitoring system for Alberta Support the continuation of community coalitions in using research data for community and provincial action planning for ECD in AB Ensure healthy, nurturing environments are available for all children regardless of socio-economic status, disabilities, family circumstances, cultural backgrounds or geographic location in the province Slide: Final recommendations cont’d What do you think of these recommendations? Can you think of other strategies that should be implemented at the community level, throughout the province or nationally?
 monitoring system for Alberta. Support the continuation of community coalitions in using research data for community and provincial action planning for ECD in AB. Ensure healthy, nurturing environments are available for all children regardless of socio-economic status, disabilities, family circumstances, cultural backgrounds or geographic location in the province. Slide: Final recommendations cont’d. What do you think of these recommendations Can you think of other strategies that should be implemented at the community level, throughout the province or nationally")
56
Recommendations cont’d
Develop a strategy to increase general knowledge and understanding of ECD in communities across Alberta Establish a provincial secretariat of Human Early Learning and Development with a cross- departmental mandate on ECD Re-examine the current qualifications for professionals in early education and improve knowledge about ECD in related fields Slide: Final recommendations cont’d What do you think of these recommendations? Can you think of other strategies that should be implemented at the community level, throughout the province or nationally?

57
Check out the LiveAtlas
Slide: Find research results on the LiveAtlas You can find out more about EDI results and data on socio-economics and community resources for every community and subcommunity in Alberta on ECMap’s LiveAtlas.

58
Slide: For more information
You can also find more detailed information in the How are our young children doing? series of reports produced by ECMap. The reports are posted on the website. The final report contains recommendations to help Alberta improve its early development outcomes and provide every young child with the positive start in life he or she needs to thrive and succeed.

59
Champion for Children Make Alberta’s Children non-negiotable
To access ECMap’s research data, reports and materials go to

Similar presentations


 in Berkshire Community Partnership Forum February 2014 Sally Murray Head of Children’s Commissioning.>")


 Mapping Project Presentation to the Lethbridge Symposium on Innovative Approaches to Pre-School.>")

