Download presentation
Presentation is loading. Please wait.

1
Environmental Challenges: Overview Facing Industry
(Part III) Monserrat Chairez Llamas Dr. Pedro Medellín Milán Universidad Autónoma de San Luis Potosí Dr. Mahmoud M. El-Halwagi Texas A&M University Process Integration for Environmental Control in Engineering curricula (PIECE)
 Monserrat Chairez Llamas. Dr. Pedro Medellín Milán. Universidad Autónoma de San Luis Potosí. Dr. Mahmoud M. El-Halwagi. Texas A&M University. Process Integration for Environmental Control in Engineering curricula (PIECE)")
2
WASTE QUANTITIES AND LOADS (lbs/day)
PROBLEM STATEMENT Let’s consider a typical refining industry with an average 100,000 bbl/day capacity as the one presented in figure 1 on the next slide. In this process, the largest source of pollutants such as phenol, ammonia and sulfide results from the catalytic cracking unit. Considerable amounts of these components and, high levels of BOD and COD are founded in the oily sour water coming out of the fractionators in the distillation units. The wastewater produced in those sections of the process are loaded to a primary treatment unit (API separator), and the resulting stream shows the following characteristics given Table3.1: PARAMETER WASTE QUANTITIES AND LOADS (lbs/day) Water BOD5 12 000 COD 38 000 Suspended Solids 3 800 Phenols 800 Sulfide 2 600 NH3-N 1 400 Oil 5 300
, and the resulting stream shows the following characteristics given Table3.1: PARAMETER. WASTE QUANTITIES AND LOADS (lbs/day) Water BOD COD Suspended Solids Phenols Sulfide NH3-N Oil")
3
Atmospheric distillation Naphtha NH3, H2S Gas Oils Catalytic Cracking
CO2 NH3 H2S Amine plant Fuel Gas LPG & Light gases Butane Gasoline Gasoline Alkylation Blending Gas plant NH3 H2S H2 Naphtha Desulfurization Catalytic Reforming NH3 H2S Jet Fuel Middle Distillates Treating Kerosene Gas Atmospheric distillation Naphtha NH3, H2S Gas Oils Catalytic Cracking Desulfurization Heating oil H2 CO2 Hydrogen Production Amine NH3 H2S Gas H2 Naphtha Hydrocracking Lubricating oil Grease Wax Vacuum distillation Treating HCN H2S Gas Naphtha Coke Coking Industrial Fuel Asphalt

4
The primary effluent is then carried to secondary treatment, where the levels of BOD5, COD, oil and suspended solids are diminished and can be neglected for this open ended problem. Generally, sulfur compounds are difficult to remove, hence we will not deal with sulfide treatment and only consider the composition of secondary effluent as shown in Table 3.2: Compound Flow (lb/hr) Mass Fraction Water NH3-N 58.33 Phenol 33.33
 Mass Fraction. Water NH3-N Phenol")
5
Pollutant or pollutant property
The refinery has to fulfill the effluent limitation guidelines dictated by the Code of Federal Regulations (40 CFR ), stated below: BOD5 TSS COD Oil and grease Phenolic compounds Ammonia as N Sulfide Total chromium Hexavalent chromium pH 28.2 19.5 210.0 8.4 0.21 18.8 0.18 0.43 0.035 (\2\) 15.6 12.6 109 4.5 0.10 8.5 0.082 0.25 0.016 Maximum for any 1 day Average of daily Maximum values for 30 consecutive days shall not exceed Pollutant or pollutant property Metric units (kilograms per 1,000 m3 of feedstock)
, stated below: BOD5. TSS. COD. Oil and grease. Phenolic compounds. Ammonia as N. Sulfide. Total chromium. Hexavalent chromium. pH (\2\) Maximum for any 1 day. Average of daily Maximum values for 30 consecutive days shall not exceed. Pollutant or pollutant property. Metric units (kilograms per 1,000 m3 of feedstock)")
6
To diminish the content of phenol and ammonia by Steam Stripping
In order to reach the CFR requirements, the secondary effluent will be carried to the tertiary treatment and the considered options for this are: To diminish the content of phenol and ammonia by Steam Stripping To remove phenol by Reverse Osmosis For the last case we will suppose that there is no ammonia in the stream, so that the only pollutant to be removed is phenol: Compound Flow (lb/hr) Mass Fraction Water Phenol 33.33 TOTAL 1
 Mass Fraction. Water Phenol TOTAL")
7
QUESTIONS: Is the level of separation achieved with each of these tertiary treatment methods good enough to satisfy the limits imposed in the CFR? Could the target concentration be reached by modifying some operating conditions? If so, how would these modifications affect the costs? According to the final separation and the cost analysis, which is the most suitable technology? Which method would you recommend for secondary wastewater treatment taking into account BOD5, COD, suspended solids and oil amounts if secondary effluent have to be low enough to meet the CFR regulations? Is any of the two proposed tertiary methods convenient for additional removal of BOD, COD, suspended solids or oil?

8
For the Reverse Osmosis calculation the following data is required:
GEOMETRICAL DATA Fiber length, l: m Fiber seal length, ls: m Outer radius of fiber, ro: 42 x 10-6 m Inner radius of fiber, ri: 21 x 10-6 m Membrane area, Sm: 180 m2 INPUT DATA Maximum flow rate per module: kg/s Minimum flow rate per module: kg/s Maximum feed pressure: x 105 Pressure drop per module: x 105 Pure water permeability, A: 1.20 x 10⁻¹⁰ Solute transport parameter: 2.43 x 10⁻⁴

9
Industrial Wastes The characteristics of industrial wastewaters, their composition, flow and volume differ considerably among industries depending on the specific process carried on. As seen in section 2.3, wastewater from petrochemical and petroleum refining industry contains hazardous chemicals as hydrocarbons, phenols, ammoniacal nitrogen, hydrogen sulfide, sulfuric acid, etc. Thus, the environmental impact of these wastewaters depend, besides their collective characteristics such as biochemical oxygen demand (BOD), chemical oxygen demand (COD) and suspended solids (SS), on their content of specific inorganic and organic compounds. This substances will dictate the most suitable treatment method.
, chemical oxygen demand (COD) and suspended solids (SS), on their content of specific inorganic and organic compounds. This substances will dictate the most suitable treatment method.")
10
Options for controlling industrial wastewaters
EPA's program to control wastes is based on the following hierarchy: Avoidance Re-use Re-cycling Recovery of energy Treatment Containment Disposal The treating of wastewaters can take place at different points in the process. Wastewater can be: Pretreated for discharge to municipal treatment sources. Treated completely at the plant and reused or discharged directly into receiving waters. Treated at the point of generation.

11
Classification of Wastewater Treatment Methods
Biological nitrogen removal Bioaugmentation Activated sludge Extended aeration Anaerobic processes Rotating biological contactors Sequencing batch reactors and trickling filters Carbon adsorption Distillation Filtration Steam Stripping Oil and grease skimming Oil/water separation Sedimentation Membrane technologies Chemical Oxidation Chemical Precipitation Coagulation Dissolved air flotation Electrochemical oxidation Flocculation Hydrolysis Neutralization Solvent Extraction Ion Exchange CHEMICAL PHYSICAL BIOLOGICAL INDUSTRIAL WASTEWATER TREATMENT METHODS

12
Classification of Wastewater Treatment Methods
Biological nitrogen removal Bioaugmentation Activated sludge Extended aeration Anaerobic processes Rotating biological contactors Sequencing batch reactors and trickling filters Carbon adsorption Distillation Filtration Steam Stripping Oil and grease skimming Oil/water separation Sedimentation Membrane technologies Chemical Oxidation Chemical Precipitation Coagulation Dissolved air flotation Electrochemical oxidation Flocculation Hydrolysis Neutralization Solvent Extraction Ion Exchange CHEMICAL PHYSICAL BIOLOGICAL INDUSTRIAL WASTEWATER TREATMENT METHODS Physical/Chemical processes if chemical agents as coagulating agents are added.

13
Wastewater treatment process Conventional Treatment
It’s a combination of physical, chemical, and biological processes PRELIMINARY TREATMENT PRIMARY TREATMENT SECONDARY TREATMENT ADVANCED TREATMENT Feed wastewater stream To discharge or reuse/recycling Conventional Treatment High-quality Treatment

14
Wastewater treatment process
It’s a combination of physical, chemical, and biological processes PRELIMINARY TREATMENT PRIMARY TREATMENT SECONDARY TREATMENT ADVANCED TREATMENT Feed wastewater stream To discharge or reuse/recycling Removal of grit, debris and excessive amounts of oils or greases. Wastewater pretreatment plant.

15
Wastewater treatment process
PRELIMINARY TREATMENT PRIMARY TREATMENT SECONDARY TREATMENT ADVANCED TREATMENT Feed wastewater stream To discharge or reuse/recycling Removes near to 50-70% of SS, 25-50% of BOD5 and 65% of oil and grease. Wastewater treatment process It’s a combination of physical, chemical, and biological processes Clarifier

16
Wastewater treatment process
It’s a combination of physical, chemical, and biological processes PRELIMINARY TREATMENT PRIMARY TREATMENT SECONDARY TREATMENT ADVANCED TREATMENT Feed wastewater stream To discharge or reuse/recycling The reached removal is up to % of BOD and SS and 65% of COD.

17
Wastewater treatment process
PRELIMINARY TREATMENT PRIMARY TREATMENT SECONDARY TREATMENT ADVANCED TREATMENT Feed wastewater stream To discharge or reuse/recycling Membrane separation Wastewater treatment process It’s a combination of physical, chemical, and biological processes Removal of : Additional organic and suspended solids. Nitrogenous Oxygen Demand (NOD) Nutrients Toxic materials Also called “Tertiary Treatment”
 Nutrients. Toxic materials. Also called Tertiary Treatment")
18
Clarifier at the Main Wastewater Treatment Plant in Oakland
PRELIMINARY TREATMENT Grit Chamber Objective: To separate substances which can cause problems to purification plant equipment. Heavy inorganic solids such as sand, gravel, metal or glass are removed. The collected debris is usually disposed off in a landfill. Used processes: Mainly sedimentation and filtration. Used equipment: Bar screens, comminutors and grit chambers. Generally the wastewater enters a bar screen first to remove large size solids and then passes to a grit chamber. PRIMARY TREATMENT Clarifier at the Main Wastewater Treatment Plant in Oakland Objective: Removal of organic and inorganic suspended solids, oils and greases. Also removed are some organic phosphorus, organic nitrogen, and heavy metals associated with solids. Colloidal and dissolved constituents are not affected. Used processes: Sedimentation, flotation and oil/water separation. Used equipment: Clarifiers and settling tanks for suspended solids removal and API separators for oil/water and solid separation.

19
Treatment process with a RBC
SECONDARY TREATMENT Objective: Decomposition of dissolved organic matter by means of using biologically active sludge. Consist of the biological treatment of the effluent from primary treatment to remove the residual organics, suspended, colloidal and dissolved solids. Treatment process with a RBC Used processes: Three approaches are used to accomplish secondary treatment Fixed film systems: Microorganisms grow on substrates (rocks, plastic, sand) over which the wastewater is spread over. The film of microorganisms grows and thickens while the nutrients are absorbed. Some examples are rotating biological contactors (RBC), trickling filters and sand filters. Suspended film systems: Microorganisms are suspended in wastewater and once they absorb nutrients, reproduce and then are settled out as a sludge. A portion of the sludge is pumped back into the incoming wastewater as “seed” microorganisms while the other part is sent to sludge treatment. Examples of such systems are extended aeration, activated sludge, sequential batch reactor systems and oxidation ditch. Lagoon systems: Are shallow ponds designed to hold wastewater for several months while is treated through a combination of physical, biological and chemical processes. Some aeration devices can be added to rise the system efficiency. The most common types of lagoons are: Anaerobic lagoons Naturally aerobic lagoons Aerated lagoons
 over which the wastewater is spread over. The film of microorganisms grows and thickens while the nutrients are absorbed. Some examples are rotating biological contactors (RBC), trickling filters and sand filters. Suspended film systems: Microorganisms are suspended in wastewater and once they absorb nutrients, reproduce and then are settled out as a sludge. A portion of the sludge is pumped back into the incoming wastewater as seed microorganisms while the other part is sent to sludge treatment. Examples of such systems are extended aeration, activated sludge, sequential batch reactor systems and oxidation ditch. Lagoon systems: Are shallow ponds designed to hold wastewater for several months while is treated through a combination of physical, biological and chemical processes. Some aeration devices can be added to rise the system efficiency. The most common types of lagoons are: Anaerobic lagoons. Naturally aerobic lagoons. Aerated lagoons.")
20
By the type of process flow scheme utilized
ADVANCED WASTEWATER TREATMENT Definition: Any process applied after secondary treatment designed to produce an effluent of higher quality to protect the receiving waters or to provide reusable water for its further domestic and/or industrial recycling (cooling water supplies). This technology encompasses all unit operations not commonly found in the typical wastewater treatment. Classification of advanced wastewater treatment process: “Treatment process in which unit operations are added to the conventional secondary treatment.” TERTIARY TREAMENT By the type of process flow scheme utilized “Treatment process in which biological and physical-chemical processes are intermixed to achieve the desired effluent.” PHYSICOCHEMICAL TREATMENT Combination of biological and physicochemical treatments. COMBINED BIOLOGICAL-PHYSICAL-CHEMICAL TREATMENT
. This technology encompasses all unit operations not commonly found in the typical wastewater treatment. Classification of advanced wastewater treatment process: Treatment process in which unit operations are added to the conventional secondary treatment. TERTIARY TREAMENT. By the type of process flow scheme utilized. Treatment process in which biological and physical-chemical processes are intermixed to achieve the desired effluent. PHYSICOCHEMICAL TREATMENT. Combination of biological and physicochemical treatments. COMBINED. BIOLOGICAL-PHYSICAL-CHEMICAL TREATMENT.")
21
PHYSICOCHEMICAL PROCESS
ADVANCED WASTEWATER TREATMENT Another way to classify advanced wastewater treatment is to differentiate according to the desired treatment goals. Some examples are presented next. Consist of two phases: Nitrification or first phase: Occurs in an aerobic environment and a thank similar to that for the active sludge is used to oxidize the ammonia to nitrate. Second phase: Occurs in an anoxic (without “free” oxygen, i.e., O2) environment where the nitrates are denitrified to molecular nitrogen by means of different genus of bacteria using the nitrates as oxidizing compound in place of oxygen. BIOLOGICAL PROCESS NITROGEN REMOVAL Alkaline air stripping Ion exchange: Wastewater is passed through a porous bed of organic resin where cationic and anionic ion exchangers react with cations and anions, respectively, for removal or recovery. Breakpoint chlorination PHYSICOCHEMICAL PROCESS about/wyman.html
 environment where the nitrates are denitrified to molecular nitrogen by means of different genus of bacteria using the nitrates as oxidizing compound in place of oxygen. BIOLOGICAL PROCESS. NITROGEN. REMOVAL. Alkaline air stripping. Ion exchange: Wastewater is passed through a porous bed of organic resin where cationic and anionic ion exchangers react with cations and anions, respectively, for removal or recovery. Breakpoint chlorination. PHYSICOCHEMICAL PROCESS. about/wyman.html.")
22
Waste activated sludge with P rich bacteria
ADVANCED WASTEWATER TREATMENT BIOLOGICAL PROCESS Phosphorus removal is done by encouraging PAO’s (phosphorus accumulating organisms) to grow and consume phosphorus by using an anaerobic tank placed ahead of an activated sludge aeration tank. Anaerobic reactor Aerobic reactor Clarifier Secondary effluent P clean effluent Waste activated sludge with P rich bacteria As these methods convert dissolved phosphorus into particulate form it is common to use sand filters as final stage. PHOSPHORUS REMOVAL CHEMICAL PROCESS By chemical precipitation using multivalent metal ions as iron salts or aluminum compounds such as ferric chloride or alum (aluminum sulfate) Alum treatment at Squibb Lake, Lawrenceville, NJ
 to grow and consume phosphorus by using an anaerobic tank placed ahead of an activated sludge aeration tank. Anaerobic reactor. Aerobic reactor. Clarifier. Secondary effluent. P clean effluent. Waste activated sludge with P rich bacteria. As these methods convert dissolved phosphorus into particulate form it is common to use sand filters as final stage. PHOSPHORUS. REMOVAL. CHEMICAL PROCESS. By chemical precipitation using multivalent metal ions as iron salts or aluminum compounds such as ferric chloride or alum (aluminum sulfate) Alum treatment at Squibb Lake, Lawrenceville, NJ.")
23
ADVANCED WASTEWATER TREATMENT
Filtration. Used for additional elimination of suspended solids and biochemical oxygen demand. These processes include sand filtration, constructed wetlands and membrane filtration. Microstraining. Method used for removal of additional suspended solids and associated biochemical oxygen demand. The process involves the passing of an effluent through a horizontal rotating drum with a filtering fabric fixed by a porous screen. OTHER TRETMENT METHODS Polishing ponds. Used to obtain additional suspended solids removal. Treatment can be aerobic or facultative (a combination of aerobic and anaerobic biological activity). Post-aeration. Method used to maintain certain dissolved oxygen level. This is accomplished by mechanical aeration, diffused aeration or cascade aeration. Adsorption with activated carbon. It is applied as advanced treatment for the removal of non-biodegradable dissolved organics or as a secondary treatment replacing conventional biological treatment. Some molecules as methanol, formic acid, and sugars are not removable by t his method.
. Post-aeration. Method used to maintain certain dissolved oxygen level. This is accomplished by mechanical aeration, diffused aeration or cascade aeration. Adsorption with activated carbon. It is applied as advanced treatment for the removal of non-biodegradable dissolved organics or as a secondary treatment replacing conventional biological treatment. Some molecules as methanol, formic acid, and sugars are not removable by t his method.")
24
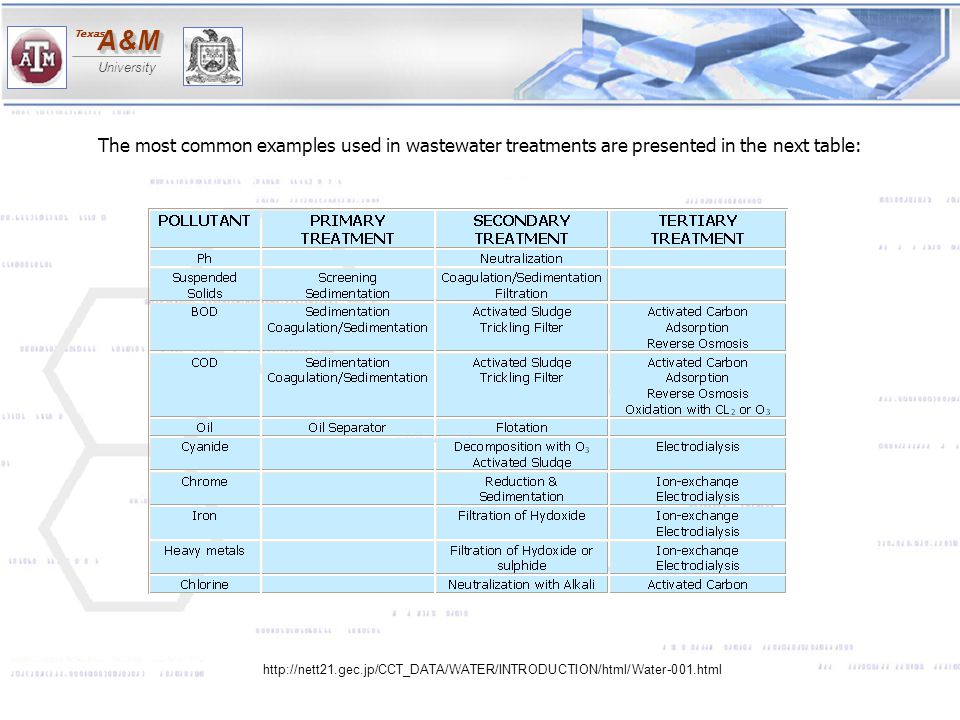
The most common examples used in wastewater treatments are presented in the next table:
25
Typical Petroleum Refinery Effluent Treatment Plant
It is common in most refineries to collect all process wastewaters and to combine them into a single wastewater. This effluent is then treated in a central facility called "end-of pipe" treatment as it is normally implemented as the last stage of the process before the stream is disposed of or delivered. The end-of-pipe treatment technology includes biological and chemical systems. Effluent API Separator Feed Tanks Dissolved Air Flotation Equalization basin Aeration basin Clarifier Raw Feed Sludge Recycle Sludge Wastage Activated Sludge Process Adapted from “An Integrated Expert System for Operating a Petroleum Refinery Activated Sludge Process Weibo Yuan, Michael K. Stenstrom , Naci H. Ozgur, David Okrent

26
Typical Petroleum Refinery Effluent Treatment Plant
The American Petroleum Institute (API) separator is a long rectangular tank that operates on the principle of strokes law which defines the rise velocity of an oil particle based on its density and size. Typical Petroleum Refinery Effluent Treatment Plant Effluent API Separator Feed Tanks Dissolved Air Flotation Equalization basin Aeration basin Clarifier Raw Feed Sludge Recycle Sludge Wastage Activated Sludge Process
 separator is a long rectangular tank that operates on the principle of strokes law which defines the rise velocity of an oil particle based on its density and size. Typical Petroleum Refinery Effluent Treatment Plant. Effluent. API Separator. Feed. Tanks. Dissolved Air Flotation. Equalization basin. Aeration basin. Clarifier. Raw Feed. Sludge Recycle. Sludge Wastage. Activated Sludge Process.")
27
Typical Petroleum Refinery Effluent Treatment Plant
American Petroleum Institute (API) separator. It is designed to provide sufficient hydraulic detention time to permit free emulsified oil to agglomerate and rise to the surface. Solids either settle at the bottom of the separator or are carried through the separator with the water, depending on their settling rate and density. Typical Petroleum Refinery Effluent Treatment Plant Effluent API Separator Feed Tanks Dissolved Air Flotation Equalization basin Aeration basin Clarifier Raw Feed Sludge Recycle Sludge Wastage Activated Sludge Process
 separator. It is designed to provide sufficient hydraulic detention time to permit free emulsified oil to agglomerate and rise to the surface. Solids either settle at the bottom of the separator or are carried through the separator with the water, depending on their settling rate and density. Typical Petroleum Refinery Effluent Treatment Plant. Effluent. API Separator. Feed. Tanks. Dissolved Air Flotation. Equalization basin. Aeration basin. Clarifier. Raw Feed. Sludge Recycle. Sludge Wastage. Activated Sludge Process.")
28
Typical Petroleum Refinery Effluent Treatment Plant
API Separator Relatively inefficient Requires large amount of space Typical Petroleum Refinery Effluent Treatment Plant Accept a wide variety and proportions of oil and solids including viscous, sticky or waxy oil. Effluent API Separator Feed Tanks Dissolved Air Flotation Equalization basin Aeration basin Clarifier Raw Feed Sludge Recycle Sludge Wastage Activated Sludge Process

29
Typical Petroleum Refinery Effluent Treatment Plant
The Dissolved Air Flotation (DAF) unit consist of two sections First, in the “flocculator chamber” the influent is mixed with coagulant demulsifiers that cause the agglomeration of oil droplets and solids. Then the oily waste flows into the flotation section, in which rising air bubbles adhere to these particles causing them to rise. Effluent API Separator Feed Tanks Equalization basin Aeration basin Clarifier Raw Feed Sludge Recycle Sludge Wastage Activated Sludge Process
 unit consist of two sections First, in the flocculator chamber the influent is mixed with coagulant demulsifiers that cause the agglomeration of oil droplets and solids. Then the oily waste flows into the flotation section, in which rising air bubbles adhere to these particles causing them to rise. Effluent. API Separator. Feed. Tanks. Equalization basin. Aeration basin. Clarifier. Raw Feed. Sludge Recycle. Sludge Wastage. Activated Sludge Process.")
30
Typical Petroleum Refinery Effluent Treatment Plant
Finally, in the surface the scum is removed by a skimmer and the settled sludge from the bottom is displaced by gravity or pumping. Typical Petroleum Refinery Effluent Treatment Plant Effluent API Separator Feed Tanks Dissolved Air Flotation Equalization basin Aeration basin Clarifier Raw Feed Sludge Recycle Sludge Wastage Activated Sludge Process

31
Typical Petroleum Refinery Effluent Treatment Plant
Equalization Basin These are tanks or lined ponds. According to the Department of Environment & Natural Resources of South Dakota, equalization basins have two objectives: Effluent API Separator Feed Tanks Dissolved Air Flotation Equalization basin Aeration basin Clarifier Raw Feed Sludge Recycle Sludge Wastage Activated Sludge Process

32
Typical Petroleum Refinery Effluent Treatment Plant
“The secondary objective is to dampen the strength of wastewater constituents by blending the wastewater in the equalization basin to maintain a degree of reliability and operational control”. Genesee County ARTP Equalization Basin The primary objective is to dampen the variations caused by inflow/infiltration and the diurnal flow variation, to achieve a nearly constant flow rate through the downstream treatment processes. Effluent API Separator Feed Tanks Dissolved Air Flotation Equalization basin Aeration basin Clarifier Raw Feed Sludge Recycle Sludge Wastage Activated Sludge Process

33
Typical Petroleum Refinery Effluent Treatment Plant
The Activated Sludge Process is one of the most common secondary treatment processes. This process uses Saprophytic bacteria to remove suspended solids and dissolved BOD. According to Activated Sludge, Manual of Practice #9 (Water Environment Association, 1987), the activated-sludge process contains five essential interrelated equipment components. API Separator Feed Tanks Dissolved Air Flotation Raw Feed Sludge Recycle Sludge Wastage Clarifier Equalization basin Aeration basin Effluent Activated Sludge Process
, the activated-sludge process contains five essential interrelated equipment components. API Separator. Feed. Tanks. Dissolved Air Flotation. Raw Feed. Sludge Recycle. Sludge Wastage. Clarifier. Equalization basin. Aeration basin. Effluent. Activated Sludge Process.")
34
Typical Petroleum Refinery Effluent Treatment Plant
An aeration tank in which air or oxygen is introduced into the system to create an aerobic environment. At least seven modifications in the shape and number of tanks exist to produce variations in the pattern of flow. API Separator Feed Tanks Dissolved Air Flotation Raw Feed Sludge Recycle Sludge Wastage Clarifier Equalization basin Aeration basin Effluent Activated Sludge Process

35
Typical Petroleum Refinery Effluent Treatment Plant
An aeration source that can be provided by pure oxygen, compressed air or mechanical aeration. Picture of a diffuser used to supply the air needed for the microorganisms. API Separator Feed Tanks Dissolved Air Flotation Raw Feed Sludge Recycle Sludge Wastage Clarifier Equalization basin Aeration basin Effluent Activated Sludge Process

36
Typical Petroleum Refinery Effluent Treatment Plant
Clarifiers. Activated sludge-solids are separated from the surrounding wastewater by flocculation and gravity sedimentation. Then a thickened sludge (flocs and termed return activated sludge or RAS) is founded in the bottoms while in the upper portion of the clarifier the wastewater with low level of activated-sludge solids in suspension is formed. API Separator Feed Tanks Dissolved Air Flotation Raw Feed Sludge Recycle Sludge Wastage Clarifier Equalization basin Aeration basin Effluent Activated Sludge Process
 is founded in the bottoms while in the upper portion of the clarifier the wastewater with low level of activated-sludge solids in suspension is formed. API Separator. Feed. Tanks. Dissolved Air Flotation. Raw Feed. Sludge Recycle. Sludge Wastage. Clarifier. Equalization basin. Aeration basin. Effluent. Activated Sludge Process.")
37
Typical Petroleum Refinery Effluent Treatment Plant
The return activated sludge (RAS) from the secondary clarifiers is pumped back to the aeration tank to ensure the replenishing of the microorganisms. API Separator Feed Tanks Dissolved Air Flotation Raw Feed Sludge Recycle Sludge Wastage Clarifier Equalization basin Aeration basin Effluent Activated Sludge Process
 from the secondary clarifiers is pumped back to the aeration tank to ensure the replenishing of the microorganisms. API Separator. Feed. Tanks. Dissolved Air Flotation. Raw Feed. Sludge Recycle. Sludge Wastage. Clarifier. Equalization basin. Aeration basin. Effluent. Activated Sludge Process.")
38
Typical Petroleum Refinery Effluent Treatment Plant
Aeration basin Clarifier Raw Feed Sludge Recycle Sludge Wastage Finally, activated sludge containing an overabundance of microorganisms must be removed, or wasted (waste activated sludge, or WAS), from the system. Effluent API Separator Feed Tanks Dissolved Air Flotation Equalization basin Activated Sludge Process
, from the system. Effluent. API Separator. Feed. Tanks. Dissolved Air Flotation. Equalization basin. Activated Sludge Process.")
39
Membrane Separation Techniques
Membrane separation (MS) techniques have experienced high growth in recent years and are widely being applied in the industry today as they are intended to fulfill the following necessities: Demand for higher quality products Increased regulatory pressures The rising interest in preserving natural resources Environmental and economic sustainability.
 techniques have experienced high growth in recent years and are widely being applied in the industry today as they are intended to fulfill the following necessities: Demand for higher quality products. Increased regulatory pressures. The rising interest in preserving natural resources. Environmental and economic sustainability.")
40
Increasing applicability
Among its many strengths, some of the reasons for the increased applicability of membrane separation processes are: Appreciable energy savings: Low energy consumption because these systems operate near room temperature. Clean technology with operational ease. Compact and modular design (using less space than cumbersome traditional methods). Produce high-quality products due to the high selectivity of the membranes. Allow the recovery of salable by-products from waste streams, which increases their profitability. Greater flexibility in designing systems. Easy incorporation to presently existing industrial plants.
. Produce high-quality products due to the high selectivity of the membranes. Allow the recovery of salable by-products from waste streams, which increases their profitability. Greater flexibility in designing systems. Easy incorporation to presently existing industrial plants.")
41
Membrane separation techniques
The basic objective of membrane separation processes is the selective permeation of one or more species through a membrane, thereby achieving separation. According to IUPAC, a membrane is a “structure, having lateral dimensions much greater than its thickness, through which mass transfer may occur under a variety of driving forces”. Since membranes avoid the flow of liquid, the transport through the membrane is by: Sorption: It refers either to adsorption or absorption of the particles in the membrane. Diffusion: The movement of particles from areas of high concentration to areas of low concentration. For diffusion to occur, the membrane must be permeable to molecules The permeability describes the rate of transport of particles through membranes. Feed Pump Retentate Membrane Permeate Schematic representation of a membrane separation unit.

42
“Membrane separation techniques can be applied in different sections of the process”.
by-product Final Product residue Feed stream 1 Feed stream 2 Up-stream process section In-course process section Down-stream process section PROCESS Fluid preparation Fluid regeneration, production Purification, production recovery, effluent revalorization By-product for sale Membrane Separation Processes can differ from one another in the type and configuration of the membrane, the mechanism of trans-membrane transport for various water solution components and, the nature of the process driving force.

43
Common Definitions Before we move on further with membrane separation and introduce Reverse Osmosis (RO), the perusal of the following definitions is useful. Retentate: Stream retained at the high pressure side of the membrane. Permeate: Stream retained at the low pressure side of the membrane. Osmotic Flow (OF): The chemical potential difference arising due to the difference in concentrations of the solutes in solutions, results in the membrane permeation of the carrier (usually water). This process occurs from high chemical potential side (low concentration) to low chemical potential (high concentration) side. Osmotic Pressure (P): The pressure necessary to stop the osmosis process. Is the hydrostatic pressure that must be applied to the side of a rigid ideal semipermeable membrane with higher solute concentration in order to stop the transport of solvent across the membrane.
, the perusal of the following definitions is useful. Retentate: Stream retained at the high pressure side of the membrane. Permeate: Stream retained at the low pressure side of the membrane. Osmotic Flow (OF): The chemical potential difference arising due to the difference in concentrations of the solutes in solutions, results in the membrane permeation of the carrier (usually water). This process occurs from high chemical potential side (low concentration) to low chemical potential (high concentration) side. Osmotic Pressure (P): The pressure necessary to stop the osmosis process. Is the hydrostatic pressure that must be applied to the side of a rigid ideal semipermeable membrane with higher solute concentration in order to stop the transport of solvent across the membrane.")
44
In the case of dilute solutions, osmotic pressure can be predicted with
Van’t Hoff’s equation: Where C is the molar concentration of the solute, R is the universal gas constant and T is the absolute temperature. Membrane packing density: It defines the effective membrane area installed per volume of a module and is the main indicator for the degree of pretreatment necessary for the different modules in order to achieve a safe and trouble-free long term operation.

45
Membranes The maximum separation reached in membrane processes depends on the permeability of the membrane for the feed solution components. A permeable membrane allows the passage of all dissolved substances and the solvent. A semipermeable membrane is capable of transporting different molecular species at different rates under identical conditions. The ideal semipermeable membrane in membrane processes is permeable to the solvent only but impermeable to all solutes. Membrane separation processes depend strongly on the chemical nature of the membrane materials and the physical structure of the membranes. The following are some desirable characteristics of membranes: Good permeability High selectivity Mechanical stability Temperature stability Ability to withstand large pressure differences across membrane thickness

46
MEMBRANE CLASSIFICATION
ORIGIN MATERIAL MORPHOLOGY/STRUCTURE MEMBRANE Synthetic Biological Solid Liquid Organic Inorganic Non-porous Porous

47
MEMBRANE CLASSIFICATION
Discrimination according to size of particles or molecules. The mechanism on which separation is based is sieving or filtrating. A gradient in hydraulic pressure acts as the driving force. ORIGIN MATERIAL MORPHOLOGY/STRUCTURE MEMBRANE Synthetic Biological Solid Liquid Organic Inorganic Non-porous Porous Discrimination according to chemical affinities between components and membrane materials.

48
MEMBRANE CLASSIFICATION
Mass transport through these membranes is described by the “solution-diffusion model” as follows: Sorption of a component out of the feed mixture and solution in the membrane material. Transport through the membrane along a potential gradient. Desorption on the second side of the membrane. ORIGIN MATERIAL MORPHOLOGY/STRUCTURE MEMBRANE Synthetic Biological Solid Liquid Organic Inorganic Non-porous Porous

49
MEMBRANE CLASSIFICATION
SYMMETRIC (HOMOGENOUS) Constructed by a single material and because of this reason, the membrane is uniform in density and pore structure throughout the cross-section. Skinned type: consist of a dense skinned layer used as primary filtration barrier and, a thick and more porous understructure that serves as support structure. According to the Physical Structure (“trans-wall symmetry”) This quality describes the level of uniformity throughout the cross-section of the membrane. ASYMMETRIC May be either homogeneous or heterogeneous and are characterized by a density change given by the membrane material across the cross sectional area. Graded density type: the porous structure gradually decreases in density from the feed to the filtrate side of the membrane. Constituted by different (heterogeneous) materials, the membranes have a thin, dense layer that serves as the filtration barrier. But, unlike skinned membranes, is made of different material than the porous substructure onto which it is cast. COMPOSITE (HETEROGENOUS)
 Constructed by a single material and because of this reason, the membrane is uniform in density and pore structure throughout the cross-section. Skinned type: consist of a dense skinned layer used as primary filtration barrier and, a thick and more porous understructure that serves as support structure. According to the Physical Structure ( trans-wall symmetry ) This quality describes the level of uniformity throughout the cross-section of the membrane. ASYMMETRIC. May be either homogeneous or heterogeneous and are characterized by a density change given. by the membrane material across the cross sectional area. Graded density type: the porous structure gradually decreases in density from the feed to the filtrate side of the membrane. Constituted by different (heterogeneous) materials, the membranes have a thin, dense layer that serves as the filtration barrier. But, unlike skinned membranes, is made of different material than the porous substructure onto which it is cast. COMPOSITE. (HETEROGENOUS)")
50
Measures how much of the feed is recovered as permeate.
MEMBRANE PERFORMANCE AND MAINTENANCE The performance of a membrane depends on: The characteristics of the membrane The feed solution being treated The operating conditions The following are some parameters used to measure membrane performance: Measures how much of the feed is recovered as permeate. Recovery Factor Where Qpermeate and QFeed are the permeate flow rate and the feed flow rate respectively.

51
Rejection or Retention
Measure of the fraction of solute that is retained for the membrane. Rejection or Retention Where CFeed is the concentration of a particular species in the feed and Cpermeate is the concentration of the same specie in the purified stream. Percentage of solute that is not retained by the membrane. Transmission or

52
Decontamination Factor
Useful to evaluate the performance of waste treatment processes. Measure of the degree of increasing the concentration of a component. Concentration Factor High CF’s are desirable but, they are limited because it results in a high osmotic pressure (RO, NF) or cake buildup (MF, UF), which leads to the cost raise.
 or cake buildup (MF, UF), which leads to the cost raise.")
53
Membrane Performance can be affected for the following phenomena:
Membrane compaction: Is the decrease in membrane permeability caused for the compression of the membrane structure under the transmembrane pressure. Concentration polarization: is characterized for the accumulation of retained species at the membrane surface. As consequence, the membrane surface is subjected to a feed concentration that is higher than the concentration of the bulk feed stream which leads to the development of high osmotic pressures in reverse osmosis and nanofiltration. The thickness of this boundary layer can be controlled partially by the velocity and turbulence of the liquid pumped over the membrane during the mentioned cross-flow operation. Is detrimental because: It decreases flux and retention and increases the potential for fouling through bacterial growth or chemical reactions such as precipitation. It causes stagnant and irreversibly bound cake formation in microfiltration. In ultrafiltration, it causes arising osmotic pressure build up and possible gel formation. Although this phenomenon is reversible, the fouling it causes may not be.

54
In general, there are four major types of fouling:
Fouling: Is the deposition of sub-micrometre particles (smaller than 1 μm) on the membrane surface and/or its pores. It occurs when rejected solids are not transported from the surface of the membrane back to the bulk stream. In general, there are four major types of fouling: Generally, the different types of fouling occur simultaneously. Dissolved solids Suspended solids Non-biological organics Biological organisms Comparison of Fouled and Clean Membrane
 on the membrane surface and/or its pores. It occurs when rejected solids are not transported from the surface of the membrane back to the bulk stream. In general, there are four major types of fouling: Generally, the different types of fouling occur simultaneously. Dissolved solids. Suspended solids. Non-biological organics. Biological organisms. Comparison of Fouled and Clean Membrane.")
55
Driving Forces for Transport
In general, four different driving forces are possible in membrane transport: Each of the driving forces have a counter influence on the other fluxes in addition to their primary effect. For example, the pressure gradient can cause a flux of current called the streaming current, besides the flux of solvent. DRIVING FORCE PRIMARY EFFECT Pressure Flux of solvent Concentration Flux of solute Electrical Potential Flux of electrical current Temperature Flux of thermal energy

56
According to the Driving Forces for transport, membrane processes can be classified as follows:
Pressure Gradient (P): Reverse osmosis Ultrafiltration Microfiltration Nanofiltration Vapor permeation Gas permeation Pervaporation Electrical potential Gradient (E): Electrodialysis Membrane electrolysis Electrosorption Electrofiltration Electrochemical ion exchange Temperature gradient (T): Membrane distillation Thermo-osmosis Concentration gradient (C): Dialysis Membrane extraction Supported liquid membrane (SLM) Emulsion liquid membrane (ELM) Non-dispersive solvent extraction with hollow fiber contactors. Processes with combined driving forces: Electro-osmofiltration (P + E) Electro-osmotic concentration (E + C) Gas separation (P + C) Piezodialysis (P + C)
: Reverse osmosis. Ultrafiltration. Microfiltration. Nanofiltration. Vapor permeation. Gas permeation. Pervaporation. Electrical potential Gradient (E): Electrodialysis. Membrane electrolysis. Electrosorption. Electrofiltration. Electrochemical ion exchange. Temperature gradient (T): Membrane distillation. Thermo-osmosis. Concentration gradient (C): Dialysis. Membrane extraction. Supported liquid membrane (SLM) Emulsion liquid membrane (ELM) Non-dispersive solvent extraction with hollow fiber contactors. Processes with combined driving forces: Electro-osmofiltration (P + E) Electro-osmotic concentration (E + C) Gas separation (P + C) Piezodialysis (P + C)")
57
Alternative Processes
Examples of applications and separation processes which compete with the respective membrane separation process. Process Applications Alternative Processes Microfiltration Separation of bacteria and cells from solutions Sedimentation, Centrifugation Ultrafiltration Separation of proteins and virus, concentration of oil-in-water emulsions Centrifugation Nanofiltration Separation of dye and sugar, water softening Distillation, Evaporation Reverse Osmosis Desalination of sea and brackish water, process water purification Distillation, Evaporation, Dialysis Dialysis Purification of blood (artificial kidney) Reverse osmosis Electrodialysis Separation of electrolytes from nonelectrolytes Crystallization, Precipitation Pervaporation Dehydration of ethanol and organic solvents Distillation Gas Permeation Hydrogen recovery from process gas streams, dehydration and separation of air Absorption, Adsorption, Condensation Membrane Distillation Water purification and desalination Perry's Chemical Engineers' Handbook, 7th edition, pages to
 Reverse osmosis. Electrodialysis. Separation of electrolytes from nonelectrolytes. Crystallization, Precipitation. Pervaporation. Dehydration of ethanol and organic solvents. Distillation. Gas Permeation. Hydrogen recovery from process gas streams, dehydration and separation of air. Absorption, Adsorption, Condensation. Membrane Distillation. Water purification and desalination. Perry s Chemical Engineers Handbook, 7th edition, pages to")
58
Pressure Driven Membrane Processes
Pressure driven processes are mature technologies with a large number of successful applications in industrial water and wastewater treatment. Their flexibility in process configurations can optimize performance. They are suitable for system integration with conventional treatment steps.

59
PD membrane processes primarily based on species size
The following table shows the most used Pressure Driven (PD) Membrane processes and their typical operating values: PROCESS PORE SIZE FLUX (L/m2 h) PRESSURE (psi) MF 0.1 to 2 mm 100 – 1000 UF 0.005 to 0.1 mm 30 – 300 10 – 100 NF to mm 20 – 150 40 – 200 psig (90 typically) RO < 0.5 nm 200 – 300 PD membrane processes primarily based on species size
 Membrane processes and their typical operating values: PROCESS. PORE SIZE. FLUX. (L/m2 h) PRESSURE (psi) MF. 0.1 to 2 mm. 100 – UF to 0.1 mm. 30 – – 100. NF to mm. 20 – – 200 psig (90 typically) RO. < 0.5 nm – 300. PD membrane processes primarily based on species size.")
60
Pressure Driven Membrane Processes
Features of Pressure-Driven Membrane Systems for Environmental Applications. REF

61
Membrane Pore Size (mm)
Pressure driven membrane processes are specially useful where a wide range of possible contaminants have to be removed over the entire removal spectrum i.e. macro particles to ionic species. Membrane Pore Size (mm) Pressure (bar) Reverse Osmosis (RO) Ultrafiltration (UF) Nanofiltration (NF) Microfiltration (MF) 30-60 20-40 1-10 < 1 Retentate (concentrate) Permeate (filtrate) FEED Suspended solids Bacteria Viruses Multivalent ions Monovalent ions Water
 Pressure. (bar) Reverse Osmosis. (RO) Ultrafiltration. (UF) Nanofiltration. (NF) Microfiltration. (MF) < Retentate. (concentrate) Permeate. (filtrate) FEED. Suspended solids. Bacteria. Viruses. Multivalent ions. Monovalent ions. Water.")
62
There are several types of flows used in membrane-based separations
There are several types of flows used in membrane-based separations. The following are some of them: F R F R M M P S P (a) co-current flow (b) Completely-mixed flow F R M S P (a) counter-current flow F F R M M M = Membrane F = Feed P = Permeate R = Retentate S = Sweep stream P P (d) Cross flow (e) Dead-end flow
 co-current flow. (b) Completely-mixed flow. F. R. M. S. P. (a) counter-current flow. F. F. R. M. M. M = Membrane. F = Feed. P = Permeate. R = Retentate. S = Sweep stream. P. P. (d) Cross flow. (e) Dead-end flow.")
63
In pressure driven processes separation is achieved either by dead-end or cross flow mode:
Dead-end flow mode: The feed flow is perpendicular to the membrane and the only outlet for upstream fluid is through the membrane. In this configuration the flow bombards the membrane surface. It is not a very recommended mode because the particles accumulated on the membrane surface could cause significant pressure drop as it becomes plugged or fouled. Cross flow mode: In this mode the feed stream moves parallel to the membrane and the fluid on the downstream side of the membrane moves away from the membrane in the direction normal to the membrane surface. This configuration reduces material buildup on the membranes by sweeping the material away from the surface.

64
Types of Osmosis There are two types of Osmosis processes as shown in Fig 1.1 Direct Osmosis (DO):DO uses low pressure. The solvent passes through the membrane driven by the difference in solute concentrations on the two sides. Equilibrium is reached when sufficient water has moved to equalize the solute concentration on both sides of the membrane. Reverse osmosis (RO): RO uses a high-pressure which is larger than OP on the high concentration side. So, the carrier is preferentially permeated, while the retentate contains the rejected solute (contaminant). Thus, the membrane divides the water from the contaminants. The main aim is to purify water and not dilute the contaminants. EQUILIBRIUM p Osmotic Pressure The solvent flux is stopped . Pure solvent Solution Membrane OSMOSIS Solvent passes the membrane to the solution side. From low solute concentration to high concentration. DP > p REVERSE OSMOSIS The flux is reversed when a P greater than p is applied. From high solute concentration to low concentration
:DO uses low pressure. The solvent passes through the membrane driven by the difference in solute concentrations on the two sides. Equilibrium is reached when sufficient water has moved to equalize the solute concentration on both sides of the membrane. Reverse osmosis (RO): RO uses a high-pressure which is larger than OP on the high concentration side. So, the carrier is preferentially permeated, while the retentate contains the rejected solute (contaminant). Thus, the membrane divides the water from the contaminants. The main aim is to purify water and not dilute the contaminants. EQUILIBRIUM. p. Osmotic Pressure. The solvent flux is stopped . Pure solvent. Solution. Membrane. OSMOSIS. Solvent passes the membrane to the solution side. From low solute concentration to high concentration. DP > p. REVERSE OSMOSIS. The flux is reversed when a P greater than p is applied. From high solute concentration to low concentration.")
65
REVERSE OSMOSIS In Reverse Osmosis a pump is used to raise the pressure and the feed is distributed among a number, n, of modules. The reject is collected and taken for further treatment, disposal or sale. The permeate is recovered and constitute the clean stream. Permeate Feed Reject Reverse Osmosis Performance Reverse Osmosis can be used in a legion of applications. Some of them are: seawater desalting, treatment of cheese whey, metal finishing solutions, bleach and dye plant effluent and waste water from sewage treatment works. ultrafiltration evaporation Reverse osmosis Sugars 5%(w/v) Bleach plant effluent Water for reuse Lignosulfonates 30% (w/v) Sugars 20%(w/v) Lignosulfonates 60% (w/v) Sugars 60%(w/v) Reverse Osmosis for pulped paper industry waste treatment.
 Bleach plant effluent. Water for reuse. Lignosulfonates 30% (w/v) Sugars 20%(w/v) Lignosulfonates 60% (w/v) Sugars 60%(w/v) Reverse Osmosis for pulped paper industry waste treatment.")
66
REVERSE OSMOSIS MEMBRANE AND MODULES
Hollow Fiber module Spiral wound module Plate and Frame module Tubular module HOLLOW FIBER According to Geometric Shape, membranes can be classified in FLAT SHEET TUBULAR

67
Spiral-Wound Module: Consist of two semipermeable membranes placed back to back and separated by a woven fabric that functions as a permeate carrier, designed to prevent the membrane from penetrating into it and to minimize permeate pressure drop. The three edges of the membrane are sealed with adhesive, while the fourth one is attached to a perforated central tube. When the package is rolled up, the membrane layers are separated by a mesh that not only promotes turbulence, improving mass transfer but also reduces concentration polarization. The spirally wound element is inserted into a pressure vessel or module housing. Thus, the pressurized feed water flows axially into only one face of the cylinder. The permeate passes through the membrane and down the permeate carrier and into the perforated central tube, where it is collected and removed. The reject flows out of the other end of the spiral module. Pages/FAQ/faqs.html

68
Tubular Module: Each membrane is held in a porous tube
Tubular Module: Each membrane is held in a porous tube. In practise, the feed stream is circulated through tubes in series or parallel. Permeate solution passes through the membrane, through the tube and drops off into a receptacle for further permeate removal. Plate and Frame Module: Consists of circular membranes sealed to both sides of a rigid plate (constructed of plastic, porous fiberglass or reinforced porous paper), which acts as mechanical support and as permeate carrier. These units are placed in a pressurized vessel for use. Each plate in the vessel is at low pressure, so that permeate passes through the membrane and is collected in the porous media. Tubular Module
, which acts as mechanical support and as permeate carrier. These units are placed in a pressurized vessel for use. Each plate in the vessel is at low pressure, so that permeate passes through the membrane and is collected in the porous media. Tubular Module.")
69
Hollow Fiber Module (HFRO): Consist of a shell which houses a very large number of hollow membrane fibers. The membrane fibers are grouped in a bundle, evenly spaced about a central feed distributor tube. One end of the fiber is sealed and the other is open to the atmosphere. This bundle is inserted into a pressure container for use. During operation, pressurized feed water is introduced through the distributor tube which flows around the outer side of the fibers toward the shell perimeter. The permeate penetrates through the fiber wall into the bare side and is removed at the open ends of the fibers.

70
ADVANTAGES AND DISADVANTAGES OF MEMBRANE MODULES
Low manufacturing cost Relatively easy to clean by both chemical and hydraulic methods. Has a very broad range of applications High packing density It can not be used on highly turbid feed waters without extensive pretreatment. Susceptible to plugging by particulates SPIRAL-WOUND HOLLOW FIBER Extremely susceptible to fouling due to very small spacing between fibers. Difficult to clean. Requires extensive pretreatment. Limited range of applications. Relatively low manufacturing cost. Compact High packing density Modes energy requirement TUBULAR Can be operated on extremely turbid feed waters. Relatively easy to clean either mechanically or hydraulically. Can process high suspended solid feed with minimal pretreatment. High capital cost. Relative high volume required per unit membrane area. PLATE AND FRAME Moderate membrane surface. Well-developed equipment. Expensive to operate for large scale. Susceptible to plugging by particulates at flow stagnation points. Potentially difficult to clean.

71
RO Calculations In modeling an RO unit we should consider the following aspects: * Membrane Transport: Describes the phenomena taking place at the membrane surface ( water permeation, etc.) * Hydrodynamic model: Describes the macroscopic transport, the momentum and energy of the species. The Two-D model, as explained by Dr. El-Halwagi is used for RO calculations in this section. The method captures the radial and axial flows in HFRO model. RO calculations demand that we calculate the following: Water flux, Nwater Solute flux, Nsolute Permeate flowrate, and Permeate Concentration.
 * Hydrodynamic model: Describes the macroscopic. transport, the momentum and energy of the species. The Two-D model, as explained by Dr. El-Halwagi is used for RO calculations in this section. The method captures the radial and axial flows in HFRO model. RO calculations demand that we calculate the following: Water flux, Nwater. Solute flux, Nsolute. Permeate flowrate, and. Permeate Concentration.")
72
Schematic for HFRO module
Sealing Ring Feeder Feed Permeate L 2RS LS 2Rf Reject 2ri 2ro A Typical Hollow Fiber Adopted from “Pollution Prevention Through Process Integration Systematic Design Tools,” by Dr.El-Halwagi, fig 11.3, page 266.

73
Water/Phenol Mixture As seen earlier for a liquid- liquid mixture RO is a good choice. The common feed pressure range is atm with a porous to non-porous membrane. The equations used for calculations are as follows: Overall Material Balance: where qF ,qR ,qP are volumetric flowrates per module of feed, permeate and retentate respectively. The volumetric flowrate per module is given by: Where ‘QF’ is the total feed volumetric flowrate and ‘n’ is the number of modules.

74
DP = Pressure difference, pF = OP of feed,
3) Component Material Balance on solute: where, CF, CP and CR are the concentrations of solute in the feed, permeate and reject respectively. 4) Water Flux: where, DP = Pressure difference, pF = OP of feed, CF = solute concentration in the feed CS = average solute concentration in the shell side, and A = solvent permeability
 Component Material Balance on solute: where, CF, CP and CR are the concentrations of solute in the feed, permeate and reject respectively. 4) Water Flux: where, DP = Pressure difference, pF = OP of feed, CF = solute concentration in the feed. CS = average solute concentration in the shell side, and. A = solvent permeability.")
75
4b) Also, the pressure difference across the membrane is :
4a) And g is given by: Where, and 4b) Also, the pressure difference across the membrane is : or where PF ,PR ,PP are pressures of feed, reject and permeate. 4c) The concentration of solute in the shell is calculated as follows:
 And g is given by: Where, and. 4b) Also, the pressure difference across the membrane is : or. where PF ,PR ,PP are pressures of feed, reject and permeate. 4c) The concentration of solute in the shell is calculated as follows:")
76
Nsolute = solute transport parameter * CS
5) Solute Flux: Nsolute = solute transport parameter * CS 6) Permeate Flowrate: where, Sm is the hollow fiber surface area per module. 7) Permeate Concentration:
 Solute Flux: Nsolute = solute transport parameter * CS. 6) Permeate Flowrate: where, Sm is the hollow fiber surface area per module. 7) Permeate Concentration:")
77
Valid for highly rejecting membranes, when
Considering most of the solute is retained in the reject, equation 3) can be simplified to: Valid for highly rejecting membranes, when Combining these equations with equation 4) we get the following: Hence, The last equation is a quadratic equation that can be solved for CR. Once this is done we can calculate equations 4) through 7) to obtaining the end permeate concentration. If this concentration does not satisfy the target concentration, new values for parameters such as n, PF or different system configurations has to be proposed.
 can be simplified to: Valid for highly rejecting membranes, when. Combining these equations with equation 4) we get the following: Hence, The last equation is a quadratic equation that can be solved for CR. Once this is done we can calculate equations 4) through 7) to obtaining the end permeate concentration. If this concentration does not satisfy the target concentration, new values for parameters such as n, PF or different system configurations has to be proposed.")
78
COST ANALYSIS TAC = Annualized fixed cost of modules + Annualized fixed cost of pump Annualized fixed cost of pumps ($/yr)= 0.0157[flow rate through pump (kg/s)* pressure difference across pump (N/m2)]0.79 Annualized fixed cost of RO modules (including annualized installed cost, membrane replacements, labor and maintenance)= 1,140 Cost of electric power= 0.06 $/kW hr The mechanical efficiency of pumps and turbines was considered as 65%
* pressure difference across pump (N/m2)]0.79. Annualized fixed cost of RO modules (including annualized installed cost, membrane replacements, labor and maintenance)= 1,140. Cost of electric power= 0.06 $/kW hr. The mechanical efficiency of pumps and turbines was considered as 65%")
79
RESULTS OF HFRO CALCULATION
By doing HRFO calculations many different solutions can be obtainded for this problem depending on the modules configuration and the cost analysis. The following figure is one solution, where the target composition is not achieved. QF=29.2kg/s CF=47.9 ppm n max= 63 R P QP=4.03kg/s CP=35.99 ppm QF=25.17kg/s CR=55.62 ppm Alimentación

80
RESULTS OF HFRO CALCULATION
The following diagram shows another solution to our problem, in this solution the target composition is lower but as in the last case, the target composition is not achieved. Many configurations were tried and no one of them gave satisfactory results because the composition of the permeate was not the desired. R P CF=47.9 ppm QF=29.2kg/s n max= 63 QF=25.17kg/s CR=55.62 ppm QF=12.08kg/s CR=35.99 ppm CR=27.05 ppm QF=1.7kg/s CR=41.88 ppm QR=10.38kg/s Alimentación QF=87.59kg/s CF=47.95ppm QP=4.03kg/s CP=35.99 ppm

81
OBSERVATIONS AND RECOMMENDATIONS FOR RO CALCULATIONS
The foregoing equations assume that membrane performance is time independent, this means the effects of reduction in permeability are not considered. The permeate stream should meet two requirements: The permeate flowrate should be no less than a given flowrate: The concentration of the undesirable components in the permeate should not exceed a certain limit generally settled by an environmental regulation. The flowrate per module is typically bounded by manufacturer’s constraints:

82
PP is typically atmospheric.
It is advisable to maintain moderate to low feed pressure to avoid the increase of the costs. Also in order to reduce the TAC, the number of modules should be minimum and to get that, the flowrate per module must be maximum. In some cases it is useful to recover energy from the retentate (just when the value of recovered energy is higher that the cost of recovering it), to do it is necessary to feed this stream to a turbine. In those cases the annualized fixed cost of turbines must be added to the TAC: Annualized fixed cost of turbines ($/yr)= 0.4182[flow rate through turbine (kg/s)* pressure difference across turbine (N/m2)]0.47 Feed Reject Permeate QF CF PF QR CR PR QP PP
, to do it is necessary to feed this stream to a turbine. In those cases the annualized fixed cost of turbines must be added to the TAC: Annualized fixed cost of turbines ($/yr)= [flow rate through turbine (kg/s)* pressure difference across turbine (N/m2)]0.47. Feed. Reject. Permeate. QF. CF. PF. QR. CR. PR. QP. PP.")
83
STEAM STRIPPING ¿Why Steam Stripping?
Ammonia and phenol contents are high and cyanides which are anions of Ammonia make some of the biological treatments involving nitrification/denitrification wasteful2. 2 R. Marr and M. Koucar, Recovery of ammonia from industrial wastewater. Int. Chem. Eng (1993), p. 416
, p")
84
Steam Stripping A wastewater stream is contacted with steam in a packed or trayed tower. The combined effects of the steam and heat causes pollutants (phenols and ammonia) to transfer from the liquid to the vapor phase. The pollutants are carried out with the vapour. The contacting continues down the tower, making the wastewater leaner in the organic material while the vapor phase richer in pollutants as it travels up the tower. The wastewater is fed at the top of the tower. The injected steam at the bottom of the tower provides the required heat and vapor flow. Clean water leaves as bottoms while the pollutants leave the top heavily laden with organic material. This steam/organic combination is condensed and processed later. The principal feature of steam stripping is that a contaminated wastewater and steam are injected into the tower which results in clean water as the end product. Steam Stripping A wastewater stream is contacted with steam in a packed or trayed tower. The combined effects of the steam and heat causes pollutants (phenols and ammonia) to transfer from the liquid to the vapor phase. The pollutants are carried out with the vapour. The contacting continues down the tower, making the wastewater leaner in the organic material while the vapor phase richer in pollutants as it travels up the tower. The wastewater is fed at the top of the tower. The injected steam at the bottom of the tower provides the required heat and vapor flow. Clean water leaves as bottoms while the pollutants leave the top heavily laden with organic material. This steam/organic combination is condensed and processed later. The principal feature of steam stripping is that a contaminated wastewater and steam are injected into the tower which results in clean water as the end product.
 to transfer from the liquid to the vapor phase. The pollutants are carried out with the vapour. The contacting continues down the tower, making the wastewater leaner in the organic material while the vapor phase richer in pollutants as it travels up the tower. The wastewater is fed at the top of the tower. The injected steam at the bottom of the tower provides the required heat and vapor flow. Clean water leaves as bottoms while the pollutants leave the top heavily laden with organic material. This steam/organic combination is condensed and processed later. The principal feature of steam stripping is that a contaminated wastewater and steam are injected into the tower which results in clean water as the end product. Steam Stripping. A wastewater stream is contacted with steam in a packed or trayed tower. The combined effects of the steam and heat causes pollutants (phenols and ammonia) to transfer from the liquid to the vapor phase. The pollutants are carried out with the vapour. The contacting continues down the tower, making the wastewater leaner in the organic material while the vapor phase richer in pollutants as it travels up the tower. The wastewater is fed at the top of the tower. The injected steam at the bottom of the tower provides the required heat and vapor flow. Clean water leaves as bottoms while the pollutants leave the top heavily laden with organic material. This steam/organic combination is condensed and processed later. The principal feature of steam stripping is that a contaminated wastewater and steam are injected into the tower which results in clean water as the end product.")
85
Aspen RADFRAC The steam stripping process culminates to give a clean water stream with trace amounts of ammonia and phenol (stream 2). Stream 4 contents high levels of phenol and ammonia that come along with around 25% of the water amount in stream 1. In stream 3 there are no products since the condenser has a distillation fraction of zero. The RADFRAC feature of Aspen used for the simulation of separation process is shown in the figure to the right.
. Stream 4 contents high levels of phenol and ammonia that come along with around 25% of the water amount in stream 1. In stream 3 there are no products since the condenser has a distillation fraction of zero. The RADFRAC feature of Aspen used for the simulation of separation process is shown in the figure to the right.")
86
Steam Stripping with Aspen
Aspen simulation was used for the steam stripping process. The configuration for the setup are given in table 1.1. Further, the temperature used is 200oF near boiling point of water and a pressure of 14.7 psia, close to atmospheric pressure. Setup and operating specifications for steam stripping using Aspen RADFRAC Number of stages 30 Condenser Parcial-V-L Reboiler Kettle Valid Phases V-L Temperature 200 ªF Pressure 14.7 psia Distillate to feed ratio (mole) 0.25
")
87
RESULTS Results of simulation for water-phenol-ammonia by stream stripping STREAM 1 2 3 4 Temperature F 200 Pressure psi 14.7 26.25 19 Vapor Frac Mole Flow lbmol/hr Mass Flow lb/hr Volume Flow cuft/hr Enthalpy MMBtu/hr AMMON-01 6.59E-35 WATER 695150 PHENO-01 Mass Fraction 8.39E-05 1.26E-35 4.79E-05 1.17E-07 0.117 ppm Using the setup shown in figure1.1 and running the Aspen simulations, resulted in the data recorded in the table to the right. Stream 1:Total Feed = lb/hr Stream 2: Water = lb/hr (Trace ammonia and Phenol). Stream 3: Condenser set to zero, no condensation. Stream 4: Water = lb/hr Stream 2 has mostly water and phenol concentration of ppm complying with CFR regulations, while water-phenol-ammonia separation in stream 4 can be furthered using other suitable separation processes.
. Stream 3: Condenser set to zero, no condensation. Stream 4: Water = lb/hr. Stream 2 has mostly water and phenol concentration of ppm complying with CFR regulations, while water-phenol-ammonia separation in stream 4 can be furthered using other suitable separation processes.")
88
Conclusions The most suitable separation technique in according to the separation achieved and the cost analysis was steam stripping. Phenol is poorly rejected by RO membranes so the cost of applying this technique is not justified. Notwithstanding the foregoing, membrane techniques are a good option since can reach high purity levels which can be cheaper in long term. Some membrane techniques can be combined with conventional methods for the treatment of effluents (hybrid processes). Conventional treatment methods as distillation and adsorption and membrane techniques not studied in this tier as pervaporation or membrane–based solvent extraction can be used for the removal of phenol and ammonia. Kujawski and co-workers studied several separation techniques with this purpose (Removal of phenol from wastwater by different separation techniques)
. Conventional treatment methods as distillation and adsorption and membrane techniques not studied in this tier as pervaporation or membrane–based solvent extraction can be used for the removal of phenol and ammonia. Kujawski and co-workers studied several separation techniques with this purpose (Removal of phenol from wastwater by different separation techniques)")
Similar presentations


>")


. • Liquid membranes. • Pervaporation.>")


