Download presentation
Presentation is loading. Please wait.

1
Preventing Coordinate-System Confusion (maybe?)
Montana Association of Registered Land Surveyors 2008 Convention Bozeman, Montana 07 & 08 February 2008 Glenn Borkenhagen Inland GPS Inc. - Cody, Wyoming

2
Prerequisite for this session:
What is the radius of the earth? One popular number - approximately 20,906,000 feet Suggest just remembering 21 million feet, less than 0.5% difference from value above

3
Preview - Brief discussion of metadata
How we got to where we are today and why things are different now Projections oversimplified – 3D to 2D Some communications issues Possible pitfalls Knowing the geoid The NAD27 beast But wait! There’s more! 1.5 rants!

4
Today’s objectives Discuss how we can communicate the information (geospatial metadata) that will help everyone get on the same coordinate system with as little trouble as possible Consider how we can use geospatial metadata to work more effectively
 that will help everyone get on the same coordinate system with as little trouble as possible. Consider how we can use geospatial metadata to work more effectively.")
5
Why is metadata a valuable part of a data set?
Organize your data (Do you know what you have?) Provide information about your data holdings (Can you describe to someone else what you have?) Provide information to data users (Can they figure out if your data is useful to them?) Maintain the value of your data (Can anyone figure out if your data is useful 20 years from now?)
 Provide information about your data holdings (Can you describe to someone else what you have ) Provide information to data users (Can they figure out if your data is useful to them ) Maintain the value of your data (Can anyone figure out if your data is useful 20 years from now )")
6
1990-vintage project Dawn of widespread use of data collectors that offered convenient field cogo Was still difficult and expensive to tie to national control

7
How surveying was/is done with optical instruments -
Measurements made with instrument generally at or close to one end of line This creates a tangent-plane projection at each setup, measurements reduced to coordinates on these projections Everything usually melds together, traverse loops close well

8
And the bearings? Usually one line picked to be the basis of bearings
Bearings carried from that point are based on observed angular relationships and are not adjusted for convergence of meridians Loop traverses close fine, no problem

9
Why coordinate-system details used to be a non-issue
Everyone used essentially the same methods Had to be in close to the same location to measure the same points

10
You may have noticed - “Horizontal distance” of a sloped line is longer when measured from higher end than when measured from lower end. If you checked bearing with celestial observations while traversing in east-west direction, you probably witnessed the effect of convergence of meridians

11
Then came RTK GPS All measurements reduced to coordinates on a single projection surface This single projection surface is often used over long distances, especially in route surveys Many long-distance measurements

12
Selling RTK GPS to surveyors -
Potential market would have been very limited without some way to easily adapt to existing (often arbitrary) coordinate systems already established in cities, mines, subdivisions, etc. Localization, calibration, whatever to the rescue!
 coordinate systems already established in cities, mines, subdivisions, etc. Localization, calibration, whatever to the rescue!")
13
Map projection - Definition from U. S
Map projection - Definition from U.S. Geological Survey: The systematic representation of all or part of the surface of the Earth on a plane or developable surface A projection is a function that relates points on one surface to points on another surface so that for every point on the first surface there corresponds exactly one point on the second surface In the surveying world, the surfaces referred to in the preceding paragraph are usually the ellipsoid and a plane developed from the projection surface

14
Projection surfaces Three basic projection surfaces -
Plane, cylinder, and cone Three ways to relate the projection surface (grid) to the datum surface - Tangent to the ellipsoid Secant – intersecting the ellipsoid “Suspended” – above the ellipsoid
 to the datum surface - Tangent to the ellipsoid. Secant – intersecting the ellipsoid. Suspended – above the ellipsoid.")
15
Grid scale factor (not to worry!)
Multiply distance on datum surface (ellipsoid) by grid scale factor to get grid distance
 by grid scale factor to get grid distance.")
16
Notice that central-meridian scale factor is less than unity

17
Projection parameters -
For a Transverse Mercator projection – Origin latitude Origin longitude False northing False easting Central-meridian scale factor

18
Those parameters tell a lot -
Obviously the location of the projection Central-meridian scale factor tells us the vertical location of the projection surface (grid)
")
20
Projection parameters -
For a two-parallel Lambert projection – Origin latitude Origin longitude False northing False easting Latitude of south standard parallel Latitude of north standard parallel

21
Remember the word “developed” from projection definition?

22
What are these “ground coordinates?”
(Rant on) – The terms “ground” and “grid” often contribute to confusion and miscommunication No standard definition for “ground coordinates”, so cannot assume the world knows what that term is supposed to mean (rant off) Main reason for prerequisite
 – The terms ground and grid often contribute to confusion and miscommunication. No standard definition for ground coordinates , so cannot assume the world knows what that term is supposed to mean (rant off) Main reason for prerequisite.")
23
“Ground” coordinate systems
Usual objective is to have the distance from a simple two-dimensional inverse between coordinate pairs be close to the on-the-ground distance between the two points Projection surface (grid) moved to be close to ground elevation Several popular methods of producing so-called ground coordinates, all are a compromise It is strongly recommended to change coordinate values so the project coordinates do not look like state plane.
 moved to be close to ground elevation. Several popular methods of producing so-called ground coordinates, all are a compromise. It is strongly recommended to change coordinate values so the project coordinates do not look like state plane.")
25
As always, life is compromise
Any attempt to reduce the three-dimensional world to a two-dimensional representation will have tradeoffs Polygons annotated with mean-true bearings will appear to misclose when checked with simple plane coordinate geometry Maybe software should provide rigorous inverse calculations? No apparent movement in that direction

26
Using the toolkit we have today
A common approach is to make a custom projection where the projection surface (grid) is at approximate ground elevation Simple inverse will return a distance very close to ground distance Locating the projection origin within the working area minimizes effects of convergence of meridians
 is at approximate ground elevation. Simple inverse will return a distance very close to ground distance. Locating the projection origin within the working area minimizes effects of convergence of meridians.")
27
Arc distance equals radius times angle (in radians)
Arc distance equals radius times angle (in radians). As radius increases, arc distance increases in direct proportion.
. As radius increases, arc distance increases in direct proportion.")
28
A simple example - Created a Transverse Mercator projection with projection surface (grid) at 3600 feet elevation Software indicated the central-meridian scale factor was , or about 172 ppm greater than unity 21 feet is one ppm of the 21-million-foot earth radius 172 ppm x 21 feet/ppm equals 3,612 feet

29
Example from a Federal Highway Administration project -
Control-points listing sheet includes: NAD83 (1993) geographic (latitude and longitude) State-plane coordinates in the Wyoming West Central (WY 4903) zone Project-specific grid coordinates (on a surface approximating ground elevation)
 geographic (latitude and longitude) State-plane coordinates in the Wyoming West Central (WY 4903) zone. Project-specific grid coordinates (on a surface approximating ground elevation)")
30
Also a detailed description of how project coordinates were determined
Note: Project coordinates were determined by first subtracting 192, from the state-plane northing value and 388, from the easting. Then multiplying the result by a factor of Station 3088 has a value of North = 50,000, East = 200,000.

31
Typical coordinate-scaling method
Wyoming West zone, DAF = New projection parameters - multiply regular zone parameters by DAF Origin stays at same geographic position False northing goes from 100,000 meters to 100, meters False easting goes from 800,000 meters to 800, meters. Central-meridian scale factor increases from to

32
Some common problems Too often users have to start from a list of grid coordinates with no information on the projection used to create coordinates. Better way - make special projection for this project that incorporates the datum-adjustment factor Because the scaling is done by simply multiplying all coordinates by DAF, the origin of the scaling is 0,0.

33
What are those coordinates?
Know how to provide your coordinate-system parameters to others Know what to ask others about the coordinates they have provided to you This information should be brand independent Separate document or included in the coordinate file Perhaps provide a couple of checks?

34
Combined scale factor Obtained by multiplying grid scale factor times elevation factor Multiply distance on ground by combined scale factor to get grid distance Useful as a check to see if your projection surface is close to the ground elevation

35
Convergence of meridians
Meridians converge - lines going straight north get closer together as they approach pole On a sphere - convergence is delta longitude times sine latitude. At 47 degrees north - one mile east-west is about 1’ 11.7” change in longitude Convergence at 47 degrees north is about 56 arc seconds per mile by this quick approximation 50-mile route survey - almost 47 arc minutes!

36
Montana example - Start at point at 47 N lat, 111 W long
Go 1 mile straight north, one mile east (mean true bearing), one mile straight south, one mile west (again, mean true bearing). Misclosure around 1.41 feet (1:14,979??) Recall 56 arc seconds per mile? Sin 56” x 5280 = 1.43 feet
, one mile straight south, one mile west (again, mean true bearing). Misclosure around 1.41 feet (1:14,979 ) Recall 56 arc seconds per mile Sin 56 x 5280 = 1.43 feet.")
37
Possible basis-of-bearing statement on Certificate of Survey
"Bearings on this Certificate of Survey are based on the mean of (number) hour-angle solar observations taken at (identify recoverable point shown on COS). Bearings carried from that point are based on observed angular relationships and have not been adjusted for convergence of meridians.” Thanks to Warren Latvala, PLS
 hour-angle solar observations taken at (identify recoverable point shown on COS). Bearings carried from that point are based on observed angular relationships and have not been adjusted for convergence of meridians. Thanks to Warren Latvala, PLS.")
38
Consider this statement
Bearings are geodetic north as determined by GPS Remember that grid north equals geodetic north only along the central meridian. If bearings were determined simply by inversing between grid coordinates the bearings are grid bearings This statement is not very accurate or helpful in most cases!

39
How not to do it

40
Other basis-of-bearing statements
“Geodetic determined by GPS observations using survey-grade receivers on found monumentation” “GPS observation of astronomic north as per (referenced another CoS) and with all other bearings contained herein referenced thereto”
 and with all other bearings contained herein referenced thereto")
41
And some more - “GPS observation of North at NE corner of Section X”
“GPS observations at NW corner of Section X, distances shown are ground” “Grid north per Montana Coordinate System NAD 83 as determined by GPS observation at DMS.sssss North latitude DMS.sssss West longitude. Convergence angle is DMS.sssss.

42
And another one - Basis of bearing is true north obtained by GPS (NAD 83) from an OPUS solution. The bearings and distances shown are from a Transverse Mercator Ground projection with a semi major axis of ift and a flattening of 1/f = Projection Origin: Latitude DMS.sssss N, Longitude DMS.sssss W False Origin: False Northing ift False Easting ift Rotation 000'00", Projection scale factor of Distances shown are surface distance in International feet. Said origin point lying South DMS West, 10, ft from the southwest corner of Section 35, Township Y North, Range X East of the P.M.M.
 from an OPUS solution. The bearings and distances shown are from a Transverse Mercator Ground projection with a semi major axis of ift and a flattening of 1/f = Projection Origin: Latitude DMS.sssss N, Longitude DMS.sssss W False Origin: False Northing ift False Easting ift Rotation , Projection scale factor of Distances shown are surface distance in International feet. Said origin point lying South DMS West, 10, ft from the southwest corner of Section 35, Township Y North, Range X East of the P.M.M.")
43
Suggestion from Borky -
“Bearings and distances shown are grid bearings and grid distances on a Transverse Mercator projection with origin at DMS.sssss North latitude and DMS.sssss West longitude NAD 83 (CORS96) and with a central-meridian scale factor of 1.000XXXXXX”. Distances are [surface distances?] in (specify units).
 and with a central-meridian scale factor of 1.000XXXXXX . Distances are [surface distances ] in (specify units).")
44
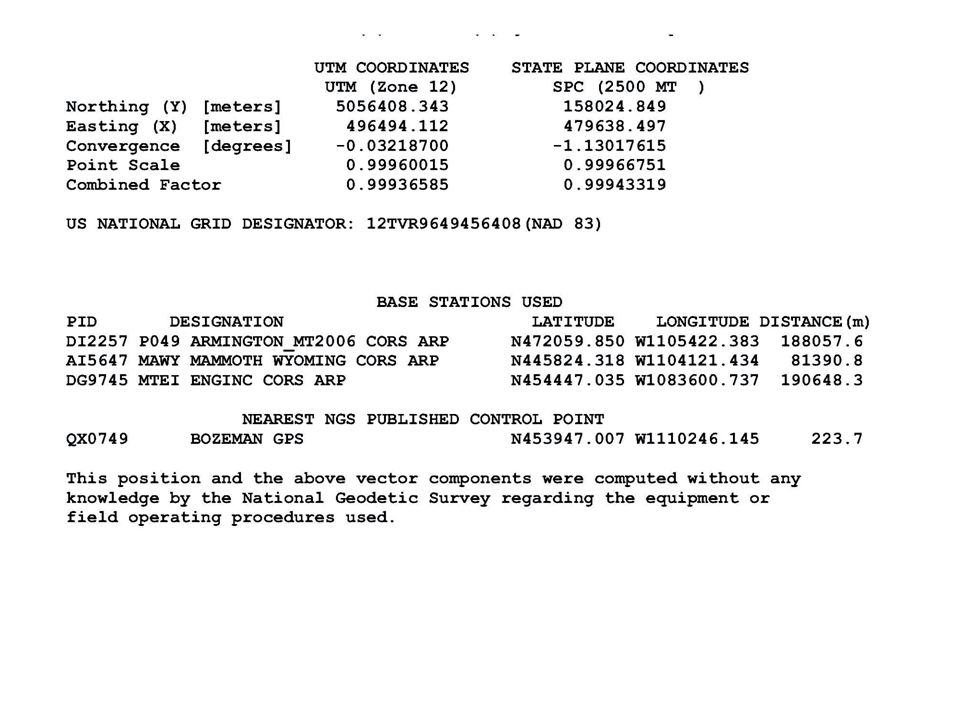
Now let’s tie it down Getting an accurate georeferenced position now takes ten minutes or less of additional work – why not do it? National Geodetic Survey – Online Positioning User Service (OPUS)
")
45
OPUS Rapid Static (OPUS-RS)
Designed to handle GPS data sets as short as 15 minutes Promoted to Initial Operation Capability on 31 January 2007 Conditions apply – you must be fairly close to CORS receivers

46
Call it by the correct name
The datum is NAD 83 (CORS96); CORS96 identifies the adjustment The NAD 83 datum has small velocities so you also need to specify the epoch. The current standard epoch date for reporting NAD 83 (CORS96) is 01 January 2002. You would normally state the following: NAD 83 (CORS96), Epoch or NAD 83 (CORS96)
; CORS96 identifies the adjustment. The NAD 83 datum has small velocities so you also need to specify the epoch. The current standard epoch date for reporting NAD 83 (CORS96) is 01 January You would normally state the following: NAD 83 (CORS96), Epoch or NAD 83 (CORS96)")
49
Now that you have this accurate position -
Include it in your geospatial metadata Provide to others as appropriate and when it will help.

50
Know what your system does for (or to) you.
 you.")
51
One example – Calibration output determined by situation
Projection Datum Transformation Calibration output Yes Horizontal and vertical adjustment No Datum transformation, horizontal and vertical adjustment Transverse Mercator projection, horizontal and vertical adjustment Transverse Mercator projection, zero datum transformation, horizontal and vertical adjustment

52
Pros and cons of RTK GPS Pro – Modern RTK GPS systems and their office software are powerful and flexible enough to handle many different survey methodologies Con – Modern RTK GPS systems and their office software are powerful and flexible enough to handle many different survey methodologies

53
A borrowed pearl of wisdom –
(Name of data-collector software) and (name of office software) expect that the user knows EXACTLY what he/she is doing ALL of the time AND why he/she is doing it. These tools will do exactly what you tell them to do, whether it makes sense or not." Thanks to Scott Partridge of Calgary
 and (name of office software) expect that the user knows EXACTLY what he/she is doing ALL of the time AND why he/she is doing it. These tools will do exactly what you tell them to do, whether it makes sense or not. Thanks to Scott Partridge of Calgary.")
54
Using the correct tool for the job
Do not assume that localization or calibration is the right method in every situation Use original parameters if they can be obtained or determined Know how to generate the projection you need Remember that you can still use vertical calibration even if you do not apply a horizontal calibration.

55
Use common sense Do not calibrate/localize to unchecked control.
If things are not fitting, find out why Even if things seem to fit, know how to evaluate the results to see if you are getting what you need

56
Down the road - Local system fine for immediate project, but please consider how it will affect you in the future Contiguous or overlapping projects Other possible uses for data, not foreseen when data was collected More data users may want to know basis of coordinates Spend some time to understand projections - it will pay off now and in the future!

57
Vertical issues In most cases the geoid model provides excellent information on trends in an area, may have a local bias Try using only one vertical point in calibration/localization to correct bias, use other vertical points as checks Beware the common situation where vertical control is in a straight line

58
Know what to expect for the geoid slope in your area

59
Have a limit-of-reality value in mind
Very little of Montana has a geoid slope greater than 40 ppm Maximum about 155 ppm If you do a vertical localization, calibration, whatever, know how your results compare to expected values

60
Beware the list of coordinates
Even when they are your own!

61
Township 20N Range 1W PMM

62
Started project first time
Started at SW corner of Sec 31, assigned grid coordinates of 20,000.00N, 50,000.00E This created a Transverse Mercator projection with origin at that point. As it works out, NE corner of Sec 1 is 51,911.68N, 81,507.61

63
User returns to T20NR1W Years have passed, computers replaced, files lost, personnel changes, etc. Uses only list of grid coordinates, this time NE corner of Section 1 is more convenient New coordinate system started, this time origin is at NE corner of Section 1, same grid coordinates at that point as before Now coordinates of SW corner of Section 31 are 20,051.72N, 49,947.70E New SW point is ft to the northwest

64
Almost 74 feet difference!!
Remember our simple convergence formula Change in longitude between two origins is close to 0-07’-39”, distance between origins is about 44,845 feet. Average latitude is Put these together and get a convergence of 05’ 38.3”, shift of feet Could now use localization/calibration

65
The NAD 27 beast Clients continue to demand NAD 27 results, probably because they are using 1:24,000 USGS quad sheets for base maps No simple conversion between NAD 27 and NAD 83 Even best transformations have limitations Understand the purpose for which the transformation methods and parameters were derived

66
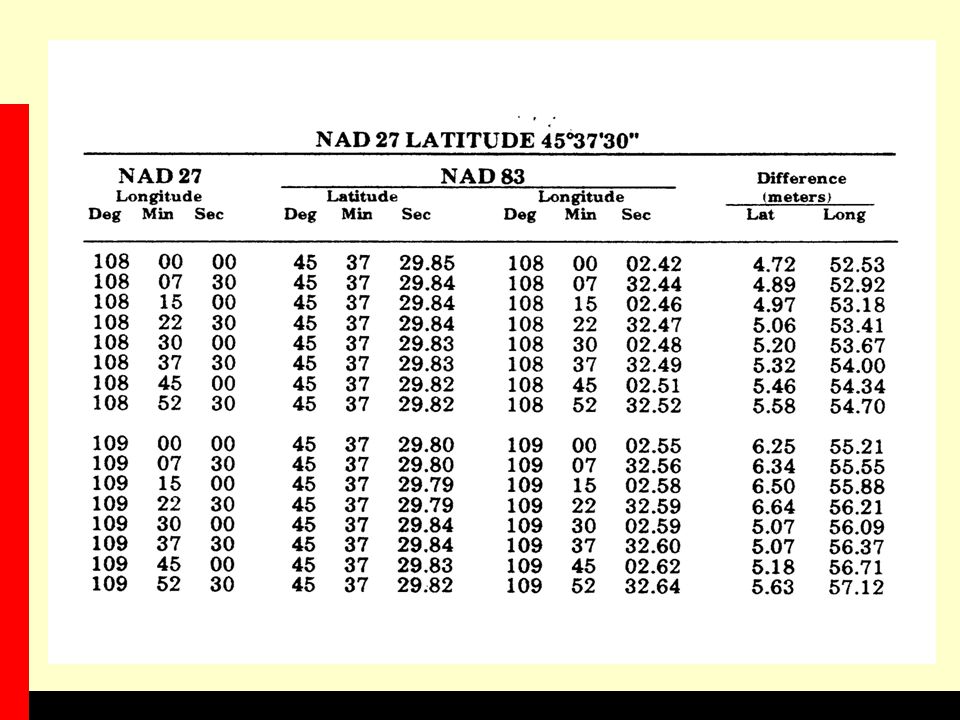
Grid-shift method (NADCON)
Best way for most survey purposes - incorporates much control available in the local area. Algorithms and data built into most GPS survey and mapping software

67
In the old days (1989 or so) -
 -")
69
Point Greybull (PX0056) Was first-order point in NAD 27, now A-order point in NAD 83 (1993) Compare results from NADCON and other method: Using NADCON is a two-step process Starting from NAD 83 (1993) – the HARN position, formerly called HPGN First, convert from NAD 83 (1993) to NAD 83 (1986) Second, convert from NAD 83 (1986) to NAD 27 Transformation from NAD 83 (1993) to NAD 27 using NADCON agrees with published NAD 27 position within 0.11 foot.
 – the HARN position, formerly called HPGN. First, convert from NAD 83 (1993) to NAD 83 (1986) Second, convert from NAD 83 (1986) to NAD 27. Transformation from NAD 83 (1993) to NAD 27 using NADCON agrees with published NAD 27 position within 0.11 foot.")
70
Point Greybull (PX0056) Using a datum called “NAD 1927 (Western US)”
Molodensky 3-parameter transformation ΔX = ft, ΔY = ft ΔZ = ft About feet horizontal from published NAD 27 For what purpose was this transformation designed? Probably for making a map of the entire Western United States, not for working accurately between local control monuments.

71
Taming the NAD 27 beast Do the work using the best available modern NAD 83 (latest adjustment) control Use proper NADCON method to convert to NAD 27 if required to produce a deliverable on that datum Compare output with available NAD 27 control within project – there probably will not be much, most will be third-order points intended only for mapping Have a basic understanding of map-accuracy standards Be aware that digitized positions from 7.5-minute USGS quads can be off by tens of feet and still be within map-accuracy standards. Demonstrate this using control points that appear on digitized map

72
I measured it with my total station!
Assuming you used a fairly accurate temperature, what did you use for barometric pressure? The so-called barometric pressure on the weather report is adjusted for elevation (mini rant) Can generally figure barometric pressure is close to 30 inch Hg at sea level and decreases about 1 inch Hg for every 1000 feet elevation. At 4000 feet elevation, the difference is about 37 ppm, or about 0.20 foot in a mile. The difference will be greater at higher elevations.
 Can generally figure barometric pressure is close to 30 inch Hg at sea level and decreases about 1 inch Hg for every 1000 feet elevation. At 4000 feet elevation, the difference is about 37 ppm, or about 0.20 foot in a mile. The difference will be greater at higher elevations.")
73
For your toolkit -

Similar presentations


 Francisco Olivera, Ph.D., P.E. Center for Research in Water Resources University of Texas at Austin.>")


 and the Defense Mapping School Reviewed by:____________ Date:_________ Objective:>")


