Download presentation
Presentation is loading. Please wait.

1
Plethysmography

2
Standard PF Plethysmograph
Spirometry Spirometry Diffusion Capacity Diffusion Capacity Lung Volumes Lung Volumes MIP/MEP MIP/MEP Thoracic Gas Volume Airways Resistance

3
Myths Plethysmography is too difficult for the patient.
Plethysmography is too expensive Plethysmography is too complex and useful only as a research tool. My it will be torture for my patients 3 3

5
5 5

6
What does it measure? Flow (Volume) Mouth Pressure Box Pressure 6 6
 Mouth Pressure Box Pressure 6 6")
7
How does it measure? Mouth Pressure Xducer Pneumotachometer (Flow)
Box Pressure Transducer

8
How Does It Work? As the patient pants against the closed shutter, pressure change is measured in the box and at the mouth 8 8

9
Assumptions Mouth Pressure (Pm) is equal to alveolar pressure (Palv)
Abdominal gas does not effect the measurement 9 9

10
Pascal’s Principle How Does It Work?
In a fluid or gas filled circuit, pressure applied at any point is felt equally throughout the circuit This assumption must be true for results to be valid P3 P2 10 10

11
Why Calculate lung volumes
A restrictive ventilatory defect is characterized by a reduction in TLC below the 5th percentile of the predicted value Below the lower limits of normal

12
Why Determine Lung Volumes
ERS/ATS: The presence of a restrictive ventilatory defect may be suspected when VC is reduced. A reduced VC by itself does not prove a restrictive ventilatory defect. 12 12

13
Why Determine Lung Volumes
ERS/ATS: A reduced FVC is associated with a low TLC only 50% of the time or less. 13 13

14
Lung Volumes Thoracic Gas Volume (TGV) also called FRCpleth – the volume of air in the lungs at the end of a normal exhalation We are after Total Lung Capacity (TLC); however, TLC is not measured directly. 14 14
; however, TLC is not measured directly")
15
Lung Volumes TLC = TGV (FRC) + Inspiratory Capacity (IC)
TLC = Residual Volume (RV) + VC RV = TGV - ERV 15 15
 + VC. RV = TGV - ERV")
16
Lung Volumes 16 16

17
Determination of FRC Multiple breath gas dilution Nitrogen Washout
Helium Dilution TGV via Body Plethysmography Imaging Techniques (radiology) Planimetry CT/MRI
 Planimetry. CT/MRI.")
18
Determination of FRC ACCP Scientific Section Recommendation:
In patients with airway obstruction the dilution method underestimates the thoracic gas volume to the extent that depends on the severity of the obstruction. The plethysmographic method measures the total compressible gas including that of poorly ventilated areas. Murray, Crapo, et al ,1982 18 18

19
Determination of FRC Dilution methods measure only communicating airways and therefore can significantly underestimate true lung volume.

20
FRC by Plethysmography = 2L
FRC by Dilution = 2L FRC by Plethysmography = 2L

21
FRC by Plethysmography = 2L
Obstructed airway FRC by Dilution = 1 L FRC by Plethysmography = 2L

22
Determination of TLC via Single Breath
Single breath inert gas dilution (DLco) Helium, Neon, Methane Alveolar Volume (VA) approximates TLC Single breath techniques further underestimate lung volume due to reduced time for equilibration. 22 22
 Helium, Neon, Methane. Alveolar Volume (VA) approximates TLC. Single breath techniques further underestimate lung volume due to reduced time for equilibration")
23
Plethysmography vs. Dilution
Decreases test time – One N2 washout or helium dilution can take up to 7-8 minutes. If you have to repeat, this takes an additional 7-8 minutes after waiting for gas to clear lungs Plethysmography can perform several efforts in 3 minutes 23 23

24
Clinical Indications To distinguish between restrictive and obstructive disease patterns, particularly in the presence of a reduced VC To diagnose restrictive disease patterns To provide an index of gas trapping (plethysmography vs gas dilution) Assess response to therapeutic intervention AARC Clinical Practice Guideline 24 24
 Assess response to therapeutic intervention. AARC Clinical Practice Guideline")
25
TGV - How Does It Work? P P` Boyle’s Law P1V1 = P2V2 V` V

26
TGV - How Does It Work? Solving for P1 V1 = PB • (V / P) P1V1 = P2V2
P1 = barometric Pressure* V1= thoracic gas volume P2 = P1 + delta P V2 = V1 - delta V Solving for P1 V1 = PB • (V / P) 26 26
")
27
Testing Sequence(1st Choice)
Measure ERV after the acquisition of the FRC measurement followed by slow IVC maneuvers that are linked FRC reported – mean of technically acceptable FRC measurements (CV 5% = difference between highest and lowest values divided by the mean ≤ .05) linked to technically acceptable ERV and IC measurements used for calculating RV and TLC Acceptable IC’s CV 5% +/- 3% (obstructed)
 linked to technically acceptable ERV and IC measurements used for calculating RV and TLC. Acceptable IC’s CV 5% +/- 3% (obstructed)")
28
Testing Sequence 1ST Choice

29
Testing Sequence 2nd Choice
Perform IC immediately after the FRC measurement to TLC This method might work better for those who have severe COPD TLC = FRC + IC

30
Airways Resistance (Raw)
")
31
Airways Resistance (Raw)
Airways Resistance can be thought of as how much work (driving pressure) the patient has to do simply to breath. 31 31
 the patient has to do simply to breath")
32
Airway Resistance (Raw)
Increased Raw is the primary finding in Obstructive Airways Disease May be caused by bronchospasm, compression or consolidative filling 32 32

33
Airways Resistance (Raw)
Airways Resistance - Pressure cmH2O/L/sec Conductance (Gaw) – Flow L/sec/cmH20 Gaw is the reciprocal of Raw 1/Raw 33 33
 – Flow. L/sec/cmH20. Gaw is the reciprocal of Raw. 1/Raw")
34
Airways Resistance (Raw)
Airways Resistance - Pressure cmH2O/L/sec sRaw (Raw relative to lung volume) Raw x Vpant Conductance (Gaw) – Flow L/sec/cmH20 sGaw (Gaw relative to lung volume) Gaw/Vpant 34 34
 Raw x Vpant. Conductance (Gaw) – Flow. L/sec/cmH20. sGaw (Gaw relative to lung volume) Gaw/Vpant")
35
Airways Resistance (Raw)
COPD patient - Raw sRaw sGaw Compensatory Hyperinflation 35 35

36
Airway Resistance Effort independent assessment of airway caliber !
If pressure is constant which will conduct more flow?

37
Flow rate is proportional to the 4th power of a pipe’s radius.
Poiseuille’s Law (Pdriving)(pi)(radius4) Flow = (8)(Length)(viscosity) Flow rate is proportional to the 4th power of a pipe’s radius. 37 37
(pi)(radius4) Flow = (8)(Length)(viscosity) Flow rate is proportional to the 4th power of a pipe’s radius")
38
Poiseuille’s Law You need 16 tubes to pass as much fluid as one tube twice their diameter. 38 38

39
Airway Resistance Since resistance is related most strongly to total cross sectional area rather than length, the majority of resistance in normal lungs resides in the larger airways P1 P2 P3B P3A P3B2 P3A1 P3B1 P3A2

40
Airways Resistance In summary, what proportion of the total airways resistance is in the larger airways? What proportion of the airways resistance is in the smaller airways? 80% Larger 20% Smaller

41
Pleth Test Maneuver Door closed for ~1 min to allow for equilibration
Patient sitting up straight, nose clips Hands supporting their cheeks Elbows at their side 41 41

42
TGV Test Maneuver Normal tidal breathing until stable respiratory pattern is achieved At end expiration the shutter is closed Patient is asked to “pant” against the closed shutter for 2 to 3 seconds. After shutter reopens, perform an SVC 42 42

43
Thoracic Gas Volume – “Panting”
Pant Volume: ~50cc Frequency: 0.5 – 1.0 Hz (30 to 60 bpm, although up to 90 is acceptable) Emphasize this is NOT an MVV or MIP/MEP
 Emphasize this is NOT an MVV or MIP/MEP.")
44
Thoracic Gas Volume – “Panting”
Tidal Breathing Shutter Closure 44 44

45
Mouth Pressure vs Box Pressure
How Does It Work? Mouth Pressure vs Box Pressure Mouth Pressure Box Pressure (pleth volume)
")
46
How Does It Work? Mouth Pressure Box Pressure (pleth volume) V / P is the relationship between mouth pressure and box pressure, and can be expressed as the tangent of the angle 46 46

47
Line of “Best Fit” 47 47

48
Importance of “pinned” SVC
Trying to measure TLC TGV efforts can be variable Performing an SVC with the TGV maneuver produces more repeatable TLC values

49
Importance of “pinned” SVC
TGV IC TLC 3.00 1.50 4.50 L 2.50 2.00 3.50 1.00 49 49

50
Airway Resistance Test
Open Shutter Phase Pant with shutter open to determine airway resistance Closed Shutter Phase Pant with shutter closed to measure lung volume – VPant (can be used to measure TGV)
")
51
Airway Resistance Test
Patient performance criteria Small breaths (~50) Consistent, gentle efforts efforts/sec (60 – 90 efforts/min) Emphasize this is NOT an MVV Provide continuous feedback on performance
 Consistent, gentle efforts efforts/sec (60 – 90 efforts/min) Emphasize this is NOT an MVV. Provide continuous feedback on performance.")
52
Airways Resistance – “Quiet Breathing”
Volume: ~50cc Frequency: 0.5 cycle/sec (30 BPM) Glottis opens and closes with each breath, causing Raw to increase Most Raw predicted numbers are based on panting efforts 52 52
 Glottis opens and closes with each breath, causing Raw to increase. Most Raw predicted numbers are based on panting efforts")
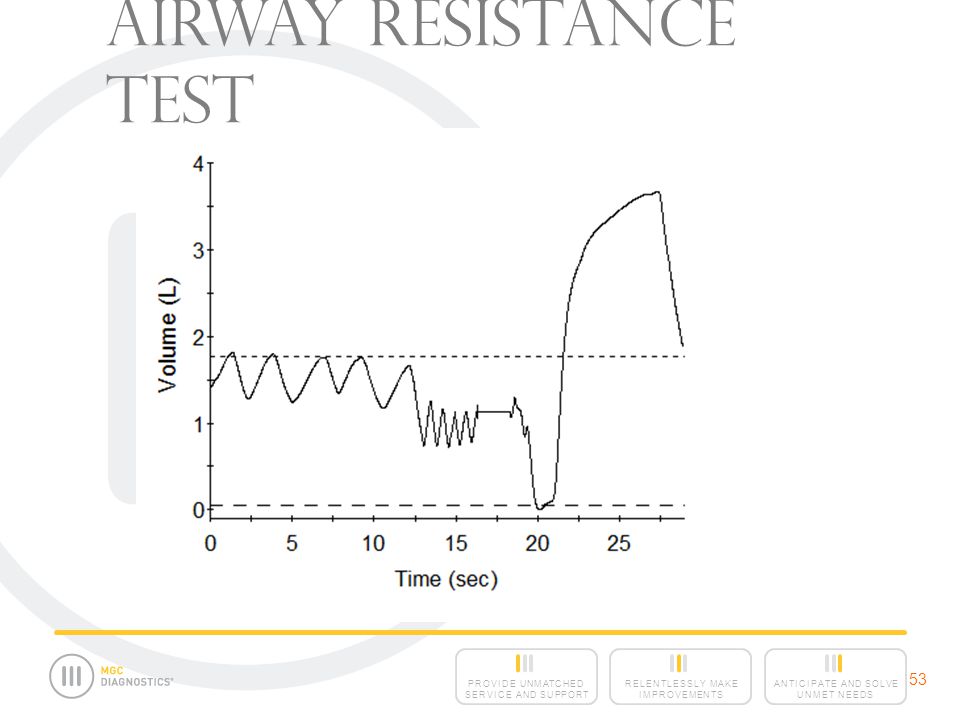
53
Airway Resistance Test
53 53
54
Slope (pressure/volume)
Airway Resistance Slope (pressure/volume) Raw = Slope (flow/volume)
 Raw = Slope (flow/volume)")
55
Airway Resistance In the Lung: Flow = Pressure/ Resistance or
Resistance = Pressure/ Flow Slope of the line is Flow / Box Pressure F L O W BOX PRESSURE

56
Resistance What pressure (cmH20/L/S) does it take to create a certain flow? What pressure does it take to create a standardized flow of .5 L/S? R=Pressure/Flow

57
Line of “Best Fit” In the Lung: Flow = Pressure/ Resistance or
Resistance = Pressure/ Flow Zero Flow 0.5 L/sec F L O W BOX PRESSURE

58
Airway Resistance a) Normal, b) Increased large airway Raw, c) COPD, d) Upper airway obstruction
 Normal, b) Increased large airway Raw, c) COPD, d) Upper airway obstruction")
59
Airway Resistance Airway Collapse Patterns may be better represented by separating Inspiratory and Expiratory Raw.

60
Airway Resistance

61
Airways Resistance and Airway Reactivity
Airways resistance measures significant changes in airway caliber during bronchodilator and bronchoprovocation trials which might not be reflected in spirometry. Airways resistance explains patient’s “perceived” response in the absence of spirometric changes.

62
Bronchodilators with Spirometry
Masking the response of bronchodilators Lung memory and the broncho-dilatory effect of deep inhalations Possible closure of intra-thoracic airways during forced exhalation PRE POST Blast it out!!!!

63
Airways Resistance and Airway Reactivity
From National Jewish Medical Center in Denver: Subjects often report subjective benefit from bronchodilators without demonsting improvement in spirometry

64
Determination of Airflow Obstruction
Flows determined by spirometry inherently incorporate driving pressure and therefore: are effort dependent are insensitive to early obstructive changes especially in a young, motivated subject reflect true obstruction only after significant compromise of airway radius, well beyond the development of symptoms Can overcome obstruction with more force

65
Determination of Airflow Obstruction
Determination of Airways Resistance and Conductance: is effort independent can identify early obstructive changes throughout the tracheobronchial tree will identify obstructive changes, which increase work of breathing, and cause dyspnea, that might otherwise not be identified using spirometry

66
Artificial Resistance
Airflow & Artificial Resistance

67
Determination of Airflow Obstruction
Spirometry Pred Baseline +1.5 cm/H2O/L/s % Change FVC 4.88 4.64 4.58 -1 FEV1 3.84 3.31 3.19 -4 FEV1/FVC 79 72 70 -3 FEFmax 8.99 8.81 6.62 -25 FEF25-75 3.78 2.46 2.28 -7

68
Spirometry Pred Baseline +1.5 cm/H2O/L/s % Change FVC 4.88 4.64 4.58 -1 FEV1 3.84 3.31 3.19 -4 FEV1/FVC 79 72 70 -3 FEFmax 8.99 8.81 6.62 -25 FEF25-75 3.78 2.46 2.28 -7 Airway Mechanics Raw 1.95 3.31 4.82 46 Gaw 1.03 .30 .21 -30 sGaw .25 .08 .05 -38

69
Spirometry Pred Baseline +1.5 cm/H2O/L/s % Change +4.0 FVC 4.88 4.64 4.58 -1 4.59 FEV1 3.84 3.31 3.19 -4 FEV1/FVC 79 72 70 -3 69 FEFmax 8.99 8.81 6.62 -25 6.09 -31 FEF25-75 3.78 2.46 2.28 -7

70
Spirometry Pred Baseline +1.5 cm/H2O/L/s % Change +4.0 FVC 4.88 4.64 4.58 -1 4.59 FEV1 3.84 3.31 3.19 -4 FEV1/FVC 79 72 70 -3 69 FEFmax 8.99 8.81 6.62 -25 6.09 -31 FEF25-75 3.78 2.46 2.28 -7 Airway Mechanics Raw 1.95 3.31 4.82 46 6.66 101 Gaw 1.03 .30 .21 -30 0.15 -50 sGaw .25 .08 .05 -38 0.04

71
Case Study

72
Young Asthmatic Age: 16 Height: 75 in Weight: 268 Sex: M Spirometry Predicted Actual Pre % Predicted FVC 5.54 4.70 85 FEV1 4.79 3.13 65 FEV1/FVC 86 67 FEF25-75% 5.27 2.08 40 FEFmax 9.46 6.27 66

73
Young Asthmatic Age: 16 Height: 75 in Weight: 268 Sex: M Spirometry Predicted Actual Pre % Predicted FVC 5.54 4.70 85 FEV1 4.79 3.13 65 FEV1/FVC 86 67 FEF25-75% 5.27 2.08 40 FEFmax 9.46 6.27 66 Airway Mechanics Raw 1.51 7.17 474 Gaw 0.66 0.14 21 sGaw .019 0.02 11

74
Young Asthmatic Age: 16 Height: 75 in Weight: 268 Sex: M Spirometry Predicted Actual Pre % Predicted Actual Post % Change FVC 5.54 4.70 85 4.73 1 FEV1 4.79 3.13 65 3.40 9 FEV1/FVC 86 67 72 8 FEF25-75% 5.27 2.08 40 2.54 22 FEFmax 9.46 6.27 66 6.32

75
Spirometry Predicted Actual Pre % Predicted Actual Post % Change FVC 5.54 4.70 85 4.73 1 FEV1 4.79 3.13 65 3.40 9 FEV1/FVC 86 67 72 8 FEF25-75% 5.27 2.08 40 2.54 22 FEFmax 9.46 6.27 66 6.32 Airway Mechanics Raw 1.51 7.17 474 0.96 -87 Gaw 0.66 0.14 21 1.04 643 sGaw .019 0.02 11 0.25 1150

79
Airways Resistance and Airway Reactivity
What is a clinically significant response? Raw and SRaw: % SGaw : % Current ATS/ERS Standards use 12% and 200 ml for FVC and/or FEV1 for bronchodilator response

80
Implications Without Airways Resistance:
Patient may not have been correctly diagnosed with reversible airway obstruction. Prescription of inhaler may not have been clinically justified.

81
Airway Resistance Spirometry alone:
May not accurately determine the presence or absence of obstruction May not adequately evaluate airway response to stimuli

82
Airways Resistance and Airway Reactivity
“We conclude that spirometry alone fails to identify reversibility in approximately 15 percent of patients, and most of these patients can be identified by additional plethysmographic measurements…” Smith HR, Irvin CG, Cherniak RM. The Utility of Spirometry in the Diagnosis of Reversible Airway Obstruction. Chest 1992; 101:1577

83
Asthma Management The use of airways resistance to diagnose and monitor the asthmatic can improve the patient’s quality of life and reduce the associated cost of care.

84
Plethysmography: The Benefits
Rapid, accurate functional measurement Multiple measurements < 5 min Quantifies Non-Ventilated Lung TGV-FRC Non-Ventilated lung contributes to Hypoxemia (Resting/Exercise) Dyspnea
 Dyspnea.")
85
Plethysmography: The Benefits
Enhances diagnosis and treatment of obstructive disorders More accurate Lung Volumes compared to lung dilution methods Differential Diagnosis Restriction/Hyperinflation is based on TLC 85 85

86
Plethysmography: The Benefits
More sensitive in diagnosis of airways disease Earlier detection of airways disease More accurate evaluation of airway reactivity (bronchodilation and bronchoprovocation) Enhanced evaluation of upper airway lesions
 Enhanced evaluation of upper airway lesions.")
87
AARC Clincal Practice Guidelines
ATS/ERS Guidelines 87 87

88
Thank You Patrick G Burns Director of Marketing MGC Diagnostics
88 88

Similar presentations


 Grants Chapter 6.>")

