Download presentation
Presentation is loading. Please wait.

1
Labor Market Trends in New York City’s Food Industries
Just Food Conference Teachers College Columbia University April 6, 2014

2
The NYC Labor Market Information Service (NYCLMIS)
Since our formation in 2008, our mission is to provide reliable, user-friendly labor market intelligence to education and workforce development providers and policy makers and help them make informed decisions that are aligned with the realities of the local labor market. We accomplish this by providing: Research studies: issues, industries, and populations Information tools: for providers and jobseekers Strategic consulting: implications of labor market intelligence for policy and practice

3
Major Industry Drivers
Affects? Climate Change Food Sourcing Sustainability Food safety Demographic shifts (e.g., aging, immigration) Purchasing levels and amounts Chronic disease management Income Local tourism Supply chain “margin squeeze” Pricing Zoning and other economic development initiatives Establishing local businesses Real estate prices Workplace safety Low pay (including low tipped minimum wage) Wage theft Lack of benefits Unpredictable and short-scheduling
 Purchasing levels and amounts. Chronic disease management. Income. Local tourism. Supply chain margin squeeze Pricing. Zoning and other economic development initiatives. Establishing local businesses. Real estate prices. Workplace safety. Low pay (including low tipped minimum wage) Wage theft. Lack of benefits. Unpredictable and short-scheduling.")
4
Supply Chain Sector Industry
Agriculture Manufacturing Food Manufacturing Grain and Oilseed Sugar and Confectionery Fruit and Vegetable Preserving Dairy Animal Slaughtering Seafood Bakeries and Tortillas Wholesale Nondurable Goods Wholesale Grocery Wholesale Retail Food and Beverage Stores Grocery Stores Specialty Food Stores Service Food Services Special Food Services Restaurants and Other Eating Places

11
What are the most common food jobs?
Occupation Est Industry Employment Projected Growth Openings per Year Entry Wage Median Wage Combined Food Prep and Serving Workers 52,564 18% 2,120 $16,980 $18,520 Waiters and Waitresses 50,276 12% 3,310 $16,970 $19,540 Cashiers 28,186 9% 3,710 $17,160 $18,960 Cooks, Restaurant 20,291 16% 940 $20,610 $27,630 Food Preparation Workers 13,316 4% 1,010 $17,250 $25,010 Food Preparation and Serving Supervisors 12,625 480 $26,850 $37,760 Stock Clerks and Order Fillers 12,156 -2% 980 $17,190 $20,220 Dishwashers 11,949 770 $17,200 $18,830 Counter Attendants, Cafeteria, Food Concession 9,694 10% $17,150 $19,200 Dining Room and Cafeteria Attendants 8,793 7% 520 $16,990 $18,550 Occupation Est. Employment Proj. Growth Openings per Year Median Wage Food prep and serving workers 52,564 18% 2,120 $18,520 Waiters and waitresses 50.276 12% 3,310 $19,540 Cashiers 28,186 9% 3,710 $18,960 Cooks, Restaurant 20,291 16% 940 $27,630 Food prep workers 13,316 4% 1,010 $25,010 Food prep and serving supervisors 12,625 480 $37,760 Stock clerks and order fillers 12,156 -2% 980 $20,220 Dishwashers 11,949 770 $18,830 Counter attendants 9,649 10% $19,200 Dining room and cafeteria attendants 8,791 7% 520 $18,550 SOURCE | NYSDOL, Staffing Patterns Matrix and Occupational Employment Projections

12
Demand by Occupation (past 90 days)
Volume Food Supervisors 3,334 Waiters/Waitresses 2,083 Cooks, Restaurant 1,557 Chefs and Head Cooks 1,087 Combined Food Preparation and Serving Workers 875 Food Managers 917 Bakers 36 Butchers and Meatcutters 21 Food Batchmakers 14 Food Roasters 3 SOURCE | WANTED Analytics Hiring Demand Dashboard TM

13
Demand for Food Jobs by Industry
(past 90 days) Industries Ads Hotels 165 Full-service restaurants 111 Fast-food restaurants 96 Catering 90 Food retail 56 Recreation facilities 45 Hospitals 22 SOURCE | WANTED Analytics Hiring Demand Dashboard TM
 Industries. Ads. Hotels Full-service restaurants Fast-food restaurants. 96. Catering. 90. Food retail. 56. Recreation facilities. 45. Hospitals. 22. SOURCE | WANTED Analytics Hiring Demand Dashboard TM.")
14
Skills, Tools and Certifications in Demand (past 90 days)
Cutting equipment Food Safety HACCP Quality control ServSafe Catering sales OSHA Bilingual Certified Executive Chef Steam tables Certified Dietary Manager Preventive maintenance Registered Dietitian Credit card machines Certified Restaurant Manager SOURCE | WANTED Analytics, Talent RequirementsTM

15
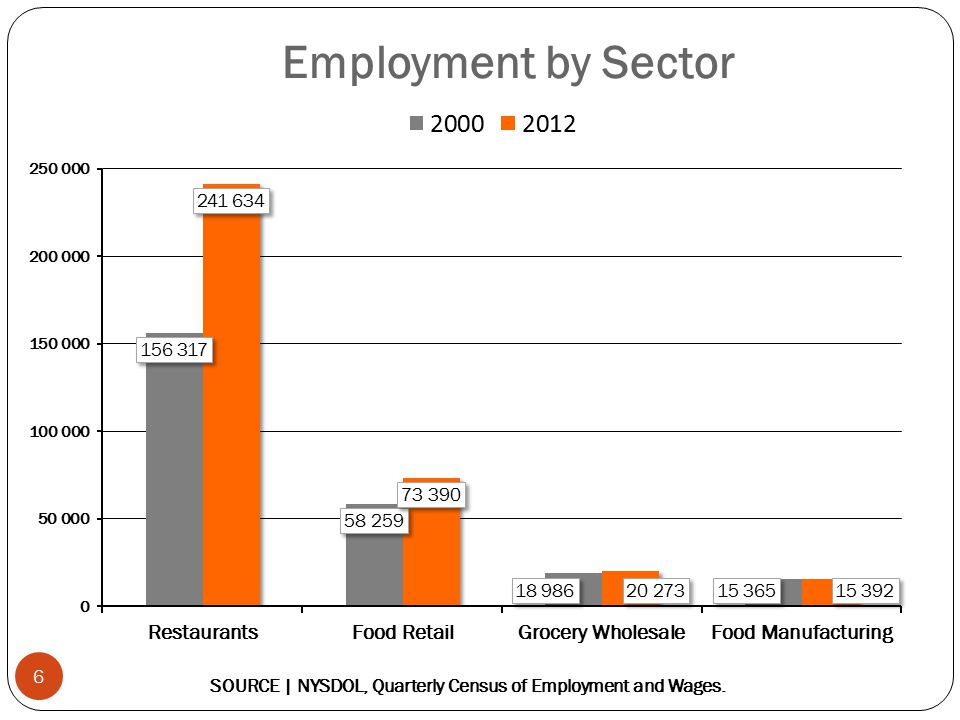
Some Takeaways A range of factors affect the food supply chain, and thus food businesses, from global climate change to local zoning. Food services, by far the largest and fastest growing food sector in New York City, is concentrated in Manhattan. Food retail employment is somewhat more proportionate to population by borough. Brooklyn and Queens lead the pack with the most manufacturing jobs, 5,000 and 4,500 respectively. Brooklyn, Queens, and the Bronx have the most wholesale trade employment. Food retail and wholesale employment has grown over the decade. Employment in food manufacturing, while small, has remained stable over the past decade. Real wages have decreased over the decade, most substantially in manufacturing. Because of the industry mix in New York City, most jobs do not require a college degree. Hotels and full-service restaurants have the most online job ad volume – likely because many smaller, fast-food establishments do not advertise on line.

16
Thank you! Lesley Hirsch NYC Labor Market Information Service
CUNY Graduate Center 365 Fifth Avenue, Room 6202 New York, NY 10016

Similar presentations