Download presentation
Presentation is loading. Please wait.

1
The deep relations between speech and reading Mark S. Seidenberg
Department of Psychology University of Wisconsin-Madison November 3, 2011 Society for Language Development Boston

2
If the science is so good, why is reading achievement so poor?
[preceding talks by Charles Perfetti and Rebecca Treiman] If the science is so good, why is reading achievement so poor?

4
OECD PISA Reading Results 2009
Wall St. Journal, 8/12/2010 Middle-of-the- pack US Performance, as in previous years

5
NAEP Reading Results 4th grade 34 25 8 67% are basic or above
67% are basic or above 67% are basic or below basic

6
NAEP Reading Results 8th grade 43 29 3 Below basic Basic Proficient
Below basic Basic Proficient advanced

7
About 90 million people who don’t read well enough to
engage fully in society manage their own healthcare hold adequately-paying jobs help educate their own children and so on National Assessment of Adult Literacy (2003)
")
8
2011 (downloadable from National Academies) (I am one of multiple authors)
 (I am one of multiple authors)")
9
Why? Many reasons. What are the major ones?
Ones about which we could do something. Here are some possibilities.

10
1. Blame English English spelling is strange. Hard to learn.

11
OECD PISA Reading Results 2009
5. Singapore 6. Canada 7. New Zealand 9. Australia 17. United States

12
Still, people think learning to read English IS hard.
Many alphabets: one letter, one sound Not english English is an outlier even compared to other alphabets. Which have more predictable spelling-sound mappings.

13
English: Deep Welsh: Shallow

14
Italian Spanish German French Finnish Serbian Turkish others
Handbook of Orthography and Literacy, Joshi & Aron (Eds.), Erlbaum 2006
, Erlbaum")
15
Is this true? In these studies,
“learning to read” = read words (and nonwords) aloud But reading aloud ≠ reading (comprehension)
 aloud. But reading aloud ≠ reading (comprehension)")
16
I proved this some years ago.
My Bar Mitzvah My pronunciation was flawless. I didn’t understand a word I was saying. Hebrew (with vowels) is shallow.
 is shallow.")
17
Bar Mitzvah Languages Shallow: can be read without comprehension
Hebrew (vowelled) Italian Welsh Finnish many others. It is also possible to mispronounce words and still know what they mean That’s why learning to read in Albanian is easy. Non-oral Deaf individuals who read English; Words one knows but can’t pronounce correctly. So reading aloud is not a very good index of “reading”
 Italian. Welsh. Finnish many others. It is also possible to mispronounce words and still know what they mean. That’s why learning to read in Albanian is easy. Non-oral Deaf individuals who read English; Words one knows but can’t pronounce correctly. So reading aloud is not a very good index of reading")
18
Languages and writing systems: There are tradeoffs
Deeper simpler morphology Shallower more complex morphology “Grapholinguistic Equilibrium Hypothesis” (Seidenberg, 2011; downloadable from Languages get the writing systems they deserve Serbo-Croatian:couldn’t be like English English: couldn’t be like Serbo-Croatian The “outlier” is actually Italian.

19
2. How reading is taught NRC report on adult literacy:
teaching adults to read is hard available methods are not effective Alternative: do a better job in the first place?

20
Barriers What teachers are taught about reading
For some children, what happens in classroom doesn’t matter. For most children, it definitely does.

21
Barriers Failures to identify, help children with reading/language/learning disabilities No routine pediatric or educational screening for dyslexia “they’ll catch up” Some significant percentage of those 90 million low-literacy adults are undiagnosed, untreated dyslexics

22
We could do better. Change is needed, on the education side especially. Very hard to achieve.

23
3. Poverty Let’s look at the Achievement Gap

24
Reading, math, other areas Seen in
The "achievement gap" refers to disparities in academic performance between groups of students. Minority groups African American Hispanic Native American Income groups Reading, math, other areas Seen in grades, standardized-test scores, course selection, dropout rates, and college-completion rates. Has been going for a long time Has not succumbed to government efforts dating from War on Poverty (1960s) to NCLB (2000s)
 to NCLB (2000s)")
25
For today, I will mostly focus on white-black gap.
Why? large population extensive research societal concern different groups have different circumstances An important issue A complex issue A sensitive issue 30 minutes?

29
(Does it make sense to even try?)
How to identify causes? (Does it make sense to even try?) Other measures yield similar picture.
 Other measures yield similar picture.")
30
Maybe it is all poverty Poverty is associated with
Higher infant mortality rate Atypical brain development Shorter life span Worse health and health care Higher crime rates Lower educational achievement Higher dropout rates Poorer schools with less experienced teachers Poor Reading!!

31
Economists’ Evidence Data: Early Childhood Longitudinal Study 20,000 children Interview data, 4 times during K and 1st grade Many kinds of data about child, family Black-white differences on reading readiness measures Their finding: a small number of measures account for gap at the start of kindergarten.

32
The factors are: Socioeconomic status
Number of children’s books in home Age at kindergarten (months) Birth weight Age of mother at time of first birth WIC (welfare) participant If you eliminate effects of these factors, you eliminate the b-w difference on achievement tests at start of schooling SES compositve measure: parental education, parental occupational status, and household in- come. What do these factors mean? What are the causal mechanisms? All poverty-related.
 Birth weight. Age of mother at time of first birth. WIC (welfare) participant. If you eliminate effects of these factors, you eliminate the b-w difference on achievement tests at start of schooling. SES compositve measure: parental education, parental occupational status, and household in- come. What do these factors mean What are the causal mechanisms All poverty-related.")
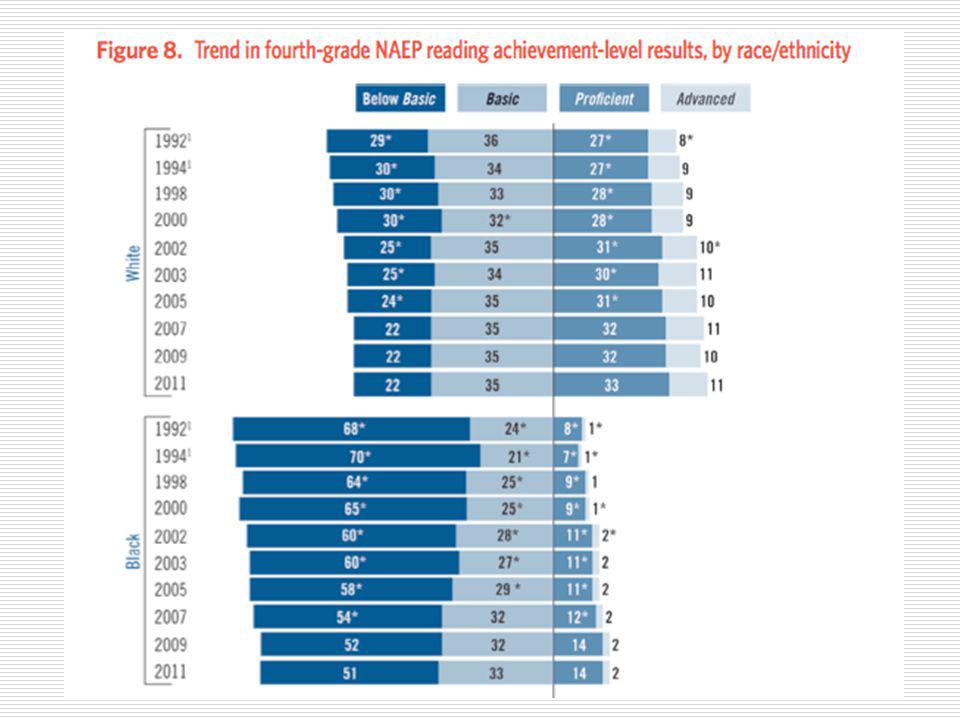
33
Fourth grade Also seen in the NAEP data Eighth grade

34
There is an effect of poverty on scores.
Achievement gap not limited to low=income individuals But the gap is pretty consistent across groups.

35
Economists again The reading test includes questions designed to measure basic skills (print familiarity, letter recognition, beginning and ending sounds, rhyming sounds, and word recognition), vocabulary and comprehension, listening and reading comprehension, knowledge of the alphabet, phonetics, and so on.
, vocabulary and comprehension, listening and reading comprehension, knowledge of the alphabet, phonetics, and so on.")
37
Earlier paper: 6 factors account for gap at start of kindergarten.
Later paper: the gap gets larger over first 3 years of schooling. The 6 factors do not account for this decline. Nor do any others they could find in the data set. The reading test includes questions designed to measure basic skills (print familiarity, letter recognition, beginning and ending sounds, rhyming sounds, and word recognition), vocabulary and comprehension, listening and reading comprehension, knowledge of the alphabet, phonetics, and so on.
, vocabulary and comprehension, listening and reading comprehension, knowledge of the alphabet, phonetics, and so on.")
38
Something else is going on.
It contributes to increasing deficit in K-3 It affects kids from different SES It doesn’t show up in the econometric analyses What is it?

39
Language ECLS data set includes information about other languages spoken in home. But not characteristics of spoken language Which vary greatly. For example: vocabulary size (Risley & Hart, and others) lexical quality (Perfetti)
 lexical quality (Perfetti)")
40
What about dialect? Languages have dialects.
In the US, main distinction between “Standard” or “Mainstream” American English African American Vernacular English/AAE ECLS doesn’t track dialect use

41
African American English
Spoken by most African Americans, regardless of SES 1970s: Research by Labov and then many others documenting properties of AAE Placed it in a broader linguistic context Dialect variation is not specific to English or to African Americans. About the same time that Stokoe and then Klima/Bellugi began characterizing properties of ASL. Had similar impact, in terms of validation

42
AAE and SAE overlap but also differ
Phonology Morphology Syntax Discourse conventions Among others

43
The depth of immersion in AAE varies
Washington-Craig: “dialect density” proportion of utterances that exhibit AAE features Familiarity with standard dialect varies As does degree of code switching

44
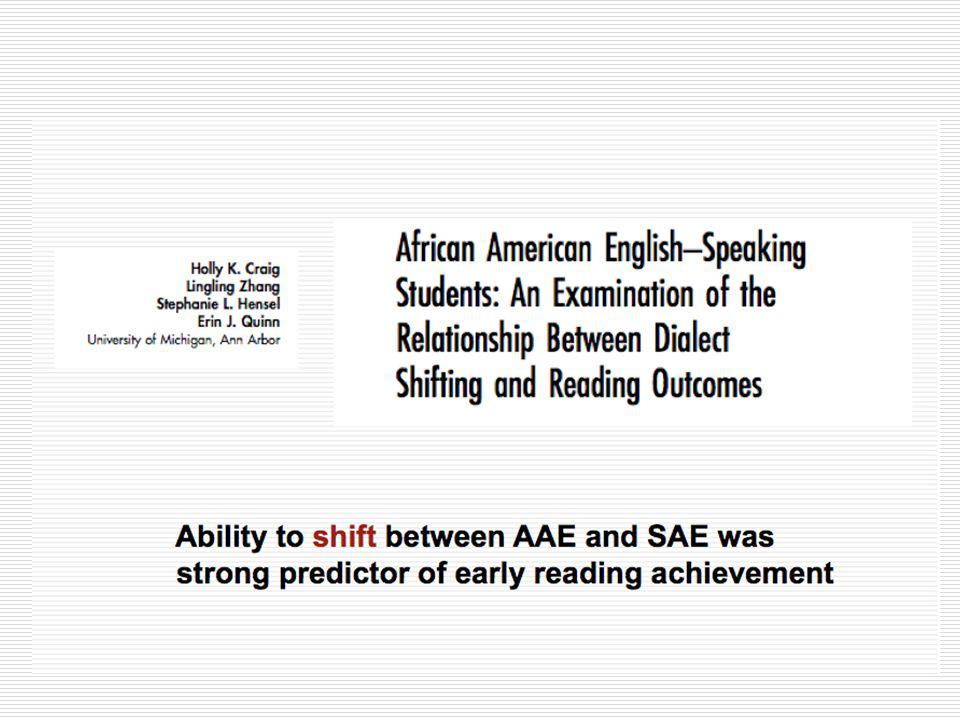
Could dialect differences have an impact on learning to read?

45
Labov recognized potential impact of these various differences on school achievement, particularly reading Dialect mismatch effects Why hasn’t more attention been paid?

46
Extent of impact under-recognized
It’s like global warming isn’t on the table anymore either. But, it’s still there.

47
Attention diverted elsewhere
Early empirical studies reported non effects Socio-cultural controversies about intrinsic value, status Emphasis on validity of dialect overshadowed investigation of impact in the educational context But, it’s like global warming. It’s not in on the table for discussion, but it hasn’t gone away

48
Our thinking Need to establish more direct links between dialect and specific aspects of learning to read Drawing on reading research, theory And relevant research on language learning, plasticity, age-related changes Just like labov’s original research situated AA dialect in a broader linguistic context, we want to situate the impact on learning to read in the broader cognitive science/neuroscience context.

49
Learning spelling-sound relations
Child learns to relate spellings to words in spoken vocabulary What “phonics” is for Strongly related to early reading achievement Difficult for many children Impaired in dyslexia Downstream effects on comprehension Reviews: NRP, Snow “Preventing reading difficulties”

50
Pronunciations in AAE and SAE
Many words pronounced the same (at phonemic level) Many words pronounced differently Percentage varies with dialect density. Estimates: 30% and higher
 Many words pronounced differently. Percentage varies with dialect density. Estimates: 30% and higher.")
51
Major Differences in Pronunciation
Many others. Craig & Washington, 2004 1. Postvocalic consonant reduction MORE /mo/ 2. Substitutions for /th/ WITH /wif/ 3. Devoicing final consonants HIS /hiss/ 4. Consonant cluster reduction WORLD / werl / 5. Consonant transposition ASK /aks / We’re trying to imagine what impact this might have on a beginning reader. GOLD, FLOOR, and LOW rhyme in AAE

52
SAE learner’s task AAE learner’s task
Learn to map spellings onto existing pronunciations AAE learner’s task Learn correspondences between SAE-AAE pronunciations Learn to map spellings onto SAE pronunciations

53
Teacher: G-O-L-D, that’s “gold”
[child searches spoken language vocabulary for “gold”] Child: Ohhh, “gole”

54
The main point AAE learner’s task is more complex
But children are assessed against same achievement milestones Not a problem with the dialect Not a problem with dialect users A problem with the situation Some of the achievement gap is built in. Other factors aside

55
Our research Behavioral experiments Computational models
Pronouncing words aloud Children and adults Computational models Effects experiential differences Entrenchment effects Ways to overcome them

56
Behavioral experiments
African American children, adults Read words aloud Contrastive: different pronunciations bound old toast Non-contrastive: same pronunciation brush air stage Latencies do not differ in ELP data base.

57
Children (N =22, M age =11.4 years old)
Pronunciations were almost all SAE but both were scored as correct Multiple pronunciations a problem for early reader.

58
Adults: N = 32, M age = 35.5 y.o.

59
Summary Both children and adults mainly produce SAE pronunciations
Contrastive words longer latencies (also more errors) For Ss with greater dialect density (more AAE)
 For Ss with greater dialect density (more AAE)")
60
Similar to Harm & Seidenberg (1999) dyslexia model
Computational Model Model allows control of SES Similar to Harm & Seidenberg (1999) dyslexia model
 dyslexia model.")
61
Details Corpus: 1700 words from second grade norms
AAE pronunciations created using 5 most common features of AAE About half the words are the same in AAE-SAE, and half differ Pseudo aae. Not exact.

62
Training Pre-reading: Model learns phonological forms, to 90% correct
Then introduce reading task: Given spelling, generate pronunciation

64
Models learn slowly. Learning based on pretty impoverished input: single tokens of pronunciations, no context, etc. Plasticity: earlier intervention, before one dialect becomes entrenched

67
Why are these findings potentially controversial?
Language Arts, journal of the National Council of Teachers of English

68
What could be done?

69
A. Nothing One group cannot legislate how another group should speak
But AAE is not the dialect of instruction, business, science etc.

70
B. Accommodation Level the playing field!
Recognize dialect differences Modify school practices to take it into account Provide pre-school activities to mitigate effects Do what they do in other countries that have major dialects?

71
An Indian comparison Sonali Nag (York) Chamarajanagar, Karnataka
Mainstream language is Kannada Many tribal dialects Low status Low SES Mainly oral “Bridge year” pre-K Emphasis on exposure to Kannada

72
What Form Could This Take in US?
Preschool activities To promote knowledge of major features of SAE, awareness of differences between SAE and AAE To promote ability to code switch School activities Continue activities focused on improving code-switching ability Increase awareness of problem: teachers and students Provide additional time for initial reading instruction, which takes into account language the child brings to school.

73
Would This Activity Eliminate Effects of Poverty?
No.

74
Would This Increase the Probability of School Success?
It could. Have to do more research! People in this room have lots of relevant expertise. Priming some interest in it.

75
Would This Approach Be Acceptable?
I don’t know. That is a different kind of question.

76
Summary Dialect differences matter
They affect early learning, later performance There are ways that impact could be mitigated “AAE itself is not the cause of reading difficulties so much as lack of knowledge of SAE, given educational and society expectations”

77
Conclusions Reading is deeply dependent on spoken language
Writing systems vs. languages they represent Basic Skills -- decoding Comprehension Language background Of course, literacy also changes spoken language But that is a different talk.

78
Thanks for listening.

Similar presentations


 story: individual differences, learning, & education>")


 project.>")


 Tamara Halle, Nicole Forry, Elizabeth Hair & Kate Perper.>")

